

Abstract
Cardiac T1 mapping allows non-invasive imaging of interstitial diffuse fibrosis. Myocardial T1 is commonly calculated by voxel-wise fitting of the images acquired using balanced steady-state free precession (SSFP) after an inversion pulse. However, SSFP imaging is sensitive to B1 and B0 imperfection, which may result in additional artifacts. Gradient echo (GRE) imaging sequence has been used for myocardial T1 mapping, however its use has been limited to higher magnetic field to compensate for lower signal-to-noise ratio (SNR) of GRE vs. SSFP imaging. A slice-interleaved T1 mapping (STONE) sequence with SSFP readout (STONE-SSFP) has been recently proposed for native myocardial T1 mapping, which allows longer recovery of magnetization (>8 R-R) after each inversion pulse. In this study, we hypothesize that a longer recovery allows higher SNR and enables native myocardial T1 mapping using STONE with GRE imaging readout (STONE-GRE) at 1.5T. Numerical simulations, phantom and in-vivo imaging were performed to compare the performance of STONE-GRE and STONE-SSFP for native myocardial T1 mapping at 1.5T. In numerical simulations, STONE-SSFP shows sensitivity to both T2 and off-resonance. Despite insensitivity of GRE imaging to T2, STONE-GRE remains sensitive to T2 due to the dependence of the inversion pulse performance on T2. In the phantom study, STONE-GRE had inferior accuracy, precision, and similar repeatability as compared to STONE-SSFP. In in-vivo studies, STONE-GRE and STONE-SSFP had similar myocardial native T1 times, precision, repeatability and subjective T1 map quality. Despite lower SNR of GRE imaging readout compared to SSFP, STONE-GRE provides similar native myocardial T1 measurements, precision, repeatability and subjective image quality when compared to STONE-SSFP at 1.5T.
Keywords: Cardiovascular MR (CMR) Methods, Relaxometry, Myocardial T1 mapping, Slice-interleaved T1 mapping, Balanced-steady state free precession, Spoiled gradient echo
Introduction
Magnetic resonance imaging (MRI) based quantitative myocardial T1 mapping is an emerging technique that provides non-invasive in-vivo assessment of tissue characteristics (1–11). Elevated and reduced native T1 times have been observed in the presence of various cardiomyopathies (11–14). Native and post-contrast T1 mapping permit the calculation of the extracellular volume fraction (ECV) (11,15), which shows potential for the detection of diffuse interstitial fibrosis (16) and has prognostic value independent from left ventricular ejection fraction (LVEF) (17,18). In quantitative myocardial T1 mapping sequences, multiple images with different T1-weighting are acquired using electrocardiogram (ECG)-triggered acquisitions (2). The signal intensity of the T1-weighted images is then fit to a physical model of the longitudinal signal recovery on a per-pixel basis (1,2,19,20). Several T1 mapping sequences using different acquisition schemes have been proposed to sample the longitudinal magnetization recovery curve (2–6). Sequences based on the inversion recovery (IR) schemes (2,3) tend to provide superior precision and repeatability than other sequences, at the cost of accuracy (19,21). Most IR-based sequences generate cumulative disturbance of the longitudinal recovery curves due to successive imaging readout. Although the “Look-Locker correction” (22) can be used to reduce this effect, this correction remains imperfect and leads to bias in T1 estimates. The slice-interleaved T1 (STONE) sequence has been recently proposed to provide T1 mapping with full left ventricle coverage using a slice-interleaved data acquisition scheme (7). The STONE sequence uses a novel free-breathing slice-interleaved acquisition scheme, which enables sampling of the undisturbed inversion recovery curve. As a result, STONE has been shown to provide similar precision and improved accuracy compared to the conventional breath-hold modified look-locker inversion recovery (MOLLI) sequence (7).
Because of low signal-to-noise ratio (SNR) of the gradient recalled echo (GRE) imaging sequence for T1 mapping, current T1 mapping sequences at 1.5T are commonly acquired using a balanced-steady state free precession (b-SSFP) imaging readout (2–6). The STONE sequence increases recovery time for each slice, improving the SNR of T1-weighted images, thus making it more favorable for GRE imaging. Therefore, incorporating the STONE sequence may improve the SNR of GRE T1 mapping sequences, potentially increasing the precision and repeatability of T1 mapping sequences that use GRE data acquisition.
Therefore, in this study, we sought to 1) implement the STONE sequence using GRE imaging readout at 1.5T, 2) investigate robustness to T2 and off-resonance using numerical simulations, 3) assess non-inferiority of STONE-GRE compared to STONE-SSFP at 1.5T in terms of accuracy, precision, repeatability and subjective image quality.
Experimental
All imaging was performed on a 1.5T scanner (Philips Achieva, Philips, Best, The Netherlands) with a 32-channel cardiac receiver coil array. This study was Health Insurance Portability and Accountability Act–compliant and approved by our Institutional Review Board. Written informed consent was obtained from each subject prior to imaging.
T1 Map Acquisition Sequence
The STONE sequence provides multi-slice T1 mapping coverage with a free-breathing IR scheme (7). To sample the fully recovered longitudinal magnetization (∞ image), each slice is first acquired without any magnetization preparation pulse. The IR signal is then sampled for all slices using a non-selective inversion pulse followed by single-shot ECG-triggered acquisitions of five slices over the subsequent five heartbeats. A three second rest cycle is then added to enable full recovery of the longitudinal magnetization. This acquisition scheme (5 slice acquisitions - 3 sec rest cycle referred to as “5-(3)” scheme) is repeated five times using different slice orders to obtain signal samples at TI, TI+1 RR, TI+2 RR, TI+3 RR, TI+4 RR (where RR denotes the interval time between two R-waves and TI is the inversion time) for each slice. This block of five “5-(3)” scheme is finally repeated a second time using a different TI value. Prospective slice tracking is performed using a pencil beam navigator positioned on the dome of the right hemi-diaphragm (tracking factor=0.6) (23,24). To obtain TI-independent navigator signal, the signal of the navigator is re-inverted after each inversion pulse using a spatially selective inversion pulse. Though slice tracking is used, no navigator gating is performed. Therefore, the scan time is not increased (100% navigator efficiency).
T1 Map Reconstruction
T1 maps were estimated offline using MATLAB (the Mathworks, Natick, MA) by voxel-wise curve-fitting of the signal with a two-parameter model of the IR signal ( ) defined as follows:
where A and T1 are estimated using a Levenberg-Marquardt optimizer (25). Image registration is applied to reduce in-plane motion between T1-weighted images. For STONE-SSFP, image registration is performed using the adaptive registration of varying contrast-weighted images for improved tissue characterization (ARCTIC) algorithm (26). Due to the low tissue contrast of long TI images in the STONE-GRE, the shortest TI image was used as a reference to estimate the motion between different T1-weighted images using an affine registration approach by minimizing an edge orientation coincidence function (26).
Experimental Validation
Numerical Simulations
Measurement Accuracy
Accuracy of the STONE-SSFP and STONE-GRE sequences were first compared via simulations using MATLAB. The Bloch equations were used to simulate the signal of the STONE-GRE and STONE-SSFP sequences. The image intensity was approximated by the value of the center line of k-space. Accuracy was quantified as the absolute difference between the simulated and calculated T1 time.
T2 Sensitivity
To investigate the sensitivity of the T1 mapping sequence to myocardial T2, numerical simulations were performed by estimating T1 measurements produced by STONE-GRE and STONE-SSFP with given T2 values from 40 to 250 ms in steps of 5 ms. The simulations were repeated for T1 between 400 and 1500 ms in steps of 50 ms.
1) Impact of imaging readout
To investigate the impact of T2 on T1 measurements due to imaging readout/sequence, ideal inversion pulse with perfect inversion factor was assumed. STONE-SSFP sequence was simulated with SSFP imaging readout and the following parameters: TR/TE=2.8/1.4 ms, flip angle=70°, number of phase-encoding lines=43, partial Fourier factor=75%, linear k-space ordering, 10 linear ramp-up pulses, TIs=[∞, 109, 1109, 2109, 3109, 4109, 350, 1350, 2350, 3350, 4350] ms (corresponding to a simulated heart-rate of 60 beats per minutes (bpm)). The phase-encoding index for center-line of k-space was (# start-up pulses) + ceil((# phase-encoding lines)*(partial Fourier factor −0.5)) + 1 = 22. STONE-GRE sequence was simulated with GRE imaging readout and the following parameters: TR/TE=4.3/2.1 ms, flip angle=10˚, number of phase-encoding lines=43, partial Fourier factor=75%, linear k-space ordering, 10 linear ramp-up pulses, TIs=[∞, 109, 1109, 2109, 3109, 4109, 350, 1350, 2350, 3350, 4350] ms. Ideal spoiling of transverse magnetization was assumed for simulating GRE imaging.
2) Impact of inversion pulse
Although adiabatic inversion pulse is robust to field inhomogeneities, it is sensitive to T2. Therefore, inversion factor of adiabatic hyperbolic-secant inversion pulse that was reported previously (27) was used to estimate the inversion efficiency depending on varying T2 values for both sequences. STONE-SSFP and STONE-GRE imaging parameters were similar to those described above.
Off-resonance Sensitivity
T1 measurement accuracy was assessed in the presence of off-resonance. We did not account for the response of an adiabatic inversion pulse in the presence of off-resonance, assuming an ideal inversion pulse. STONE-SSFP and STONE-GRE imaging parameters were similar to those described above. Each simulation was performed with varying T1 between 400 and 1500 ms in steps of 50 ms and fixed T2 of 50 ms. The off-resonance was varied from −300 to 300 Hz in steps of 50Hz.
Phantom Study
Accuracy, precision, and repeatability of the STONE-GRE and STONE-SSFP sequences were characterized in a phantom study by imaging 13 vials (NiCl2 doped agarose), each with a different T1/ T2 times (T1:270ms to 1180ms, T2:50ms to 200ms). The ECG signal was simulated at 60 bpm. Reference T1 times were obtained using spin echo acquisitions with 16 inversion times of: 50, 100, 200, 300, 400, 500, 600, 700, 800, 900, 1000, 1250, 1500, 1750, 2000, 3000ms with the following imaging parameters: TR/TE/flip angle=10s/10ms/90˚, FOV=300×130 mm2, voxel size=1.2×1.2 mm2, slice thickness=8 mm. T1 times were calculated by applying a three-parameter fit model (7) to the 16 inversion spin echo images. Reference T2 times were obtained separately using CPMG sequence with 32 echoes with the following imaging parameters: TR/TE/flip angle=10s/10ms/90˚, FOV=300×130 mm2, voxel size=1.2×1.2 mm2, slice thickness=8 mm. T2 times were calculated by applying a three-parameter fit model (28). The STONE-GRE sequence was then acquired with 15 repetitions using an ECG-triggered single shot acquisition with GRE imaging readout and the following parameters: TR/TE/flip angle=4.3/2.1ms/10˚, FOV=280×272 mm2, voxel size=2×2 mm2, slice thickness=8 mm, slice gap=8mm, number of phase-encoding lines=43, linear k-space ordering, 10 linear ramp-up pulses, a sensitivity encoding (SENSE) acceleration factor=2.5, partial Fourier factor=0.75. The STONE-SSFP was acquired 15 times with b-SSFP imaging readout using an ECG-triggered single shot acquisition and the following parameters: TR/TE/flip angle=2.6/1.3ms/70˚, FOV=280×272 mm2, voxel size=2×2 mm2, slice thickness=8 mm, number of phase-encoding lines=43, linear k-space ordering, 10 linear ramp-up pulses, SENSE factor=2.5, partial Fourier factor=0.75. For both STONE-GRE and STONE-SSFP, the acquired images corresponded to TIs of: ∞, 109, 1109, 2109, 3109, 4109, 350, 1350, 2350, 3350, 4350 ms. All inversion preparation pulses used an adiabatic hyperbolic secant pulse with 11 ms pulse duration. A slice-selective Sinc-Gauss RF excitation pulse with duration of 0.43 ms was used for imaging. T1 maps were generated by voxel-wise parameter fitting using the two-parameter model fit (Equation 1).
A region-of-interest (ROI) was manually defined for each vial in the data obtained with the spin echo acquisition (ROISE). Similarly, a second ROI was defined for each vial in the data obtained with the two studied sequences (ROIseq). Accuracy of each vial (v) was measured as the difference between the average (over the 15 repetitions) of the mean T1 in ROIseq(v) and the mean reference T1 in ROISE(v). Precision for each vial (v) was calculated as the average (over the 15 repetitions) of the T1 standard deviation in ROIseq(v). Repeatability for each vial (v) was calculated as the standard deviation (over the 15 repetitions) of the mean T1 in ROIseq(v).
In-vivo Study in Healthy Subjects
Nine healthy adult subjects (37±22 years, 4 males) were recruited for in-vivo evaluation of repeatability and precision of native T1 mapping using the STONE-GRE and STONE-SSFP sequences. Each subject was imaged 5 times during the same MR-examination with each of the two sequences to assess repeatability of each sequence within a single imaging session.
The STONE-GRE and STONE-SSFP sequences were acquired during free-breathing using ECG-triggered single shot acquisitions. Both sequences had the following common imaging parameters: 5 slices, FOV=280×272 mm2, voxel size=2×2 mm2, slice thickness=8 mm, number of phase-encoding lines=43, 10 linear ramp-up pulses, linear ordering, SENSE factor=2.5, and partial Fourier factor=0.75. The STONE-GRE had TR/TE/flip angle=4.5/2.2ms/10˚, and acquisition window of 192 ms. STONE-SSFP had TR/TE/flip angle=2.8/1.4/70˚, and acquisition window=121ms. Scan times for both sequences were similar, total scan time 1:35 min for a heart-rate of 60 bpm.
Native Myocardial T1 Precision and Repeatability
Precision and repeatability of native T1 mapping were evaluated using a myocardial segment-based analysis (29) and a subject-based analysis. The right ventricular insertion point and endocardial/epicardial borders were manually drawn on five myocardial slices (short-axis planes of basal; mid-basal; mid-cavity; mid-apical; apical) of T1 maps to generate a 26 myocardial segment model (see supplementary material S1). All maps were visually inspected and any segment affected by artifacts was discarded from further analysis. In such cases, the segment would be discarded for one specific repetition scan only (and kept in the remaining 4 repetition scans). The percentage of discarded segments is reported. The precision was defined as the average (over the 5 repetition scans) of the standard deviation of T1 estimates over a given segment. Repeatability was defined as the standard deviation (over the 5 repetition scans) of the spatial average T1 values in one given segment.
In the subject-based analysis, the precision was defined as the average (over the 5 slices) of the standard deviation of T1 estimates over each subject. Repeatability was defined as the standard deviation (over the 5 repetition scans) of the spatial average T1 values in each subject.
Native Blood T1 Repeatability
The blood flow in the ventricles may originate from different regions in the body and may have experienced a different sequence of inversion pulses. For example, blood returning from lower extremities into the heart, may not have experienced the same inversion pulse as those returning from upper extremity. This may cause differences in magnetization recovery in the blood pool within ventricles (19). This may adversely impact T1 measurements of blood used for ECV calculation. For further investigation of T1 measurements of blood pool (prior to contrast) in left and right ventricles (LV/RV), we measured T1 times of LV and RV blood in 5 repetitions of scans for all 9 healthy subjects. Measurements and repeatability of blood T1 values were assessed by manually drawing a region of interest in the blood pool in the RV and LV for each of 5 slices.
Pilot Patient Study
Fourteen patients (48±19 years, 9 males) referred for clinical CMR were recruited to demonstrate the feasibility of native T1 mapping using STONE-GRE and STONE-SSFP in patients. The patient population consisted of patients with suspected or known non-ischemic cardiomyopathy (N=5), hypertrophic cardiomyopathy (N=4), evaluation for endocarditis (N=1), evaluation of atrial septal defect (N=1), arrhythmogenic right ventricular dysplasia (ARVC) (N=1), pericardial effusion (N=1) and aortic regurgitation (N=1). All patients were in sinus rhythm. Each patient was scanned using both STONE-GRE and STONE-SSFP sequences with the same parameters used in the healthy subjects. T1 maps were generated using the two-parameter model fit previously described. Quantitative analysis of myocardial native T1 times was performed in patients using all 5 slices. All maps were visually inspected and any segment affected by severe artifacts was discarded. Average native T1 time over myocardial segments was measured for each subject and each sequence. A subjective qualitative analysis was then conducted by two experienced readers, blinded to the imaging sequence, to assess the overall native T1 map quality using a 4-point scale (1-non diagnostic/no confidence in interpreting T1 estimates in more than half myocardial segment, 2-fair/ confidence in interpreting T1 estimates in at least half of myocardial segments, 3-good/ no confidence in interpreting T1 estimates in at maximum one myocardial segments, 4-excellent/confidence in interpreting T1 estimates in all myocardial segments).
Statistical Analysis
Wilcoxon signed-rank test was used to assess for statistically significant differences between the two sequences in terms of measurements, precision, and repeatability of native T1 estimates in the phantom and in-vivo studies. The Pearson correlation between native T1 estimates using STONE-SSFP and STONE-GRE in the pilot patient study was reported. Wilcoxon signed-rank test was used to test the null hypothesis that the difference of overall T1 map quality scores between the two sequences was zero in patients. Inter-observer agreement was assessed using intra-class correlation coefficient (ICC) analysis. A value of p < 0.05 was considered statistically significant. All statistical analyses were performed using MATLAB.
Results
Figure 1 shows the accuracy of the STONE-GRE and STONE-SSFP sequence obtained in simulations using different myocardial T2 times and off-resonance range for different T1 times. Numerical simulations show sensitivity of STONE-SSFP to T2. Despite insensitivity of GRE imaging to T2, STONE-GRE remains sensitive to T2 due to dependency of adiabatic inversion pulse on T2. The estimated T1 values are sensitive to off-resonance in STONE-SSFP, whereas the STONE-GRE is independent to off-resonance.
Figure 1.
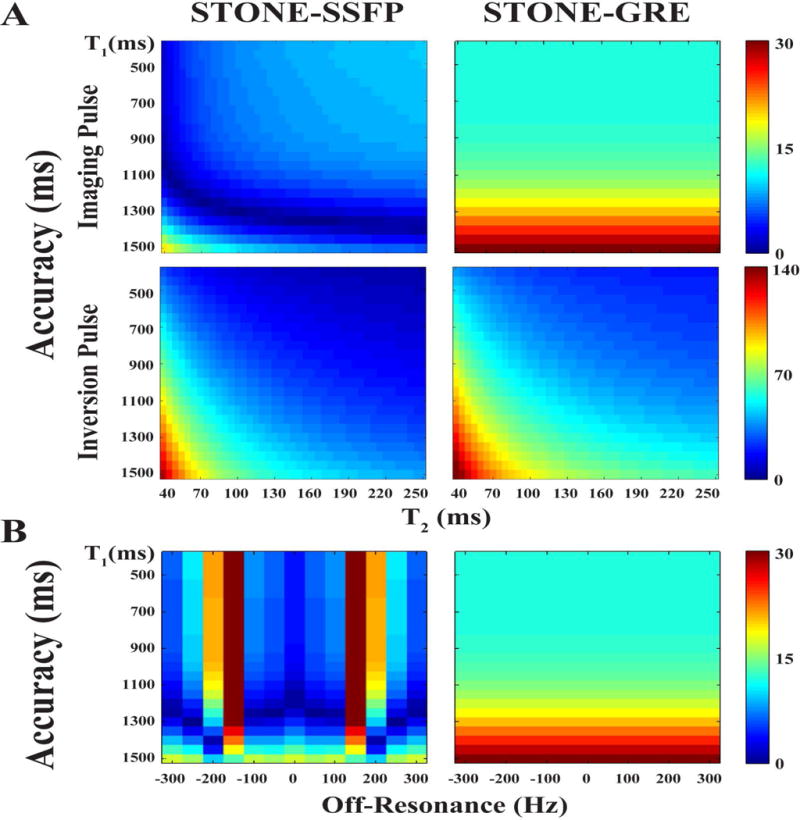
Accuracy of T1 measurements (i.e. differences between actual and estimated T1 in ms) obtained in numerical simulations as a function of T2 times (A) and off-resonance (B) for STONE-SSFP (left column) and STONE-GRE (right column).
Figure 2 reports the accuracy, precision and repeatability of T1 mapping obtained in the phantom study. STONE-GRE provided inferior accuracy (STONE-GRE: −32±23 ms, STONE-SSFP: −18±24 ms, p<0.001), inferior precision (STONE-GRE: 5.87±2.34 ms, STONE-SSFP: 4.92±1.69 ms, p=0.017) and similar repeatability (STONE-GRE: 1.78±0.99 ms, STONE-SSFP: 1.53±0.64 ms, p>0.05) compared to STONE-SSFP.
Figure 2.
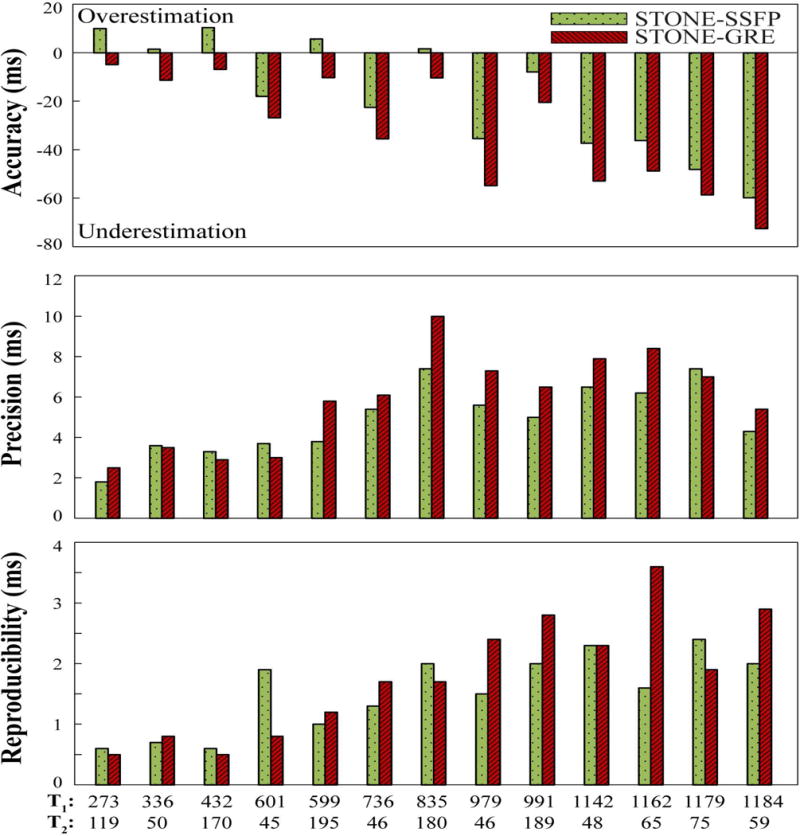
Accuracy, precision and repeatability of STONE-GRE and STONE-SSFP obtained in the phantom with 13 vials with different T1/T2 values. Accuracy was defined as the difference between the averaged T1 times over all 15 repetitions and the spin echo T1 measurements. Precision was defined as the average over all 15 repetitions of the T1 standard deviation within each vial. Repeatability was defined as the standard deviation over all 15 repetitions of the mean T1 times within each vial.
Figure 3 shows example of native T1 maps and corresponding T1-weighted images obtained in one healthy subject using both sequences. Figure 4 shows examples of in-vivo T1 maps obtained with the 5 repetitions of the STONE-GRE and STONE-SSFP sequences in a healthy subject. The T1 maps appear visually homogeneous over all slices and myocardial segments suggesting low spatial variability of T1 times. No artifacts are visible in the T1 maps and the T1 map quality appears visually similar over the 5 repetition scans, which suggests good repeatability of each sequence. The mean and standard deviation of heart rates were 69±7 bpm in healthy volunteers. Figure 5 presents the myocardial segment-based analysis of in-vivo native myocardial T1 mapping in healthy subjects. On average over all subjects, 12.5% of all myocardial segments were removed in the free-breathing STONE-GRE data (17.8%, 5.2%, 4.1%, 7.8%, 32.8% of segments removed in each slice, basal to apical slice), 18.6% of the segments were removed in the free-breathing STONE-SSFP data (39.6%, 4.4%, 4.4%, 9.4%, 38.9% of segments removed in each slice, basal to apical slice). Higher exclusion rate in the most apical or basal slices were due to subjects with smaller ventricular size when the left ventricle could not be covered within apical or basal slices. The rest of segments were removed mainly due to residual motion artifacts. The two sequences provided similar segment-based accuracy (STONE-GRE: 1096±15 ms, STONE-SSFP: 1090±16 ms), segment-based precision (STONE-GRE: 61±10 ms, STONE-SSFP: 54±7 ms) and segment-based repeatability (STONE-GRE: 24±6 ms, STONE-SSFP: 20±4 ms).
Figure 3.

Example native T1 map and corresponding T1-weighted images obtained in one subject using STONE-GRE (top) and STONE-SSFP (bottom) sequence. Inversion time (TI) of selected T1-weighted images were 350ms, 1 RR + 350ms, 2 RR + 350ms, 3 RR + 350ms, and Infinity from left to right (RR: the interval time between two R-waves).
Figure 4.
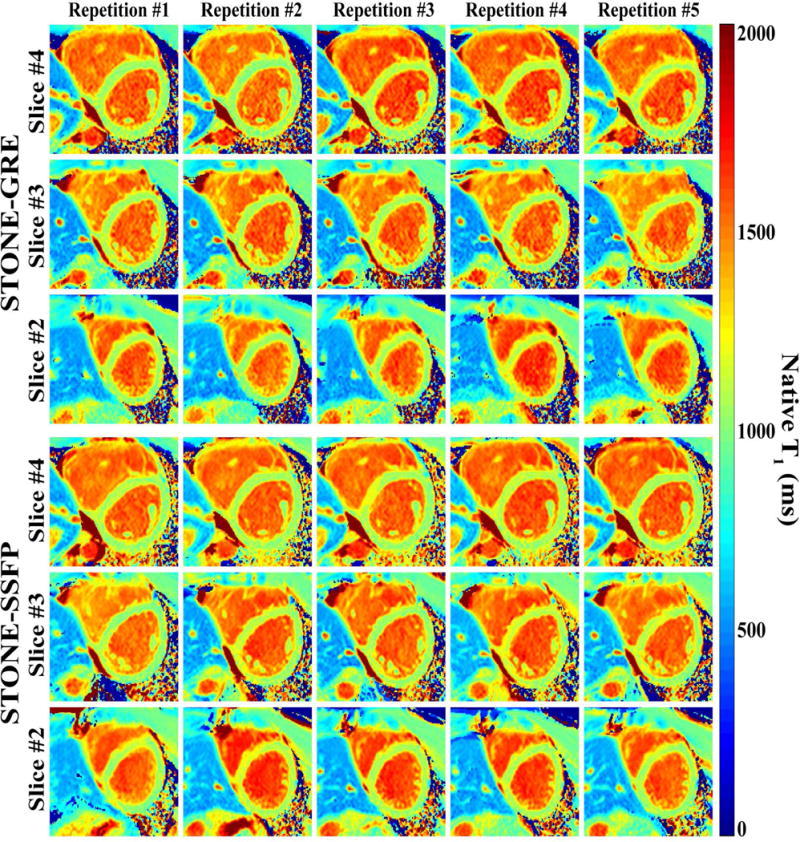
Example of native T1 maps obtained in one subject using the STONE-GRE (top) and the STONE-SSFP (bottom) sequence. T1 maps are shown for the three mid-ventricular slices and five repetitions of each sequence. All T1 maps show homogeneous T1 signal over the entire myocardium, slices, and repetitions.
Figure 5.
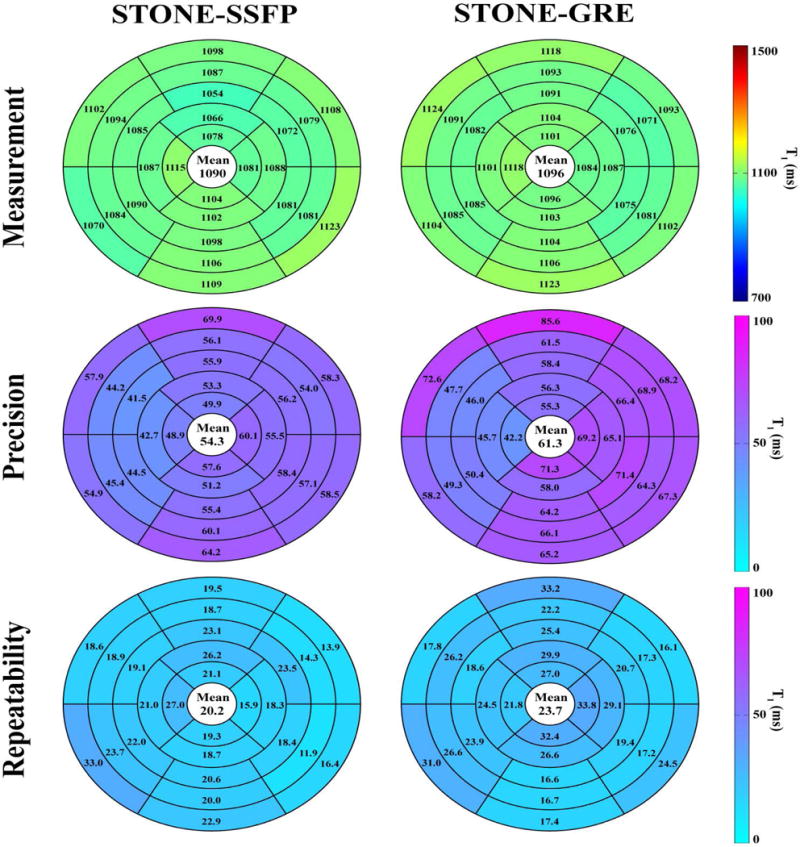
Measurement, precision, and repeatability of STONE-GRE and STONE-SSFP native myocardial T1 over all nine healthy subjects using a myocardial segment model based analysis. Precision was defined as the average over the five repeated scans of the standard deviation of T1 times over each segment. Repeatability was defined as the standard deviation over the five repeated scans of the average T1 times in each segment. STONE-GRE and STONE-SSFP provided similar measurements (STONE-GRE: 1096±15 ms, STONE-SSFP: 1090±16 ms), precision (STONE-GRE: 61±10 ms, STONE-SSFP: 54±7 ms) and repeatability (STONE-GRE: 24±6 ms, STONE-SSFP: 20±4 ms).
Figure 6 shows the subject-based analysis of in-vivo native T1 mapping in the healthy subjects. There were no statistical differences between two sequences in term of subject-based accuracy (STONE-GRE: 1099±24 ms, STONE-SSFP: 1095±14 ms, p>0.05), subject-based precision (STONE-GRE: 69±11 ms, STONE-SSFP: 64±9 ms, p>0.05), and subject-based repeatability (STONE-GRE: 22±7 ms, STONE-SSFP: 15±6 ms, p>0.05).
Figure 6.
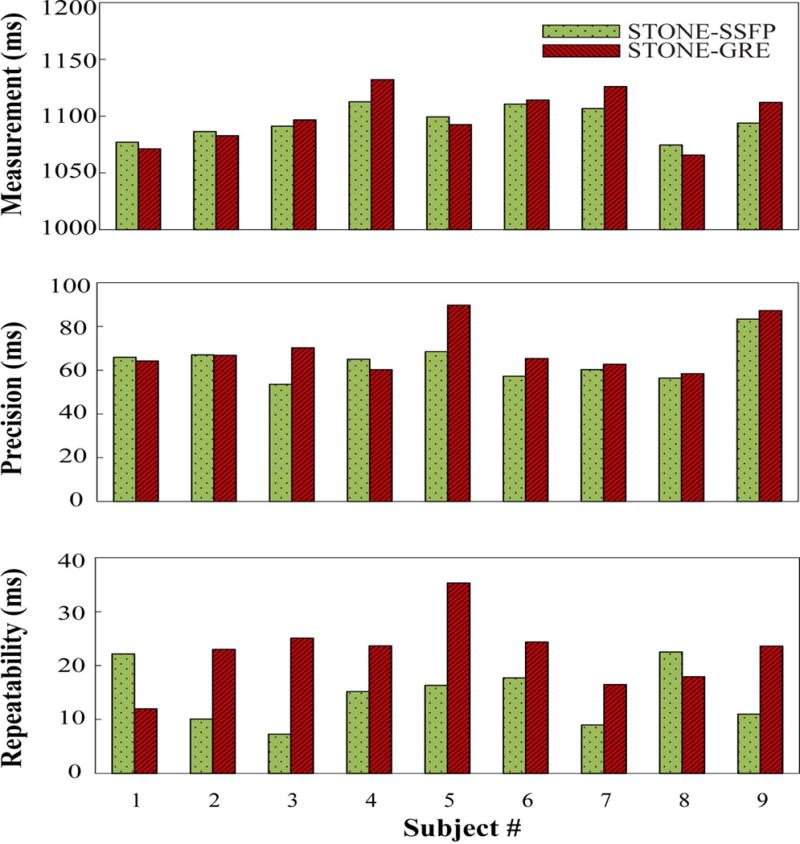
Global myocardial T1 measurements (top panel), precision (middle panel), and repeatability (bottom panel) of STONE-GRE and STONE-SSFP for each individual subject, measured over the entire five slices. There were no statistical differences between the STONE-GRE and STONE-SSFP sequences in term of measurements (STONE-GRE: 1099±24 ms, STONE-SSFP: 1095±14 ms, p>0.05), precision (STONE-GRE: 69±11 ms, STONE-SSFP: 64±9 ms, p>0.05) and repeatability (STONE-GRE: 22±7 ms, STONE-SSFP: 15±6 ms, p>0.05).
Figure 7 shows the analysis of in-vivo T1 measurements of the blood pool per slice in RV/LV for STONE-GRE and STONE-SSFP. There were no statistically significant differences between the two sequences in terms of T1 measurements (RV: 1535±80 ms vs. 1537±106 ms (p>0.05) for STONE-SSFP vs. STONE-GRE, LV: 1578±85ms vs. 1572±104 ms (p>0.05) for STONE-SSFP vs. STONE-GRE). T1 values for RV were systematically smaller as compared to that for LV in both sequences (p=0.03). STONE-SSFP provided better native blood T1 repeatability than STONE-GRE (RV: 26.64±7.04 ms vs. 64.11±7.78 ms, p=0.008, LV: 23.23±7.08 ms vs. 55.18±9.15 ms, p=0.004). There were no statistically significant differences between repeatability in RV and LV (p>0.05).
Figure 7.
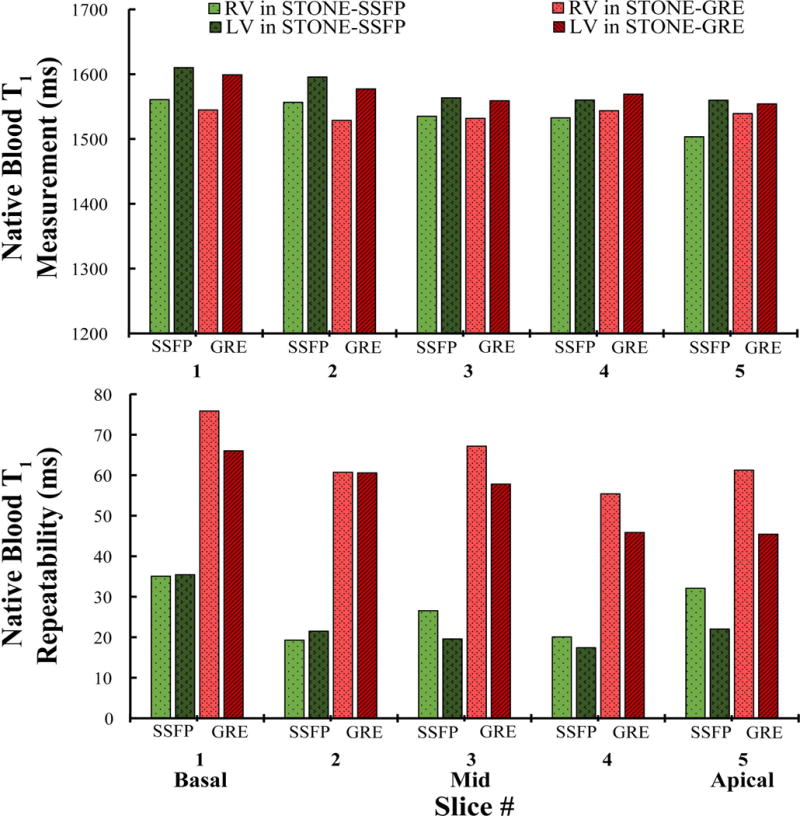
Measurement and repeatability of STONE-GRE and STONE-SSFP native blood T1 in the right and left ventricle (RV/LV). Repeatability was defined as the standard deviation (over the five repetition scans) of the average T1 measurements of blood in each slice (5 slices: 1-basal; 2-mid-basal; 3-mid-cavity; 4-mid-apical; 5-apical). STONE-GRE provided similar native blood T1 measurement (RV: 1537±106 ms vs. 1535±80 ms, p>0.05, LV: 1572±104 ms vs. 1578±85 ms, p>0.05) and inferior repeatability (RV: 64.11±7.78 vs. 26.64±7.04, p=0.008, LV: 55.18±9.15 vs. 23.23±7.08, p=0.004) compared to STONE-SSFP.
Figure 8 shows example native T1 maps of all five slices obtained with STONE-GRE and STONE-SSFP in patients. Both sequences resulted in similar native T1 time (STONE-GRE: 1107±34 ms vs. STONE-SSFP: 1110±31 ms) and were well correlated (r=0.86, p<0.001). Subjective quality scores of T1 maps obtained using a 4-point scale provided good subjective T1 map quality scores for both sequences and there was no difference between the two sequences for both readers (Reader1 – STONE-GRE: 3±0.96 vs. STONE-SSFP: 3±0.96, p>0.05, Reader2 – STONE-GRE: 2.64±0.93 vs. STONE-SSFP: 2.79±0.80, p>0.05). The inter-observer agreement for subjective quality scores of STONE-GRE maps showed strong agreement with an ICC of 0.87 (95% confidence interval: 0.61 to 0.96). The inter-observer agreement for quality scores of STONE-SSFP maps was strong with an ICC of 0.82 (95% confidence interval: 0.42 to 0.94). The mean and standard deviation of heart rates were 66±8 bpm in patients, and typical scan time was 1:40min.
Figure 8.
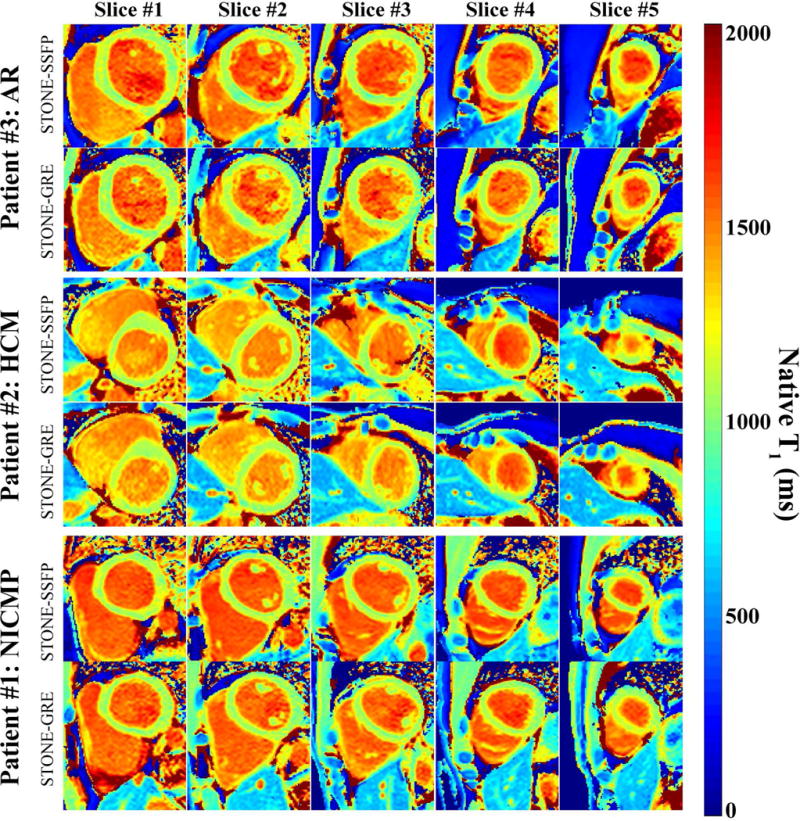
Example native T1 maps obtained with STONE-GRE and STONE-SSFP in patients (patient #1: Non-ischemic cardiomyopathy (NICMP), patient #2: hypertrophic cardiomyopathy (HCM), patient #3: aortic regurgitation (AR)). Both sequences resulted in similar native T1 time (STONE-GRE: 1107±34 ms vs. STONE-SSFP: 1110±31 ms) and were well correlated (r=0.86, p<0.001).
Discussion
In this study, we developed the STONE-GRE sequence using a free-breathing slice-interleaved T1 mapping sequence with magnetization-prepared spoiled gradient echo imaging. We characterized the accuracy, precision and repeatability of native T1 mapping using STONE-GRE and STONE-SSFP. STONE-GRE and STONE-SSFP had similar in-vivo measurement, precision, and repeatability for native T1 mapping. Finally, both STONE-GRE and STONE-SSFP sequences were successfully used in patients, provided good T1 map quality in the majority of the cases.
STONE-GRE and STONE-SSFP T1 values were calculated using a two-parameter model fit (7). These T1 maps can also be reconstructed using a three-parameter model fit (7). The three-parameter model enables modeling of imperfect inversion flip angle and signal disturbances induced by imaging pulses, which results in excellent accuracy (7). However, a three-parameter model fit is more sensitive to imaging/motion artifacts and noise, leading to increased T1 map artifacts and reduced T1 precision (19). Therefore, a two-parameter model fit was used for the reconstruction of all STONE-SSFP and STONE-GRE data in this study.
An adiabatic hyperbolic-secant inversion pulse was used to achieve uniform inversion in the presence of field inhomogeneity. As reported previously, an adiabatic hyperbolic-secant pulse has significant T2 dependency (27), which can impact accuracy. Although GRE imaging readout is independent of T2, the inversion pulse that was employed in this study makes the STONE-GRE T2 sensitive. The use of adiabatic tan/tanh inversion pulse would reduce T2 dependency (27) but was not investigated in this study.
In our study, the flip angle of 10 degree was used for STONE-GRE. A lower flip angle may result in superior SNR, however it will reduce the blood-myocardium CNR. A lower CNR will impact robustness of image registration for motion correction. Further studies investigating the optimal flip angle are warranted.
We observed differences in precision in the blood pool between STONE-GRE and STONE-SSFP. There are differences in the inflow properties of these two sequences (30) which may cause differences in signal behavior. Furthermore, because of slice-interleaved acquisition of STONE sequence, blood at different locations will be excited differently. Despite these differences, the precision of T1 measurements in the blood pool is not as important as myocardium because a large region of interest is often used to calculate blood T1 which is used in the calculation of ECV.
Various factors can impact T1 measurement in both STONE-SSFP and STONE-GRE sequences. In the numerical simulations, there is an increasing underestimation in T1 with higher T1/shorter T2. We believe this is mainly due to longer recovery time required to be fully recovered in the longitudinal magnetization. Furthermore, the error in T1 for STONE-GRE is dependent on the imaging flip angle and therefore the distribution of flip angles across the slice. Numerical simulation shows that higher imaging flip angle yields inferior accuracy (see supplementary material S2). In the phantom study, the accuracy shows similar trends in systemic error with the numerical simulations. There are remaining discrepancies, which may be due to MT effect or SNR in the phantom study. In the in-vivo study, the T1 estimation of ~1100 ms was lower than T1 reported using more accurate T1 mapping sequences such as SASHA or SAPPHIRE (4,5). This underestimation of the in-vivo T1 may be explained with the underestimation of T1 value of ~50 ms in our phantom in vials with relaxation times similar to the myocardium (vial 10: T1=1142 ms, T2=48 ms; vial 11: T1=1162 ms, T2=65 ms). Although there was a general agreement between the T1 measurements between phantom and in-vivo for the two sequences, there were still some discrepancies, which may be related to differences in imaging SNR, MT effect, and heart-rates.
Prior to development of SSFP sequence, GRE imaging had been used for T1 quantification and mapping (22,31). The initial Look-Locker sequence also used a GRE readout (32). GRE has also been employed for post-contrast myocardial T1 mapping using multiple ECG-triggered acquisitions with successive inversion (33) or saturation pulses (34). Short T1 of post-contrast myocardium facilitate use of GRE in post-contrast T1 mapping. A recent study by Shao et. al. (35) introduced use of GRE sequence for native T1 mapping using MOLLI at 3T. However, lower SNR at 1.5T has been a major limitation of using GRE imaging readout at 1.5T, despite its potential to reduce sensitivity to B1 and B0 artifacts as well as reduced T2 dependency. Imaging at higher magnetic field strength, e.g. 3T, is attractive due to the potential gain in SNR. However, imaging at higher field strength is associated with increased off-resonance artifacts. Numerical simulations show that STONE-SSFP is sensitive to off-resonance effects, while STONE-GRE is not affected by off-resonance. Further studies to evaluate the performance of STONE-GRE at 3T are warranted.
Our study has several limitations. The repeatability and precision of STONE-SSFP and STONE-GRE was not characterized in patients. The standard deviation of the T1 times over a segment was used as a surrogate for the precision. Other factors such as variations of tissue T1 over each segment or use of parallel imaging may impact standard deviation. We used a high imaging flip angle of 70˚ for the STONE-SSFP to increase the blood and myocardium contrast and improve robustness of our registration algorithm (26). Our repeatability measurement is limited to within a single MR-examination; we did not re-scan the subjects over multiple sessions. The patient study was performed as a feasibility study to demonstrate image quality.
Supplementary Material
Supplementary Figure S1: Display of the 26 myocardial segments from five slices that were used in the in-vivo study.
Supplementary Figure S2: Numerical simulations of the accuracy of the STONE-GRE with different imaging flip angles. Higher imaging flip angle yields inferior accuracy.
Abbreviations
- GRE
spoiled gradient echo
- b-SSFP
balanced-steady state free precession
- STONE
slice-interleaved T1 mapping
- MOLLI
modified look-locker inversion recovery
- ECV
extracellular volume fraction
- IR
inversion recovery
- TI
inversion time
- LV/RV
left ventricle/ right ventricle
References
- 1.Messroghli DR, Niendorf T, Schulz-Menger J, Dietz R, Friedrich MG. T1 mapping in patients with acute myocardial infarction. J Cardiovasc Magn Reson. 2003;5(2):353–359. doi: 10.1081/jcmr-120019418. [DOI] [PubMed] [Google Scholar]
- 2.Messroghli DR, Radjenovic A, Kozerke S, Higgins DM, Sivananthan MU, Ridgway JP. Modified Look-Locker inversion recovery (MOLLI) for high-resolution T1 mapping of the heart. Magn Reson Med. 2004;52(1):141–146. doi: 10.1002/mrm.20110. [DOI] [PubMed] [Google Scholar]
- 3.Piechnik SK, Ferreira VM, Dall’Armellina E, Cochlin LE, Greiser A, Neubauer S, Robson MD. Shortened Modified Look-Locker Inversion recovery (ShMOLLI) for clinical myocardial T1-mapping at 1.5 and 3 T within a 9 heartbeat breathhold. J Cardiovasc Magn Reson. 2010;12:69. doi: 10.1186/1532-429X-12-69. [DOI] [PMC free article] [PubMed] [Google Scholar]
- 4.Chow K, Flewitt JA, Green JD, Pagano JJ, Friedrich MG, Thompson RB. Saturation recovery single-shot acquisition (SASHA) for myocardial T(1) mapping. Magn Reson Med. 2014;71(6):2082–2095. doi: 10.1002/mrm.24878. [DOI] [PubMed] [Google Scholar]
- 5.Weingärtner S, Akcakaya M, Basha T, Kissinger KV, Goddu B, Berg S, Manning WJ, Nezafat R. Combined saturation/inversion recovery sequences for improved evaluation of scar and diffuse fibrosis in patients with arrhythmia or heart rate variability. Magn Reson Med. 2014;71(3):1024–1034. doi: 10.1002/mrm.24761. [DOI] [PubMed] [Google Scholar]
- 6.Slavin GS, Stainsby JA. True T1 mapping with SMART1Map (saturation method using adaptive recovery times for cardiac T1 mapping): a comparison with MOLLI. J Cardiovasc Magn Reson. 2013;15(1):1–3. [Google Scholar]
- 7.Weingärtner S, Roujol S, Akçakaya M, Basha TA, Nezafat R. Free-breathing multislice native myocardial T1 mapping using the slice-interleaved T1 (STONE) sequence. Magn Reson Med. 2015;74(1):115–124. doi: 10.1002/mrm.25387. [DOI] [PubMed] [Google Scholar]
- 8.Fitts M, Breton E, Kholmovski EG, Dosdall DJ, Vijayakumar S, Hong KP, Ranjan R, Marrouche NF, Axel L, Kim D. Arrhythmia insensitive rapid cardiac T1 mapping pulse sequence. Magn Reson Med. 2013;70(5):1274–1282. doi: 10.1002/mrm.24586. [DOI] [PubMed] [Google Scholar]
- 9.Mehta BB, Chen X, Bilchick KC, Salerno M, Epstein FH. Accelerated and navigator‐gated look‐locker imaging for cardiac t1 estimation (ANGIE): Development and application to T1 mapping of the right ventricle. Magn Reson Med. 2015;73(1):150–160. doi: 10.1002/mrm.25100. [DOI] [PMC free article] [PubMed] [Google Scholar]
- 10.Weingärtner S, Akçakaya M, Roujol S, Basha T, Tschabrunn C, Berg S, Anter E, Nezafat R. Free‐breathing combined three‐dimensional phase sensitive late gadolinium enhancement and T1 mapping for myocardial tissue characterization. Magn Reson Med. 2015;74(4):1032–1041. doi: 10.1002/mrm.25495. [DOI] [PMC free article] [PubMed] [Google Scholar]
- 11.Moon JC, Messroghli DR, Kellman P, Piechnik SK, Robson MD, Ugander M, Gatehouse PD, Arai AE, Friedrich MG, Neubauer S, Schulz-Menger J, Schelbert EB. Myocardial T1 mapping and extracellular volume quantification: a Society for Cardiovascular Magnetic Resonance (SCMR) and CMR Working Group of the European Society of Cardiology consensus statement. J Cardiovasc Magn Reson. 2013;15:92. doi: 10.1186/1532-429X-15-92. [DOI] [PMC free article] [PubMed] [Google Scholar]
- 12.Karamitsos TD, Piechnik SK, Banypersad SM, Fontana M, Ntusi NB, Ferreira VM, Whelan CJ, Myerson SG, Robson MD, Hawkins PN, Neubauer S, Moon JC. Noncontrast T1 mapping for the diagnosis of cardiac amyloidosis. JACC Cardiovasc Imaging. 2013;6(4):488–497. doi: 10.1016/j.jcmg.2012.11.013. [DOI] [PubMed] [Google Scholar]
- 13.Puntmann VO, D’Cruz D, Smith Z, Pastor A, Choong P, Voigt T, Carr-White G, Sangle S, Schaeffter T, Nagel E. Native myocardial T1 mapping by cardiovascular magnetic resonance imaging in subclinical cardiomyopathy in patients with systemic lupus erythematosus. Circ Cardiovasc Imaging. 2013;6(2):295–301. doi: 10.1161/CIRCIMAGING.112.000151. [DOI] [PubMed] [Google Scholar]
- 14.Sado DM, White SK, Piechnik SK, Banypersad SM, Treibel T, Captur G, Fontana M, Maestrini V, Flett AS, Robson MD. Identification and assessment of Anderson-Fabry disease by cardiovascular magnetic resonance noncontrast myocardial T1 mapping. Circ Cardiovasc Imaging. 2013;6(3):392–398. doi: 10.1161/CIRCIMAGING.112.000070. [DOI] [PubMed] [Google Scholar]
- 15.Kellman P, Wilson JR, Xue H, Ugander M, Arai AE. Extracellular volume fraction mapping in the myocardium, part 1: evaluation of an automated method. J Cardiovasc Magn Reson. 2012;14(1):63. doi: 10.1186/1532-429X-14-63. [DOI] [PMC free article] [PubMed] [Google Scholar]
- 16.Mewton N, Liu CY, Croisille P, Bluemke D, Lima JA. Assessment of myocardial fibrosis with cardiovascular magnetic resonance. J Am Coll Cardiol. 2011;57(8):891–903. doi: 10.1016/j.jacc.2010.11.013. [DOI] [PMC free article] [PubMed] [Google Scholar]
- 17.Wong TC, Piehler K, Meier CG, Testa SM, Klock AM, Aneizi AA, Shakesprere J, Kellman P, Shroff SG, Schwartzman DS, Mulukutla SR, Simon MA, Schelbert EB. Association between extracellular matrix expansion quantified by cardiovascular magnetic resonance and short-term mortality. Circulation. 2012;126(10):1206–1216. doi: 10.1161/CIRCULATIONAHA.111.089409. [DOI] [PMC free article] [PubMed] [Google Scholar]
- 18.Wong TC, Piehler KM, Kang IA, Kadakkal A, Kellman P, Schwartzman DS, Mulukutla SR, Simon MA, Shroff SG, Kuller LH, Schelbert EB. Myocardial extracellular volume fraction quantified by cardiovascular magnetic resonance is increased in diabetes and associated with mortality and incident heart failure admission. Eur Heart J. 2014;35(10):657–664. doi: 10.1093/eurheartj/eht193. [DOI] [PMC free article] [PubMed] [Google Scholar]
- 19.Kellman P, Hansen MS. T1-mapping in the heart: accuracy and precision. J Cardiovasc Magn Reson. 2014;16:2. doi: 10.1186/1532-429X-16-2. [DOI] [PMC free article] [PubMed] [Google Scholar]
- 20.Akçakaya M, Weingärtner S, Roujol S, Nezafat R. On the selection of sampling points for myocardial T1 mapping. Magn Reson Med. 2015;73(5):1741–1753. doi: 10.1002/mrm.25285. [DOI] [PMC free article] [PubMed] [Google Scholar]
- 21.Roujol S, Weingärtner S, Foppa M, Chow K, Kawaji K, Ngo LH, Kellman P, Manning WJ, Thompson RB, Nezafat R. Accuracy, precision, and reproducibility of four T1 mapping sequences: A head-to-head comparison of MOLLI, ShMOLLI, SASHA, and SAPPHIRE. Radiology. 2014;140296 doi: 10.1148/radiol.14140296. [DOI] [PMC free article] [PubMed] [Google Scholar]
- 22.Deichmann R, Haase A. Quantification of T1 values by SNAPSHOT-FLASH NMR imaging. J Magn Reson (1969) 1992;96(3):608–612. [Google Scholar]
- 23.Wang Y, Riederer SJ, Ehman RL. Respiratory motion of the heart: kinematics and the implications for the spatial resolution in coronary imaging. Magn Reson Med. 1995;33(5):713–719. doi: 10.1002/mrm.1910330517. [DOI] [PubMed] [Google Scholar]
- 24.Sachs TS, Meyer CH, Hu BS, Kohli J, Nishimura DG, Macovski A. Real-time motion detection in spiral MRI using navigators. Magn Reson Med. 1994;32(5):639–645. doi: 10.1002/mrm.1910320513. [DOI] [PubMed] [Google Scholar]
- 25.Lourakis M. levmar: Levenberg-Marquardt nonlinear least squares algorithms in C/C++ http://www.ics.forth.gr/~lourakis/levmar Published 2004, Updated November 29, 2011, Accessed June 1, 2013.
- 26.Roujol S, Foppa M, Weingartner S, Manning WJ, Nezafat R. Adaptive registration of varying contrast-weighted images for improved tissue characterization (ARCTIC): Application to T mapping. Magn Reson Med. 2015;73(4):1469–1482. doi: 10.1002/mrm.25270. [DOI] [PMC free article] [PubMed] [Google Scholar]
- 27.Kellman P, Herzka DA, Hansen MS. Adiabatic inversion pulses for myocardial T1 mapping. Magn Reson Med. 2014;71(4):1428–1434. doi: 10.1002/mrm.24793. [DOI] [PMC free article] [PubMed] [Google Scholar]
- 28.Akçakaya M, Basha TA, Weingärtner S, Roujol S, Berg S, Nezafat R. Improved quantitative myocardial T2 mapping: Impact of the fitting model. Magn Reson Med. 2015;74(1):93–105. doi: 10.1002/mrm.25377. [DOI] [PMC free article] [PubMed] [Google Scholar]
- 29.Cerqueira MD, Weissman NJ, Dilsizian V, Jacobs AK, Kaul S, Laskey WK, Pennell DJ, Rumberger JA, Ryan T, Verani MS. Standardized myocardial segmentation and nomenclature for tomographic imaging of the heart. A statement for healthcare professionals from the Cardiac Imaging Committee of the Council on Clinical Cardiology of the American Heart Association Circulation. 2002;105(4):539–542. doi: 10.1161/hc0402.102975. [DOI] [PubMed] [Google Scholar]
- 30.Nezafat R, Herzka D, Stehning C, Peters DC, Nehrke K, Manning WJ. Inflow quantification in three-dimensional cardiovascular MR imaging. J Magn Reson Imaging. 2008;28(5):1273–1279. doi: 10.1002/jmri.21493. [DOI] [PubMed] [Google Scholar]
- 31.Nekolla S, Gneiting T, Syha J, Deichmann R, Haase A. T1 maps by K-space reduced snapshot-FLASH MRI. J Comput Assist Tomo. 1992;16(2):327–332. doi: 10.1097/00004728-199203000-00031. [DOI] [PubMed] [Google Scholar]
- 32.Look DC, Locker DR. Time saving in measurement of NMR and EPR relaxation times. Rev Sci Instrum. 1970;41(2):250–251. [Google Scholar]
- 33.Iles L, Pfluger H, Phrommintikul A, Cherayath J, Aksit P, Gupta SN, Kaye DM, Taylor AJ. Evaluation of diffuse myocardial fibrosis in heart failure with cardiac magnetic resonance contrast-enhanced T1 mapping. J Am Coll Cardiol. 2008;52(19):1574–1580. doi: 10.1016/j.jacc.2008.06.049. [DOI] [PubMed] [Google Scholar]
- 34.Higgins DM, Ridgway JP, Radjenovic A, Sivananthan UM, Smith MA. T1 measurement using a short acquisition period for quantitative cardiac applications. Med Phys. 2005;32(6):1738–1746. doi: 10.1118/1.1921668. [DOI] [PubMed] [Google Scholar]
- 35.Shao J, Rapacchi S, Nguyen KL, Hu P. Myocardial T1 mapping at 3.0 tesla using an inversion recovery spoiled gradient echo readout and bloch equation simulation with slice profile correction (BLESSPC) T1 estimation algorithm. J Magn Reson Imaging. 2015 doi: 10.1002/jmri.24999. [DOI] [PMC free article] [PubMed] [Google Scholar]
Associated Data
This section collects any data citations, data availability statements, or supplementary materials included in this article.
Supplementary Materials
Supplementary Figure S1: Display of the 26 myocardial segments from five slices that were used in the in-vivo study.
Supplementary Figure S2: Numerical simulations of the accuracy of the STONE-GRE with different imaging flip angles. Higher imaging flip angle yields inferior accuracy.