

Summary
Coeliac disease (CD) is an inflammatory disorder of the small intestine. It includes aberrant adaptive immunity with presentation of CD toxic gluten peptides by HLA‐DQ2 or DQ8 molecules to gluten‐sensitive T cells. A ω‐gliadin/C‐hordein peptide (QPFPQPEQPFPW) and a rye‐derived secalin peptide (QPFPQPQQPIPQ) were proposed to be toxic in CD, as they yielded positive responses when assessed with peripheral blood T‐cell clones derived from individuals with CD. We sought to assess the immunogenicity of the candidate peptides using gluten‐sensitive T‐cell lines obtained from CD small intestinal biopsies. We also sought to investigate the potential cross‐reactivity of wheat gluten‐sensitive T‐cell lines with peptic–tryptic digested barley hordein (PTH) and rye secalin (PTS). Synthesised candidate peptides were deamidated with tissue transglutaminase (tTG). Gluten‐sensitive T‐cell lines were generated by culturing small intestinal biopsies from CD patients with peptic–tryptic gluten (PTG), PTH or PTS, along with autologous PBMCs for antigen presentation. The stimulation indices were determined by measuring the relative cellular proliferation via incorporation of 3H‐thymidine. The majority of T‐cell lines reacted to the peptides studied. There was also cross‐reactivity between wheat gluten‐sensitive T‐cell lines and the hordein, gliadin and secalin peptides. PTH, PTS, barley hordein and rye secalin‐derived CD antigen‐sensitive T‐cell lines showed positive stimulation with PTG. ω‐gliadin/C‐hordein peptide and rye‐derived peptide are immunogenic to gluten‐sensitive T‐cell lines and potentially present in wheat, rye and barley. Additional CD toxic peptides may be shared.
Keywords: antigen presentation, coeliac disease, gluten, small intestinal T‐cell lines
Coeliac disease (CD), a chronic immune‐mediated small intestinal disorder, affects approximately 1% of individuals in Europe and the USA. The condition is exacerbated by foods containing wheat gluten, comprised of the storage proteins gliadin and glutenin. Rye secalin and barley hordein storage proteins are also known to be the toxic factor in as are oat avenins, in 5% of patients with CD (Lundin et al. 2003). Treatment of CD involves strict compliance to a gluten‐free diet (GFD) with exclusion of wheat, rye and barley (Triticeae).
Wheat gluten, widely used in the food industry, is comprised of gliadin and glutenin proteins. The former comprises the subclasses α‐, γ‐ and ω‐gliadin that has been shown to contain many CD immunogenic peptides (Shan et al. 2005) and the latter high (HMWG) and low (LMWG) glutenins, all three of which have been reported to be CD toxic. Wheat gluten proteins comprise 17–23% proline (P) and 30–36% glutamine (G). Similar percentages of these amino acids (AA) are present in barley hordein and rye secalin. Oats contain relatively lower quantities of storage proteins with lower percentages of proline residues compared with the prolamins in other Triticeae species, including wheat, barley and rye (Schuppan 2000).
HLA‐DQ2 and DQ8 molecules play an important role in determining susceptibility of the disease through the presentation of peptides that are toxic in CD to gluten‐sensitive T cells. Negatively charged gluten peptides are required to bind to either HLA‐DQ2 or DQ8 molecules. This is achieved by deamidation of gluten peptides by tissue transglutaminase (tTG) (Stenberg et al. 2008). This enzyme converts glutamine (Q) residues into glutamic acid (E), which results in not only higher affinity of the peptides to both HLA‐DQ2 and HLA‐DQ8 molecules but also subsequent induction of gluten‐specific CD4+ T‐cell responses in the small intestines of CD‐affected individuals.
Characterization of all the potential CD associated toxic peptides is essential to understanding the pathogenesis of the condition. Little information is available regarding the immunogenic properties of cereals other than wheat. Kilmartin et al. 2006 demonstrated that barley and rye prolamins induce antigenic reactivity in gliadin‐sensitive T‐cell lines generated from CD small intestinal mucosa such that these gramineae need to be excluded from the diet of patients with CD. Evidence suggests that most CD immunogenic peptides are found in α‐gliadin (Shan et al. 2002). A protease‐resistant 33 AA peptide is generally thought to be the most CD immunodominant antigen derived from α‐gliadin that is recognized by gluten‐sensitive T‐cell lines from HLA‐DQ2‐positive CD subjects.
Two peptides were selected following a recent study (Tye‐Din et al. 2010). The first peptide was a wheat ω‐gliadin/C‐barley hordein peptide (QPFPQPEQPFPW) that had exhibited immunodominance in gluten‐sensitive T‐cell clones from peripheral blood mononuclear cells (PBMCs) after wheat, rye and barley challenge. This peptide is comprised of two overlapping CD‐relevant T‐cell epitopes known as DQ2.5‐glia‐ω1 and DQ2.5‐glia‐ω2, according to the latest nomenclature (Sollid et al. 2012). The second peptide, rye‐derived peptide (QPFPQPQQPIPQ) is another CD immunodominant peptide that stimulates T‐cell clones of PBMCs in CD‐affected individuals (Tye‐Din et al. 2010). This peptide lies in epitopes of sec‐α‐2 (Tye‐Din et al. 2010)/DQ2.5‐sec‐2 (Sollid et al. 2012) and sec‐α‐9 (Tye‐Din et al. 2010)/DQ2.5‐sec‐1 (Sollid et al. 2012) that are recognized by CD4+ T cells.
The aim of this study was to investigate the potential CD immunogenicity of these peptides with gluten‐sensitive small intestinal T‐cell lines established from biopsies obtained from individuals with CD. Small intestinal T cells are likely to be more pertinent to CD pathogenesis than PBMCs. We also sought to study the possible cross‐reactivity of CD small intestinal gluten‐sensitive T‐cell lines with peptic–tryptic digested barley hordeins and rye secalin prolamins.
Materials and methods
Subject
Small intestinal biopsies were obtained at endoscopy performed for diagnostic or clinical management purposes in subjects with suspected or known CD. The patients were diagnosed according to British Society of Gastroenterology guidelines with a combination of (i) positive coeliac serology (tTG and endomysial antibodies); (ii) abnormal villous morphology of duodenal biopsies and (iii) the presence of either HLA‐DQ2 or DQ8 genotype. Small intestinal biopsies were obtained from the second part of duodenum from fifteen individuals, median age 47, ranging from 22 to 76 (Table 1).
Table 1.
Details of fifteen CD volunteers included in the study: sex, age, time on a gluten‐free diet (GFD) and DQ status
| Subject | Sex | Age (years) | Diagnosed (year) | GFD (in years) | DQ2 Status |
|---|---|---|---|---|---|
|
WG1 WB1 |
F | 32 | 2011 | 0.33 | DQ2 |
|
WG2 WB3 |
F | 22 | 2007 | 5 | DQ2 |
|
WG3 WB4 |
M | 31 | np | 0 | n/a |
|
WG4 WB5 |
M | 47 | 1997 | 15 | DQ2 |
|
WG5 WR2 |
M | 64 | 2012 | 0.33 | DQ2 |
| WG6 | F | 24 | 2011 | 0.33 | DQ2 |
|
WG7 WB6 |
F | 76 | 1982 | 30 | DQ2 |
| WG8 | F | 29 | 2011 | 0.33 | DQ2 |
| WG9 | M | 50 | 2011 | 0.25 | n/a |
| WG10 | F | 63 | 2011 | 1 | n/a |
| WG11 | F | 30 | 2010 | 2 | DQ2 |
|
WG12 WB7 |
F | 35 | 2010 | 0.25 | DQ2 |
|
WG13 WB8 |
F | 65 | 2012 | 0 | n/a |
|
WG14 WB9 |
F | 60 | 2011 | 0.83 | DQ2 |
|
WB2 WR1 |
F | 56 | np | 0 | n/a |
Small intestinal biopsies were used to generate gluten‐sensitive T‐cell lines (WG samples), barley hordein‐sensitive T‐cell lines (WB samples) or rye secalin‐sensitive T‐cell lines (WR samples). Np stands for new patient, n/a for not available.
Peptic–tryptic digestion of prolamins
Wheat industrial gluten (418, Batch NW652) was purchased from Roquette Ltd, Corby Northants, UK). Pure milled flour of barley (variety Porter) and rye (variety Rheidol) were obtained from Plant Breeding International, Trumpington, UK. Triticeae prolamins were initially prepared by prewashing the milled flours with sodium phosphate buffer (0.4 M) and extraction with 60% ethanol using a standard extraction protocol (Wieser et al. 1994). The prolamin proteins were used to generate peptides by stepwise enzymatic hydrolysis with pepsin from porcine gastric mucosa (Sigma P0609) and trypsin (Sigma T1763), both attached to agarose (Bolte et al. 1996). The peptic–tryptic (PT) digests were used for overnight incubations with the biopsies; the deamidation treatment was not required at this stage as the tissue transglutaminase present in patients’ biopsies deamidated the prolamins.
Peptides
The synthetic peptides with 16 AA residues were purchased from Genscripts USA Inc, synthesized with 95% purity, and checked for purity by reverse‐phase high‐performance liquid chromatography (HPLC) and mass spectrophotometry.
Tissue transglutaminase deamidation
The peptic–tryptic digests, that is (i) PT gluten (PTG), (ii) PT hordeins (PTH) and (iii) PT secalins (PTS), were deamidated with commercially available tissue transglutaminase (tTG) and used in restimulation and subsequent proliferation assays of T cells. Protein concentrations were determined with BCA Protein Assay Kit (Novagen, EMD Chemicals, San Diego, CA, USA) according to the manufacturer's instructions. Deamidation mixes contained 100 μg/ml guinea pig liver (tTG) (Sigma T5398) in PBS containing 1 mM CaCl2 and 370 μg/ml PT digests of prolamins. Incubation was carried out for 4 h at 37°C. The peptides were also deamidated with tTG for which 500 μg/ml of peptides was used due to the smaller size and lower complexity of the sequences.
Generation of gluten‐sensitive small intestinal T‐cell lines
Small intestinal biopsies from participating individuals with CD (n = 15) were cultured for 18 h with 5 mg/ml of PTG (n = 14) or PTH (n = 10) or PTS (n = 2) to establish gluten‐sensitive T‐cell lines, as previously described (Molberg et al. 2000; Ellis et al. 2003). The biopsies were then mechanically disrupted with scalpel blades to break up the tissue, resulting in the release of the lymphocytes that were filtered through a 70‐μm cell filter (Falcon; Becton Dickson Ltd). The cells were cultured with 1x10⁶/ml γ‐irradiated (22 Grey) autologous PBMCs in RPMI (PAA) medium containing 10% heat‐inactivated autologous plasma, 25 μg/ml plasmocin (InvivoGen), 2.5 μg/ml amphotericin B (PAA) and 0.01M HEPES (Sigma H0887).
The cells were restimulated every 7 days with tTG‐deamidated PTG/PTH/PTS and 10U/ml human recombinant interleukin‐2 (IL‐2) (Amersham, High Wycombe). The irradiated autologous PBMCs were cultured overnight with the antigen prior to restimulation. Irradiated autologous PBMCs acted as antigen‐presenting cells (APCs).
T‐cell proliferation assays
T‐cell proliferation assays were undertaken after one or more antigenic restimulations. The antigens tested were tTG‐deamidated PTG, PTH or PTS (100 μg/ml), the ω‐gliadin/C‐hordein peptide (10 μg/ml) and the rye secalin‐derived peptide (10 μg/ml). The T cells and APC with PHA served as positive controls at a final concentration 10 μg/ml. PBMCs (5 × 10⁴/well) were irradiated (22 Grey) to prevent APC proliferation.
The APCs were then incubated at 37°C for 18 h for the more complex antigens (deamidated PTG/PTH/PTS) and 4 h for the smaller peptides, prior to addition of T cells (5 x 10⁴/well). All tests were established in triplicate. Following 48 h of incubation, 1 μCi 3H‐thymidine (Amersham International) was added to the wells and the plates were incubated for a further 18 h to allow 3H‐thymidine incorporation prior to harvesting. The cells were harvested onto glass fibre mats (Wallac, Turku, Finland) with a 1450 Microbeta harvester 96 (Tomtec, USA). Thymidine incorporation was measured using a liquid scintillation counter (Wallac). Proliferative responses to antigens were regarded as positive if the stimulation indices (S.I) were > 2.0, which was calculated by dividing the mean of counts per minute (cpm) for T cells plus APCs plus antigen by the mean of cpm for T cells plus APCs only.
Statistical analyses
Statistical analyses were performed using GraphPad Prism 5.0 for Windows in this study. As the number of samples is small and the data distribution is skewed (according to Gaussian distribution), we employed a nonparametric Kruskal–Wallis test followed by Dunn's multiple comparisons test to analyse the results. The medians of each tested antigen from all patients were compared with the median of PTG or PTH, depending on the antigen used to sensitize the cells at the initial stage.
Ethical approval
The study has been performed according to the Declaration of Helsinki, and the procedures have been approved by the St. Thomas Hospital (Research) Ethics committee (05/Q0207/167). All participating subjects provided written informed consent.
Results
Establishment of PTG‐sensitive T‐cell lines
Fourteen wheat gluten‐sensitive T‐cell lines were generated. T‐cell lines from individuals with CD demonstrated high proliferative responses to the antigen PTG, with stimulation indices (S.I) ranging from 2.6 to 62.6 (median = 8.28). Strong reactivity was also shown to both peptides, in the majority of the CD‐affected subjects. Positive responses to the ω‐gliadin/C‐hordein peptide and the rye‐derived peptide were displayed in most of the gluten‐specific T‐cell lines, with S.I varying from 2.17 to 126.95 (median = 3.06) and 2.48 to 91.31 (median = 2.69) respectively.
Our study has also demonstrated cross‐reactivity between wheat gluten‐sensitive T‐cell lines with PTH (n = 10), with S.I ranging from 3.28 to 77.54 (median = 4.2), and PTS (n = 9), with S.I of 2.8 to 23.16 (median = 5.03). Responses to the substrate PHA (data not shown) were high, indicating that the cells were proliferating in response to this mitogen. The results of S.I are presented for all the tested antigens (Figure 1) with respect to the individual patients (Figure 2).
Figure 1.

Each dot represents a stimulation index (S.I) for an individual assay. The lines represent the medians of the value for each tested antigen; ns indicates not significant (compared with PTG). PTG is peptic–tryptic gluten; PepG is ω‐gliadin/C‐hordein; peptide PepR is rye‐derived peptide (QPFPQPQQPIPQ); PTH is peptic–tryptic barley hordein; and PTR is peptic–tryptic rye secalin.
Figure 2.

Stimulation indices (S.I) of small intestinal wheat gluten‐sensitive T‐cell lines (n = 14) tested in proliferation assays with three Triticeae prolamins (PTG, PTH, PTR) and two potential CD toxic peptides (PepG and PepR). Each bar corresponds to S.I obtained per antigen tested with 14 TCLs, labelled as WG1‐14 (patients studied with wheat gluten). A line at S.I of 2 across the bars distinguishes positive from negative results of proliferation assays. PTG is peptic–tryptic gluten; PepG is ω‐gliadin/C‐hordein; peptide PepR is rye‐derived peptide (QPFPQPQQPIPQ); PTH is peptic–tryptic barley hordein; and PTR is peptic–tryptic rye secalin.
Establishment of PTH‐sensitive T‐cell lines
Nine barley hordein‐sensitive T‐cell lines were derived, as shown by positive S.I of 2.1 to 12.43 (median = 3.75) to PTH. PTH‐sensitive T‐cell lines were also positive to ω‐gliadin/C‐hordein peptide and rye‐derived peptide, with S.I ranging from 2.77 to 30.85 (median = 3.55) and 2.04 to 40.71 (median = 3.69) respectively.
All the barley hordein‐specific T‐cell lines displayed cross‐reactivity to PTG, with S.I varying between 2.25 and 59.6 (median = 7.4). The results of S.I were shown for each tested antigen (Figure 3) with respect to individual patients (Figure 4).
Figure 3.

Each dot represents a stimulation index (S.I) for an individual assay. The lines represent the medians; ns indicates not significant (compared with PTG). PTG is peptic–tryptic gluten; PepG is ω‐gliadin/C‐hordein; peptide PepR is rye‐derived peptide (QPFPQPQQPIPQ); and PTH is peptic–tryptic barley hordein.
Figure 4.
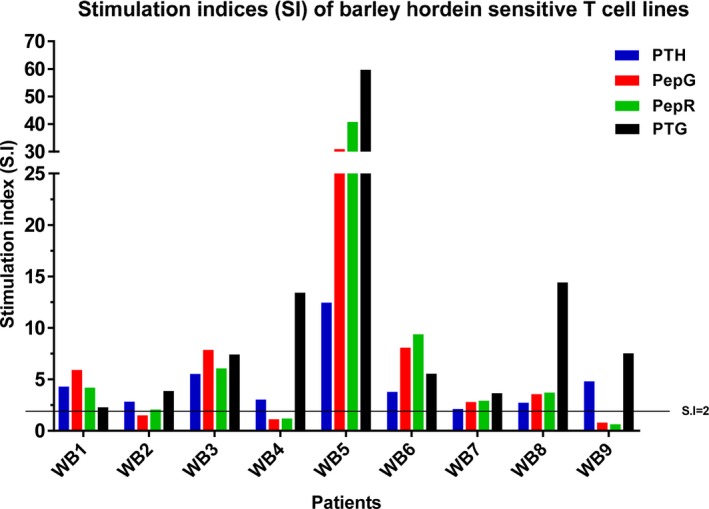
Stimulation indices (S.I) of barley hordein‐sensitive T‐cell lines (n = 9) tested in proliferation assays with three Triticeae prolamins (PTG, PTH, PTR) and two potential CD toxic peptides (PepG and PepR). Each bar corresponds to the S.I obtained per antigen tested with nine TCLs, labelled as WB1‐9 (patients studied with barley hordein). A dotted line at S.I of 2 distinguishes positive from negative results of proliferation assays. PTG is peptic–tryptic gluten; PepG is ω‐gliadin/C‐hordein; peptide PepR is rye‐derived peptide (QPFPQPQQPIPQ); PTH is peptic–tryptic barley hordein; and PTR is peptic–tryptic rye secalin
Establishment of PTS‐sensitive T‐cell lines
Two rye secalin‐sensitive small intestinal T‐cell lines were established indicated by positive S.I of 2.37 and 6.21 to PTS. The T‐cell line from patient WR1 demonstrated cross‐reactivity to the ω‐gliadin/C‐hordein and the rye‐derived peptides, with stimulation indices of 3.33 and 2.78 respectively. Positive responses from patient WR2 were shown for ω‐gliadin/C‐hordein peptide (S.I: 10.2) and PTG (S.I: 11.2). However, there was no cross‐reactivity to the rye‐derived peptide, with S.I < 2.0. Responses to the mitogen were positive confirming viability of the cells. The results of S.I were shown for each tested antigen (Figure 5).
Figure 5.

Each dot represents a stimulation index (S.I) for an individual assay. PTG is peptic–tryptic gluten; PepG is ω‐gliadin/C‐hordein; peptide PepR is rye‐derived peptide (QPFPQPQQPIPQ); and PTR is peptic–tryptic rye secalin.
Discussion
Investigation of toxicity of gluten fractions and peptides was undertaken with CD small intestinal wheat gluten‐sensitive T‐cell lines (Dewar et al. 2006; De Vincenzi et al. 2010) as wheat is consumed widely in most populations. Kilmartin et al. (2006) generated gluten‐specific small intestinal T‐cell lines by coculturing them with gliadin and then restimulating them with gliadin, glutenin, barley hordein and rye secalin fractions. The antigenic reactivity of T‐cell lines restimulated with barley hordein and rye secalin might have been a reflection of the earlier sensitivity to CD toxic wheat gliadin. In this study, we preferred to establish gluten‐specific T‐cell lines by directly coculturing with PTG or PTH or PTS as stimulating antigens.
PTG, as opposed to gliadin, was used as the stimulating antigen in the majority of individuals with CD. This was because we assumed that there are antigenic determinants present in high and low molecular weight glutenins which could be missed if gliadin alone was used. Besides PTG, T‐cell lines were derived from CD small intestinal biopsies to cereal prolamin fractions of barley (PTH) and rye (PTS). This is the first study, to our knowledge, utilizing this approach. Interestingly, this study has demonstrated the ability of these prolamins to activate T‐cell responses in small intestinal T‐cell lines obtained from duodenal biopsies from individuals with CD. It would thus be interesting to demonstrate the potential of barley and rye to sensitize small intestinal immune responses at an initial stage.
Besides wheat gluten, barley hordein, rye secalin and candidate peptides are high in proline and glutamine. Hence, the antigens were exposed to tTG enzyme for deamidation to enhance their CD immunogenicity. Several studies have demonstrated the preference and recognition of gliadin peptides following the exposure to tTG enzyme (Molberg et al. 1998; van de Wal et al. 1998; Arentz‐Hansen et al. 2000). Deamidation generates negative charges in prolamins and peptides, converting glutamine (G) to glutamic acid (E), thus facilitating their binding to HLA‐DQ2 and DQ8 molecules. This is thought to contribute to the observed small intestinal responses in CD. Our initial experiments were unsuccessful probably because the peptides were not deamidated (data not shown).
The established small intestinal gluten‐derived T‐cell lines exhibited cross‐reactivity to other PT prolamins as well as to the initial peptides. The demonstration of cross‐reactivity is observed between (i) wheat gluten‐sensitive T‐cell lines with PTH (n = 10) and PTS (n = 9), (ii) barley hordein‐sensitive T‐cell lines with PTG (n = 9) and (iii) rye secalin‐sensitive T‐cell lines with PTG (n = 2). These results suggest that barley hordein and rye secalin share certain CD associated toxic epitopes that are no less important than wheat gluten in exacerbating CD. The toxicity of these prolamins is also indicated by the fact that majority of the gluten T‐cell lines described above demonstrated immunoreactivity to a ω‐gliadin/C‐hordein peptide and the rye secalin‐derived peptide. We utilized T‐cell lines rather than clones as the latter would result in recognition of only a limited number coeliac toxic motifs and thus would not represent the whole repertoire of gluten‐reactive T cells within coeliac lesions.
In the wheat gluten‐specific T‐cell lines, responses to deamidated gluten were generally greatest compared with the other antigens tested. However, responses to PepR were occasionally greater than responses to gluten and often almost comparable to that of PepG. The observation that a pure immunogenic peptide drives a greater response than a mix of peptides some of which have no or very little immunogenicity is not surprising. The data suggests that PepR, known to contain partial sequence homology of the wheat gliadin PepG, may stimulate quite actively some of the heterogeneous T cells within the T‐cell lines tested. Had we gone on to clone these cell lines, this difference in response may have been seen; however, it was not the intent or within the scope of this work to dissect out clonal responses.
The T‐cell responses to both peptides and PT prolamins may vary between individuals with CD (Figure 4). Gluten‐sensitive T‐cell lines of patients WG4 and WG10 were found to be significantly high, although the response was assessed only after one (WG4) or two (WG10) antigenic restimulation(s). In patients WG4, the S.I to PTG is ten times greater than the average S.I with gluten‐sensitive T cells from CD small intestinal biopsies. Both ω‐gliadin/C‐hordein peptide and the rye secalin‐derived peptide exhibited a high level of CD immunogenicity. The proliferative response of this line (WG4) to PTH and PTS was also very high, indicating that T‐cell line from this CD individual was very sensitive to Triticeae prolamins. This individual has had positive serology during the early diagnosis and had been taking a GFD for >15 years. The T‐cell lines obtained from individual WG10 exhibited significant cross‐reactivity to all the tested antigens although low numbers of cells were observed after the first restimulation.
Heterogeneous responses were also observed with the barley hordein‐sensitive T‐cell lines (Figure 5). In patient WB5, the proliferative responses to PTG, peptide ω‐gliadin/C‐hordein and peptide rye secalin‐derived peptide were high. This is unsurprising as the biopsies of patient WB5 were from the same patient (WG4) used to generate gluten‐sensitive T‐cell lines and exhibited high levels of cross‐reactivity to all the prolamins utilized. Several T‐cell lines sensitive to barley hordeins have been generated from biopsies of patients with CD, which were successfully used to generate wheat gluten‐sensitive T‐cell lines in parallel experiments. However, we found that not all the T‐cell lines from the same patient reacted in the same way to wheat gluten, when PTH or PTS was used as the initial stimulating antigens. For example, T‐cell lines of WG13 had shown a high S.I of 10.2 (to wheat gluten), whereas, when T cells were obtained from biopsies of the same patient, using PTH as the initial stimulating antigen (WB8), the stimulation index to PTH was rather low (S.I = 2.7).
We sought to culture T‐cell lines sensitive to rye secalin, but only two lines were generated. It proved difficult to establish secalin‐sensitive T‐cell lines from CD small intestinal biopsies. This is shown where the WR1 line had to be restimulated thrice before a sufficient number of T cells could be obtained to undertake T‐cell proliferation assays. Both T‐cell lines specific to rye secalin exhibited cross‐reactivity to ω‐gliadin/C‐barley hordein peptide, but only one of the lines cross‐reacted with the rye secalin‐derived peptide. Coeliac individuals may be less frequently exposed to rye and barley prolamins. This may be because wheat is used more widely in the food industry, such that it has become more popular in the Western diet compared with rye and barley.
Our work has confirmed the possibility of generating CD‐sensitive small intestinal T‐cell lines to other Triticeae prolamins besides wheat gluten or gliadin. Conceivably, in vivo challenge is no longer necessary for wheat gliadin and CD toxic gliadin peptide investigations.
Conclusions and future directions
The cross‐reactivity of the peptides in most of the Triticeae‐sensitive CD small intestinal T‐cell lines indicates that these peptides are CD immunogenic, and thus likely to be toxic to individuals with CD. These CD toxic peptides could be used to generate monoclonal antibodies for use in improved assays with increased sensitivity and specificity to quantify CD toxic fractions in foods labelled gluten‐free for these individuals.
In conclusion, barley hordein and rye secalin appear to contain CD toxic epitopes that are found in wheat gluten, as demonstrated by the observed cross‐reactivity of CD‐derived gluten‐sensitive small intestinal T‐cell lines to wheat gliadin, barley hordein and rye secalin‐derived peptides.
Conflict of interest
The authors have no conflict of interest to declare.
Funding source
The funding sources were the Ministry of Higher Education, the Malaysian Government, the International Islamic University of Malaysia and The Clinical Research Trust.
Acknowledgements
WAW thanks the Ministry of Higher Education, Malaysia, and International Islamic University of Malaysia for funding. TS thanks Clinical Research Trust for funding. The authors thank Dr Suzanne Donnely for her help with patients’ selection, interpretation of clinical data and helpful discussions.
References
- Arentz‐Hansen E.H., Körner R., Molberg Ø. et al (2000) The intestinal T cell response to α‐gliadin in adult celiac disease is focused on a single deamidated glutamine targeted by tissue transglutaminase. J. Exp. Med. 191, 603–612. [DOI] [PMC free article] [PubMed] [Google Scholar]
- Bolte G., Osman A., Mothes T. & Stern M. (1996) Peptic‐tryptic digests of gliadin: contaminating trypsin but not pepsin interferes with gastrointestinal protein binding characteristics. Clin. Chim. Acta 247, 59–70. [DOI] [PubMed] [Google Scholar]
- De Vincenzi M, Vincentini O, Di Nardo G, Boirivant M., Gazza L., Pogna N. (2010) Two prolamin peptides from durum wheat preclude celiac disease‐specific T cell activation by gluten proteins. Eur. J. Nutr. 49, 251–255. [DOI] [PubMed] [Google Scholar]
- Dewar D.H., Amato M., Ellis H.J. et al (2006) The toxicity of high molecular weight glutenin subunits of wheat to patients with coeliac disease. Eur. J. Gastroenterol. Hepatol. 18, 483–491. [DOI] [PubMed] [Google Scholar]
- Ellis H.J., Pollock E.L., Engel W. et al (2003) Investigation of the putative immunodominant T‐cell epitopes in coeliac disease. Gut 52, 212–217. [DOI] [PMC free article] [PubMed] [Google Scholar]
- Kilmartin C., Wieser H., Abuzakouk M., Kelly J., Jackson J. & Feighery C. (2006) Intestinal T‐cell responses to cereal proteins in celiac disease. Dig. Dis. Sci. 51, 202–209. [DOI] [PubMed] [Google Scholar]
- Lundin K.E.A., Nilsen E.M., Scott H.G. et al (2003) Oats induced villous atrophy in coeliac disease. J. Gastroenterol. Hepatol. 52, 1649–1652. [DOI] [PMC free article] [PubMed] [Google Scholar]
- Molberg Ø., McAdam S.N., Körner R. et al (1998) Tissue transglutaminase selectively modifies gliadin peptides that are recognized by gut‐derived T cells in celiac disease. Nat. Med. 4, 713–717. [DOI] [PubMed] [Google Scholar]
- Molberg O, McAdam S, Lundin KE, Sollid LM. Studies of gliadin‐specific T‐cells in celiac disease (2000). In Methods in Molecular Medicine vol. 41. Celiac disease: Methods and Protocols (ed Marsh M.N.), Totowa, NJ: Humana Press; [DOI] [PubMed] [Google Scholar]
- Schuppan D. (2000) Current concepts of celiac disease pathogenesis. Gastroenterology 119, 234–242. [DOI] [PubMed] [Google Scholar]
- Shan L., Molberg A.Y., Parrot I. et al (2002) Structural basis for gluten intolerance in celiac sprue. Science 297, 2275–2279. [DOI] [PubMed] [Google Scholar]
- Shan L., Qiao S.W., Arentz‐Hansen H. et al (2005) Identification and analysis of multivalent proteolytically resistant peptides from gluten, implications for coeliac sprue. J. Proteome Res. 4, 1732–1741. [DOI] [PMC free article] [PubMed] [Google Scholar]
- Sollid L.M., Qiao S., Anderson R.P., Gianfrani C. & Koning F. (2012) Nomenclature and listing of celiac disease relevant gluten T‐cell epitopes restricted by HLA‐DQ molecules. Immunogenetics 64, 455–460. [DOI] [PMC free article] [PubMed] [Google Scholar]
- Stenberg P., Roth E.B. & Sjöberg K. (2008) Transglutaminase and the pathogenesis of coeliac disease. Eur. J. Intern. Med. 19, 83–91. [DOI] [PubMed] [Google Scholar]
- Tye‐Din J.A., Stewart J.A., Dromey J.A. et al (2010) Comprehensive, quantitative mapping of T‐cell epitopes in gluten in coeliac disease. Sci. Transl. Med. 2, 1–14. [DOI] [PubMed] [Google Scholar]
- van de Wal Y., Kooy Y., van Veelen P., Pena A.S., Mearin L.M. & Papadopoulos G.K. (1998) Selective deamidation by tissue transglutaminase strongly enhances gliadin‐specific T cell reactivity. J. Immunol. 161, 1585–1588. [PubMed] [Google Scholar]
- Wieser H., Seilmeier W. & Belitz H.D. (1994) Quantitative determination of gliadin subgroups from different wheat cultivars. J. Cereal Sci. 19, 149–155. [Google Scholar]