Abstract
Diacylphosphatidylinositol (PI) is the starting reactant in the process of phosphatidylinositide-related signal transduction mediated through the lipid raft domain. We investigated intermolecular interactions of PI with major raft components, sphingomyelin (SM) and cholesterol (Chol), using surface pressure–molecular area (π–A) isotherm measurements. The classical mean molecular area versus composition plot showed that the measured mean molecular areas are smaller in PI/Chol mixed monolayers and larger in PI/SM mixed monolayers than those calculated on the basis of the ideal additivity. These results indicate that PI interacts attractively with Chol and repulsively with SM. In addition, we energetically evaluated the interaction of PI with SM/Chol mixtures and found that the mixing energy of PI/SM/Chol ternary monolayers decreased as the molar ratio of Chol to SM increased. In order to quantitatively analyze the distribution of PI we calculated the chemical potentials of mixing of PI into the SM/Chol mixed monolayer and into the dioleoylphosphatidylcholine (DOPC) monolayer, which was used as a model for the fluid matrix, on the basis of partial molecular area analysis. Analysis using the chemical potential of mixing of PI suggested that partition of PI molecules between these two monolayers can be changed by a factor of about 1.7 in response to change in Chol molar fraction in the SM/Chol mixed monolayer from 0.3 to 0.6 when the concentration of PI in the DOPC monolayer is kept constant at 7 mol%.
Keywords: chemical potential of mixing, Gibbs mixing energy, model monolayer, molecular distribution, π–A isotherm
We investigated the interaction between diacylphosphatidylinositol (PI) and the main lipid components of the raft, a functional microdomain in biomembranes, by analyzing surface pressure–molecular area (π–A) isotherms in order to find a clue to the incorporation mechanism of PI molecules into the raft domain.
An acidic phospholipid, PI, and its derivatives have been shown to mediate a variety of physiological functions in cells by affecting the activity and/or localization of membrane-associated proteins1,2. Upon intracellular stimulation PI is phosphorylated to phosphatidylinositol 4-phosphate (PIP) and phosphatidylinositol 4,5-bisphosphate (PIP2). The breakdown products of PIP2, diacylglycerol (DG) and phosphatidylinositol-1,4,5-triphosphate (IP3), act as second messengers and are linked to the signal transduction3,4. Thus, PI is the starting reactant in the process of phosphatidylinositide-related signal transduction.
Recently the lipid raft has attracted researchers’ interest as a relay station for signal transduction5. The raft domains have been characterized as detergent-resistant membranes (DRMs), which consist of specific lipids and proteins, e.g., sphingomyelin (SM), glycosphingolipids (GSL), cholesterol (Chol) and glycophosphatidylinositol (GPI)-anchored proteins. The relatively rigid raft domains are distinguished from the surrounding fluid matrix because they consist of lipids which are packed tightly as in the gel phase, keeping their lateral mobility as high as in the fluid matrix.
Model membrane systems have provided fundamental information on the structural and thermodynamical properties of the raft. Addition of Chol molecules to SM bilayers in the fluid phase gives rise to an ordered phase, called the liquid-ordered (Lo) phase6–8, whose physical properties are similar to those of the raft as reviewed previously9. Inter-action between SM and Chol molecules in the Lo phase may be mediated through several factors such as the network of weak hydrogen bonds10 and steric matching that the large polar headgroups of SM overlie the small Chol molecule to prevent the exposure of the nonpolar part of Chol to water11. The steric matching between lipid molecules is referred to as the umbrella model12. These intermolecular interactions between SM and Chol may work also in the biological raft to make it more rigid than the surrounding fluid matrix.
Recent in vivo studies have revealed the raft-dependent accumulation of phosphatidylinositides in defined membrane region13–17. It is well established that glycophosphatidylinositol (GPI)-anchored proteins, which link to the bilayer membrane via PI moiety, are enriched in the raft5. One of the pivotal phosphatidylinositides for the signal transduction is PIP2 and as much as half of it is present in the cellular caveola, which is a related domain to the raft18, containing enriched SM, Chol and signal proteins19. On the other hand, only about 10% of the cellular PI is contained in the raft/caveola20. However, Pike and Casey speculated that PI is highly enriched in the raft/caveola domains, considering that these domains represent less than 1% of the plasma membrane in most cells and PI is much more abundant in cells than its breakdown products20.
In vivo experiments revealed that the Chol is a crucial component for the accumulation of PIP2 and GPI-anchored proteins into the raft compartment. Pike and Miller21 reported that Chol-depletion delocalizes PIP2 and inhibits hormone-stimulated phosphatidylinositol turnover in the A431 cell of Madin-Darby canine kidney. Mayor et al.22 observed the Chol-dependent retention of GPI-anchored proteins in endosomes and suggested the involvement of the rafts in their endocytic sorting. As for the mechanism of PI accumulation into the raft, there are no investigations on the intermolecular interaction of PI with raft components as far as we know.
In this study, we examined the intermolecular interaction between PI and the major raft components, SM and Chol, using monolayer systems. The π–A isotherm analysis is one of the most powerful tools to evaluate the molecular interaction and has been extensively applied to raft components23–29. The deviation from additivity rules in the average molecular area showed that PI interacts attractively with Chol and, in contrast, repulsively with SM at the physiologically relevant pressure. In addition, we energetically evaluated the intermolecular interaction of PI with SM/Chol mixtures and found that the mixing energy of PI into the SM/Chol depends on the composition of SM/Chol mixture. Assuming for simplicity of calculation that PI molecules distribute between the SM/Chol and DOPC domains coexisting separately, we evaluated the relative concentration of PI in these two domains by calculating the chemical potential of mixing of PI. We discussed the distribution of PI in raft-containing biomembranes on the basis of our analysis in the monolayer systems.
Materials and methods
Materials
Egg-sphingomyelin (SM), cholesterol (Chol), 1,2-dio-leoyl-sn-glycero-3-phosphatidylcholine (DOPC) and phosphatidylinositol (PI) extracted from bovine liver were purchased from Avaiti Polar Lipid Inc. (Alabaster, AL) and used without further purification. The acyl chains of SM consisted of 84% palmitate (16:0), 6% stearate (18:0), 2% arachidate (20:0), 4% behenate (22:0) and 4% lignocerate (24:0). The acyl chains of PI consisted of 2.7% palmitate (16:0), 48.4% stearate (18:0), 14.5% oleate (18:1), 8.8% linoleate (18:2), 9.2% linoarachidoate (20:3), 13.4% arachidonate (20:4) and 3.0% fatty acids with longer hydrocarbon chains. The lipids were dissolved in chloroform/methanol (4:1) at a concentration of 1 mg/mL and stored at about 0°C until use.
Surface pressure measurements
Monolayers of lipid mixtures were prepared on a computer-controlled Langmuir-type film balance (USI System, Fukuoka, Japan) calibrated by stearic acid. The subphase was bidistilled and freshly deionized water from Milli-Q system (Millipore Corp.). The apparatus was covered with a plastic shield, which prohibited dust from depositing on the water surface. Thirty micro-liters of lipid solution (1 mg/mL) were spread onto the aqueous subphase (100×290 mm2) with a glass micropipette (Drummond Scientific Company, Pennsylvania, USA). The monolayers were compressed at a rate of 20 mm2/sec after the initial delay period of 10 min for evaporation of organic solvents. The subphase temperature was controlled to be 25.0±0.1°C. We repeated the measurements three to five times under the same conditions to obtain reliable results. These measurements gave the molecular areas at the corresponding pressure within the error of 0.02 nm2.We checked the influence of oxidation of unsaturated chains in PI at the air-water interface by intentionally exposing the PI monolayers to the air for 10–30 min before compression30. The change in the isotherm by the prolonged exposure of PI molecules to the air was within the error described above.
Analysis
We evaluated the intermolecular interaction in lipid binary mixtures at the surface pressure of 30 mN/m on the basis of the deviations of experimentally obtained mean molecular areas (Ames) from those of ideal mixtures (A12);
| (1) |
where A1 and A2 are the molecular areas of pure component 1 and 2, and X1 and X2 are molar fractions of component 1 and 2, respectively. The value of A12 corresponds to the mean molecular area in the mixture constituted of non-interactive or completely immiscible molecules. The negative deviation of Ames from A12 (ΔA=Ames − A12<0) indicates attractive lateral intermolecular interactions between two molecules.
We calculated the excess Gibbs energy of mixing, ΔGex, to definitively evaluate the miscibility of the lipids.
| (2) |
where R is the gas constant and T is absolute temperature. The mixing energy of ideal particles (ΔGid) is subtracted from the Gibbs energy of mixing (ΔGmix) because ΔGid is independent of molecular species. According to Goodlich31 ΔGex was calculated as an integral of the deviation, ΔA, over the surface pressure π;
| (3) |
Areal compressibility (Cs) at the surface pressure of 30 mN/m was calculated from the π–A isotherm using
| (4) |
The compressibility in ideal mixtures (C12) is calculated according to Ali et al.32;
| (5) |
where Cs1 and Cs2 are the compressibilities of the pure component 1 and 2, respectively. Ali et al.32 suggested that C12 is additive with respect to the product of Csi and Ai, rather than Csi for either ideal or completely non-ideal mixing. Areal compressibility (Cs) was expressed in term of areal compressional modulus ( ) for easy comparison with previous data.
Results
Intermolecular interaction of PI with SM, Chol and DOPC
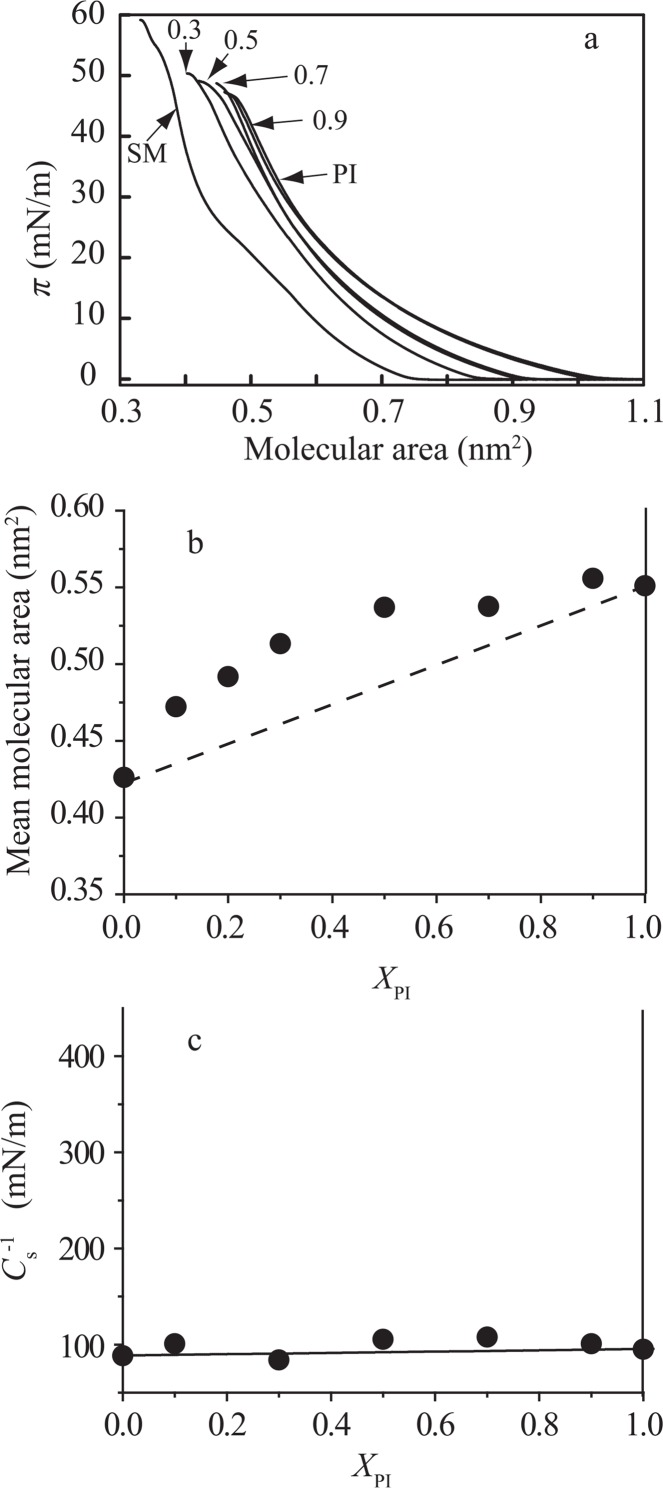
We examined intermolecular interaction of diacylphosphatidylionsitol (PI) with two major raft components, sphingomyelin (SM) and cholesterol (Chol), and with a model lipid for the fluid matrix, dioleoylphospatidylcholine (DOPC). First, the surface pressure versus molecular area (π–A) isotherms for pure PI, pure SM and PI/SM monolayers at 25.0±0.1°C are shown in Figure 1a. The isotherm for the pure SM monolayer showed a low slope region (π=14–26 mN/m) corresponding to the phase transition between liquid expanded (LE) and liquid condensed (LC) phases as described previously23,24,33 though the transition is obscure due to heterogeneity of chain species in SM molecules. With increasing molar fraction of PI the isotherm shifted toward the higher molecular area, changing its shape.
Figure 1.
Intermolecular interaction in the PI/SM monolayer system. (a) π–A isotherms of pure PI, pure SM and PI/SM mixed monolayers on the water subphase at 25±0.1°C. The molar fractions of PI, XPI, are indicated in the figure; 0 (SM), 0.3, 0.5, 0.7, 0.9 and 1.0 (PI). The isotherms with XPI= 0.5 and 0.9 were nearly superposed upon those of XPI= 0.7 and 1.0, respectively. (b) Mean molecular area versus composition analysis at 30 mN/m. The dotted line represents area additivity for ideal mixing of two components (Eq. (1)). (c) Areal compressional modulus ( ) versus composition analysis. The values at 30 mN/m were calculated from equation (4). The solid line represents ideal additivity of compressibility (see Materials and methods and Eq. (5)).
To analyze interaction between PI and SM molecules we plotted the mean molecular areas as a function of the molar fraction of PI, XPI (Fig. 1b). Here, we focused on the surface pressure of 30 mN/m because monolayers at this pressure have been used as a model for biomembranes34–38. The deviations of Ames from area additivity expressed by equation (1) were positive in all composition range, indicating that repulsive interaction works between PI and SM molecules.
In addition to molecular area analysis, we estimated the values at 30 mN/m in PI/SM mixed monolayers according to equation (4). They gave good agreement with the theoretical values (solid line in Fig. 1c) calculated on the basis of additivity of compressibility given by equation (5), indicating that the lateral elasticity behaves ideally in PI/SM mixed monolayers.
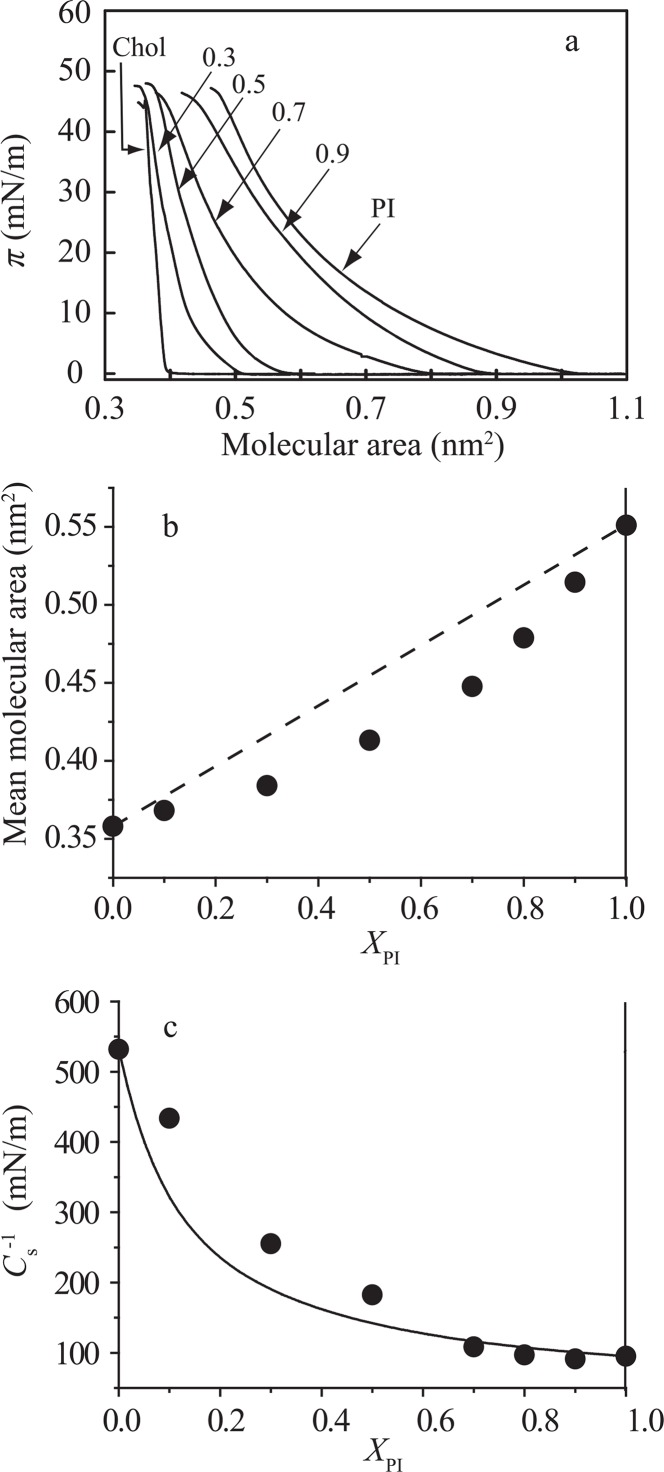
Secondly, we examined intermolecular interaction between PI and Chol, which is another essential component constituting the raft. The π–A isotherms for pure PI, pure Chol and PI/Chol mixed monolayers at 25±0.1°C are shown in Figure 2a. The pure Chol isotherm (leftmost in Fig. 2a) exhibited steep rise in the surface pressure at the molecular area of about 0.4 nm2/molecule, indicating that the gas phase is directly transformed into the LC phase28. In PI/Chol mixtures, the deviations from area additivity are always negative irrespective of XPI (Fig. 2b). Thus, in distinct contrast to SM, Chol induced the intermolecular condensation with PI. These results are consistent with the previous in vivo experiments that Chol depletion caused PI-dispersion from the Chol-rich domains (raft/caveola)21,22.
Figure 2.
Intermolecular interaction in the PI/Chol monolayer system. (a) π–A isotherms of pure PI, pure Chol and PI/Chol mixed monolayers on the water subphase at 25±0.1°C. The molar fractions of PI, XPI, are indicated in the figure; 0 (Chol), 0.3, 0.5, 0.7, 0.9 and 1.0 (PI). (b) Mean molecular area versus composition analysis at 30 mN/m. The dotted line represents area additivity (Eq. (1)). (c) Areal compressional modulus ( ) versus composition analysis. The values at 30 mN/m were calculated from equation (4). The solid line represents ideal additivity of compressibility (see Materials and methods and Eq. (5)).
In PI/Chol monlayers the compressional modulus gradually decreased with increasing XPI up to ∼0.7, showing positive deviation from the theoretical line (solid line in Fig. 2c) calculated from additivity of compressibility (Eq. (5)). There seemed to be discontinuity in at XPI∼0.7, above which data points fell on the theoretical line. This biphasic response of to XPI may imply that a phase boundary between the liquid disordered (Ld) and liquid ordered (Lo) phases lies at XPI∼0.7 as interpreted by Zhai et al.38 for a lactosylceramide/Chol system.
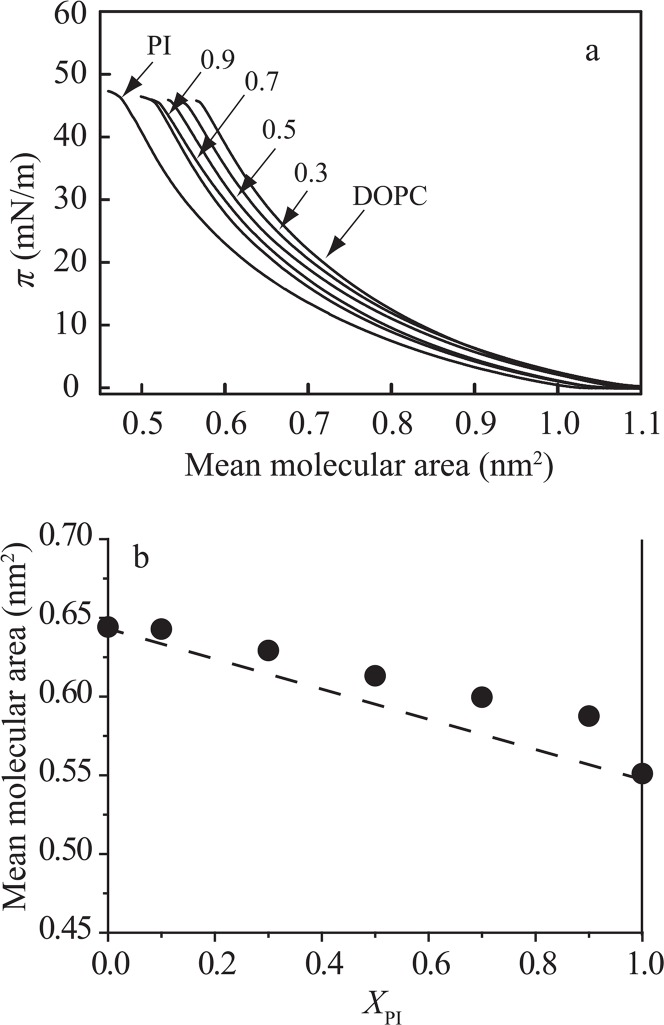
Since the majority of lipids surrounding the rafts in bio-membranes are generally in the fluid state, comparative study between PI/raft component and PI/fluid lipid mixtures should be required. We used PI/DOPC monolayers because DOPC is one of the representative unsaturated phospholipids with the same headgroup as SM and the DOPC monolayer has been extensively used as a model for the fluid membrane11,39,40. The π–A isotherms for pure PI, pure DOPC and PI/DOPC mixed monolayers at 25±0.1°C are shown in Figure 3a. We evaluated the interaction between PI and DOPC molecules at 30 mN/m as described above. As a result, the deviation of Ames from area additivity was positive, indicating that the repulsive interaction was induced between PI and DOPC molecules (Fig. 3b). However, the deviations of Ames from area additivity in PI/DOPC monolayers were smaller than those in PI/SM monolayers. These results suggested that PI molecules have affinity in the order of Chol > DOPC > SM.
Figure 3.
Intermolecular interaction in the PI/DOPC monolayer system. (a) π–A isotherms of pure PI, pure DOPC and PI/DOPC mixed monolayers on the water subphase at 25±0.1°C. The molar fractions of PI, XPI, are indicated in the figure; 0 (DOPC), 0.3, 0.5, 0.7, 0.9 and 1.0 (PI). (b) Mean molecular area versus composition analysis at 30 mN/m. The dotted line represents area additivity (Eq. (1)). The molecular area of DOPC (0.64 nm2) is larger than that of PI (0.55 nm2) at 30 mN/m.
Excess Gibbs energy of mixing of PI with SM/Chol mixtures (SCm)
We investigated the PI/SM/Chol ternary system, focusing on the interaction of PI with SM/Chol mixtures. In monolayer studies, it has been reported that attractive interaction works between the SM and Chol molecules in any composition range23,24 and gives rise to a rigidified membrane in the Lo phase. Here, let us call the SM/Chol mixture ‘SCm’ for convenience. In order to systematically analyze the ternary monolayer, we examined interactions between PI molecules and SCm with a fixed molar ratio of Chol to SM+Chol, rChol, as suggest by Birdi41. The Chol molar ratio in the SCm, rChol, is defined as
| (6) |
where XSM and XChol are the molar fractions of SM and Chol in the PI/SM/Chol ternary monolayers, respectively. Thus, we can estimate the interaction of PI molecules with a SCm having an appropriate rChol value, as in the binary mixtures.
We used the excess Gibbs energy of mixing, ΔGexSCm to evaluate the intermolecular interaction energetically. Equation (3) for a binary mixture can be applied to the ternary mixture with keeping the rChol constant. Substituting A1, A2, X1 and X2 by the corresponding parameters in the PI/SCm system, API, XPI, ASCm and XSCm (=XSM+ XChol = 1 − XPI), respectively, we have
| (7) |
where Ames is the experimentally obtained mean molecular area in the ternary monolayer. The value of ASCm is the experimentally obtained mean molecular area in the SM/Chol binary mixture rather than the mean molecular area calculated from ideal additivity, i.e., ASM(1 − rChol) + ACholrChol. Hence, ΔGexSCm represents the excess Gibbs energy of mixing of PI molecules and the preexisting SCm. Since ΔGexSCm defined here does not contain the ideal Gibbs energy of mixing, the interaction between PI and the SCm may be repulsive when ΔGexSCm>0 and attractive when ΔGexSCm<0.
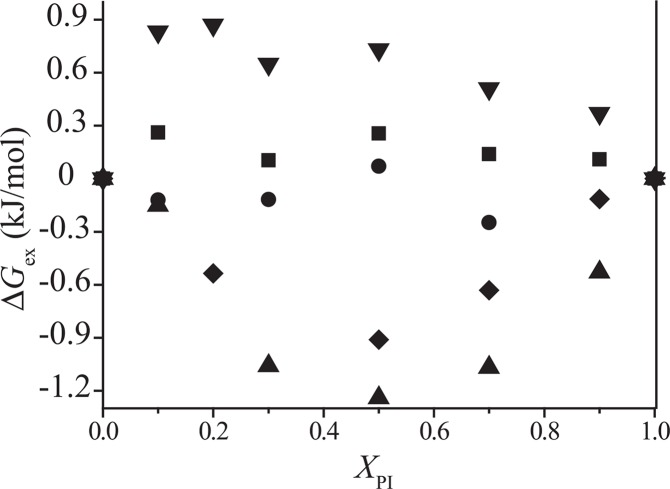
Dependence of ΔGexSCm on XPI with the rChol value fixed at 0, 0.3, 0.6, 0.9 and 1.0 is shown in Figure 4. The energetic analysis supported the results of the mean molecular area analysis in PI/SM and PI/Chol monolayers that PI interacted repulsively with SM and attractively with Chol over the whole range of XPI. The maximum of ΔGex in the SM/PI mixed monolayers (rChol =0) seemed to lie at XPI = 0.1∼0.2 rather than XPI = 0.5, where the number of the pair of PI and SM would be the largest if they mixed homogeneously. Therefore, the PI and SM molecules may segregate weakly at higher XPI. In the PI/SCm ternary mixtures, ΔGexSCm changed from positive to negative as rChol increased. The value of ΔGexSCm was nearly equal to zero at rChol∼0.6. Thus, the PI/SCm monlayers at 30 mN/m became thermodynamically more stable as rChol increased.
Figure 4.
Excess mixing energy of PI and SM/Chol mixtures (SCm), ΔGexSCm, as a function of XPI. The value of ΔGexSCm was calculated by integration of area deviation (ΔA) over the surface pressure (Eq. (7)). The molar ratios of Chol in the SCm, rChol, are 0 (filled inverted triangle), 0.3 (filled square), 0.6 (filled circle), 0.9 (filled diamond) and 1.0 (filled triangle).
Discussion
Intermolecular interaction in PI/Chol and PI/SM mixed monolayers
Phospatidylinositol is the starting reactant in the process of phosphatidylinositide-related signal transduction, which has been suggested to work through the membrane raft. Although in vivo experiments have suggested the importance of Chol in phosphatidylinositide incorporation into the raft21,22,42, there are no quantitative studies on the intermolecular interaction of PI molecule with raft components, e.g., SM and Chol, as far as we know. Here, mean molecular area versus composition analysis revealed that PI molecules interact repulsively with SM and attractively with Chol. These results are consistent with in vivo experiments that depletion of Chol suppressed the accumulation of phosphatidylinositides in the raft/caveola21,22. Furthermore, we found that PI/Chol mixed monolayers exhibit biphasic behavior in elastic properties, which depend mainly on the configuration of the hydrocarbon chains25,38,43; the values fell on the theoretical line for the corresponding ideal mixture, , (solid line in Fig. 2c) in the high XPI region, and deviated positively from in the low XPI region (XPI≤ 0.7). Thus, a phase boundary between the soft and rigid phases lies around the Chol molar ratio, XChol, of 0.3.
We speculated that addition of Chol into the PI monolayer induces the disordered-to-liquid ordered (Ld-to-Lo) phase transition as observed in lactosylceramides (LacCer)/Chol mixed monolayers38. Discontinuity in in the LacCer/Chol system is also located at the Chol molar ratio of about 0.3. The LacCer molecule with a large disaccharide headgroup has similar structural features in terms of the mismatch between cross sectional areas of the head and hydrocarbon chain moieties. However, the values in the region of high Chol molar ratio were much smaller in PI/Chol monolayers than in LacCer/Chol monolayers.
This disagreement can be explained by the presence of unsaturated acyl chains in the PI sample we used; it contained nearly equimolar saturated and unsaturated species of acyl chains (see Materials and methods). Unsaturation in the hydrocarbon chain reduces the value in the phosphatidylcholine/Chol43 and LacCer/Chol38 mixed monolayers. The value of the equimolar mixture of Chol and LacCer with saturated (18:0) hydrocarbon chains is about three times as large as that of the equimolar mixture of Chol and LacCer with unsaturated (18:1) hydrocarbon chains. Although the degree of unsaturation affects the value, it might hardly affect the Chol molar ratio which makes the phase boundary between Lo and Ld phases as suggested by Thewalt and Bloom44 that presence of more than 25 mol% Chol can induce the Lo phase in phosphatidylcholine irrespective of whether the hydrocarbon chain has mono-cis double bond or not. Thus, the discontinuity in could be observed in PI/Chol monolayers even if acyl chains of PI were highly inhomogeneous.
In contrast to the behavior of , the mean molecular areas exhibited condensation in the PI/Chol system and expansion in the PI/SM system over the whole range of XPI, irrespective of whether addition of Chol induced a phase transition. The mean molecular area in the PI/Chol system did not show discrete change at XChol ≈ 0.3 (Fig. 2b) as observed in the mixed monolayers of LacCer with homogeneous hydrocarbon chains and Chol. It is not clear whether there is discontinuity in the first derivative of the average molecular area, which indicates the existence of a phase boundary45.
Generally speaking, it is difficult to identify the factors contributing to the deviation of the mean molecular area from ideal additivity because complicated two-body and multibody interactions among the lipids are involved in determination of the molecular area. Chol-induced condensation (Fig. 2b) may be caused by a combination of the suppression of trans-gauche isomerization in the PI molecules next to Chol, the coverage over Chol by the large head-groups of neighboring PI molecules (umbrella effect) and so forth46,47. In the PI/SM monolayers one of the crucial factors for area expansion (Fig. 1b) might be that the intercalated SM molecule between PI molecules can destroy the hydrogen bond network among inositol rings of PI molecules48–52.
It is also difficult to explain unequivocally the effect of the degree of unsaturation on the behavior of the mean molecular area. However, it should be noted that introduction of double bonds into hydrocarbon chains does not necessarily lead to repulsive interaction with major lipid raft components. Against expectation, Zhai et al.38 observed positive deviation of the mean molecular area from ideal additivity in the LacCer with saturated chains/Chol monolayers and negative deviation in the LacCer with unsaturated chains/Chol monolayers. Furthermore, Fridriksson et al.53 reported that detergent-resistant membranes (DRMs/rafts) from RBL-2H3 cells activated by IgE-FceRI cross-linking exhibit a larger ratio of polyunsaturated to saturated and monounsaturated phospholipids than those from unstimulated cells.
Quantitative analysis of the distribution of PI molecules
On the basis of deviations from ideal area additivity, we calculated the excess mixing energies of PI into the SM/Chol mixtures (SCm), ΔGexSCm, to energetically evaluate the affinity of PI to the SCm. Although the results in Figure. 4 gave an insight to the Chol-dependent change in affinity of PI to SCm, they cannot be used for estimation of partition of PI molecules into different domains. As a first step toward the quantitative estimation of PI distribution, we assumed for simplicity of calculation that PI molecules are distributed between preexisting SCm and DOPC domains which are completely immiscible and laterally separated. PI molecules added to the membrane are distributed in equilibrium as their chemical potential in the two domains is the same:
| (8) |
where μPISCm and μPIDOPC are the chemical potential of PI molecules in the SCm domain and the DOPC domain, respectively. We can rewrite equation (8) using the chemical potential of mixing of PI molecules, ΔμPI, i.e., the difference in chemical potential between PI molecules in the pure state and in the mixture at 30 mN/m, as
| (9) |
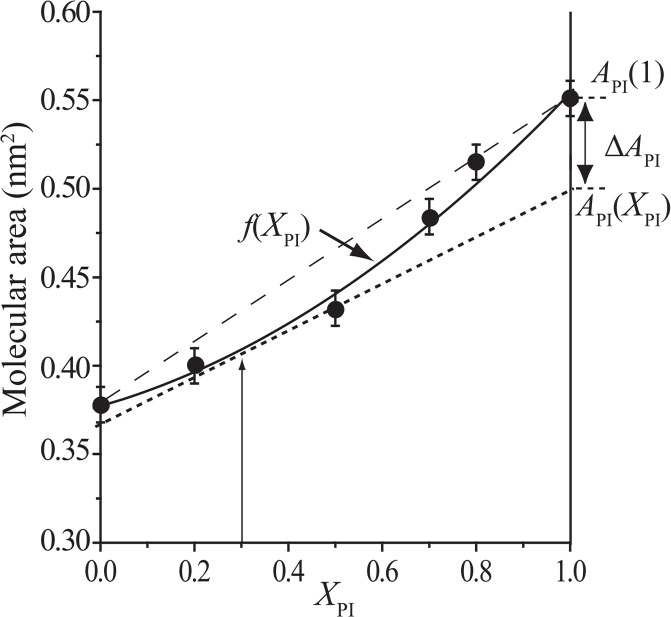
The mixing chemical potential can be calculated from the partial-specific area of PI, API, which is obtained by extending well-known concept of partial-specific volume according to Edholm and Nagle46. Figure 5 illustrates how to calculate the API in a mixed monolayer. At first the mean molecular area obtained as a function of XPI was fitted to a quadratic function f(XPI) for convenience of calculation. The value of API at a desired XPI is obtained as the XPI= 1 intercept of the tangent of f(XPI) at the XPI46,54. The chemical potential of mixing of PI, ΔμPI, is calculated as:
| (10) |
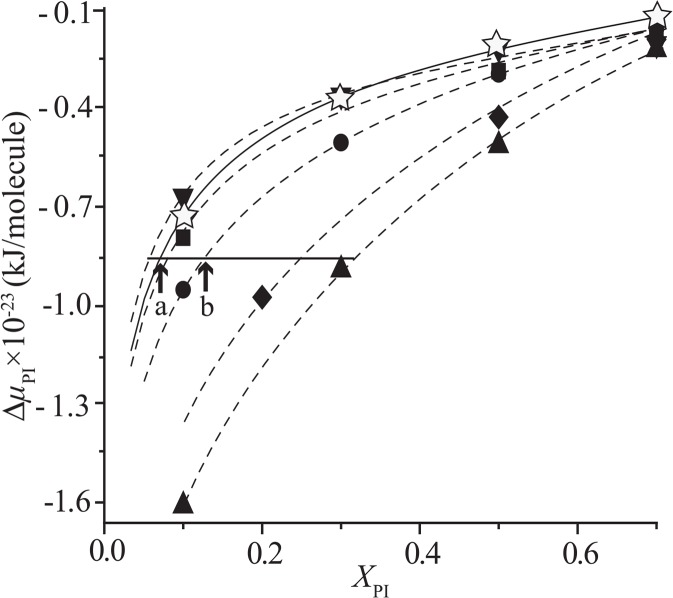
where kB is the Boltzmann constant and ΔAPI = API(XPI)–API(1). The ΔAPI is integrated over the surface pressure (π= 0–30 mN/m). It should be noted that ΔμPISCm depends on XPI and the composition of SCm (rChol). We plotted ΔμPISCm(XPI, rChol) with constant rChol as a function of XPI, together with ΔμPIDOPC(XPI) in Figure 6. All the ΔμPI increased monotonously as XPI increased. The slope is steeper in the lower XPI region due to the term of ideal mixing (first term of Eq. (10)).
Figure 5.
Analysis of partial molecular area of PI at given XPI, API(XPI). Mean molecular area versus XPI plot for the PI/SCm (rChol= 0.9) mixed monolayer at 30 mN/m is shown as an example for calculation of API(XPI). The mean molecular area data were fitted to a quadratic function, f(XPI) (solid line). The value of API(XPI) obtained as the intercept at XPI= 1.0 of the tangent to the fitted curve f(XPI); the calculation in the case of XPI= 0.3 (arrow) is shown in the figure. ΔAPI= API(XPI)–API(1), where API(1) is the molecular area of pure PI.
Figure 6.
Chemical potential of mixing of PI into the SCm with a fixed rChol-value (ΔμPISCm) and into the DOPC monolayer (ΔμPIDOPC) as a function of XPI. As shown in equation (10), ΔμPI consists of the ideal term and the integration of ΔAPI over the surface pressure (π=0–30 mN/m). The molar ratios of Chol in the SCm, rChol, are 0 (filled inverted triangle), 0.3 (filled square), 0.6 (filled circle), 0.9 (filled diamond) and 1.0 (filled triangle). The open stars correspond to ΔμPIDOPC. Note that ΔμPISCm (rChol= 0.6) at XPI= 0.12 (arrow b) equals to ΔμPIDOPC at XPI= 0.07 (arrow a). See text for details.
Distribution of PI molecules between the SCm and DOPC domains can be estimated by equation (9):
| (11) |
where XPISCm and XPIDOPC are the molar fraction of PI in the assumed SCm and DOPC domains, respectively. Graphically speaking, the intersections (a and b in Fig. 6) of a horizontal line and ΔμPI(XPI) give the molar fraction of PI in the coexisting domains.
Finally, we would like to compare our calculation with the data from biological systems. Though the estimation of the partition of PI on the basis of Figure 6 must be tentative and rough because of the difference between simple artificial monolayer and multicomponent biomembrane with bilayer configuration, it can be the first step for further quantitative studies. Fridriksson et al.53 reported that the PI occupies 7.4% of all phospholipids in plasma membranes (PMs). This PI composition in PMs may be nearly equal to that in the fluid matrix because the raft/caveolae represents less than 1% of PM lipids in most cells20. Therefore, we adopt 0.07 for the value of XPIDOPC (arrow (a) in Fig. 6). This leads to the value of ∼0.12 for XPISCm (arrow (b) in Fig. 6) in the SCm with rChol= 0.6, which is close to the upper limit of Chol solubility in lipid bilayers55. The value of 0.12 roughly agrees with the PI concentration (14–16%) in the raft membranes extracted as detergent-resistant membranes (DRMs/rafts) from RBL-2H3 mast cells53. Incidentally, ΔμPIDOPC at XPIDOPC=0.07 is nearly equal to ΔμPISCm (rChol=0.3) at the same concentration of XPISCm, that is, there appears no PI concentration gradient between the fluid DOPC domain and the SCm with rChol ∼0.3. These results are consistent with the fact that Chol cannot induce the raft or Lo phase completely if rChol<0.355.
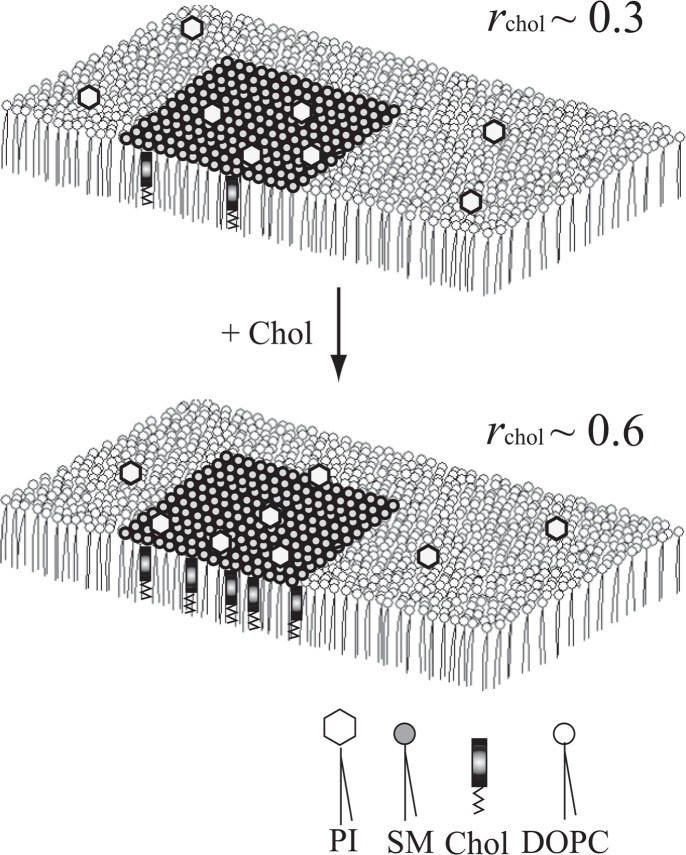
Our results suggested that PI concentration in the SCm (model raft) can be controlled by a factor of about 1.7 (0.12/0.07) as rChol is changed between 0.3 and 0.6 (Fig. 7). Furthermore, the behavior of ΔμPI in the range of small XPI suggested that the condensation rate is much larger than 1.7 if the molar fraction of PI in the fluid DOPC matrix is much smaller than 0.07. If the results obtained for PI molecules are applicable to phospatidylinositides such as PIP2, whose concentration in the membrane is quite low, they might be concentrated in the SCm domain at a high rate. Thus, these static analyses showed fairly good agreement with the characteristics of PI distribution in biomembranes notwithstanding the difference between artificial monolayers and biomembranes; in addition to the structural difference as mentioned above the processes in biological membranes are dynamical. Although the results obtained in an artificial system should not be applied straightforwardly to the biological system and further studies with bilayer systems are needed, analysis based on the partial-specific area will be a useful tool for quantitative understanding of incorporation of various molecules into the raft domain.
Figure 7.
Chol-induced redistribution of PI molecules between the SCm and the fluid matrix, speculated from the results obtained in the model monolayer systems. When rChol∼0.3, PI may be equally distributed between the fluid matrix and the SCm (upper). The PI molecules will be gradually transferred from the fluid matrix to the SCm as rChol increases (lower).
Acknowledgments
This work was partly supported by the open research center program for private university.
References
- 1.Payrastre B, Missy K, Giuriato S, Bodin S, Plantavid M, Gratacap M. Phosphoinositides: key players in cell signaling, in time and space. Cell Signal. 2001;13:377–387. doi: 10.1016/s0898-6568(01)00158-9. [DOI] [PubMed] [Google Scholar]
- 2.Simonsen AE, Wurmser AE, Emr SD, Stenmark H. The role of phosphoinositides in membrane transport. Curr. Opin. Cell Biol. 2001;13:485–492. doi: 10.1016/s0955-0674(00)00240-4. [DOI] [PubMed] [Google Scholar]
- 3.Clarke JH, Letcher AJ, D’santos CS, Halstead JR, Irvine RF, Divecha N. Inositol lipids are regulated during cell cycle progression in the nuclei of murine erythroleukaemia cells. Biochem. J. 2001;357:905–910. doi: 10.1042/0264-6021:3570905. [DOI] [PMC free article] [PubMed] [Google Scholar]
- 4.Pochynyuk O, Tong Q, Staruschenko A, Ma HP, Stockland JD. Regulation of the epithelial Na+ channel (ENaC) by phosphatidylinositides. Am. J. Physiol. Renal. Physiol. 2006;290:949–957. doi: 10.1152/ajprenal.00386.2005. [DOI] [PubMed] [Google Scholar]
- 5.Simons K, Ikonen E. Functional raft in cell membranes. Nature. 1997;387:569–572. doi: 10.1038/42408. [DOI] [PubMed] [Google Scholar]
- 6.Harder T, Simons K. Caveolae, DIGs, and the dynamics of sphingolipid-cholesterol microdomains. Curr. Opin. Cell Biol. 1997;9:534–542. doi: 10.1016/s0955-0674(97)80030-0. [DOI] [PubMed] [Google Scholar]
- 7.Munro S. Lipid rafts: elusive or illusive? Cell. 2003;115:377–388. doi: 10.1016/s0092-8674(03)00882-1. [DOI] [PubMed] [Google Scholar]
- 8.McMullen TP, Lewis RN, McElhaney RN. Cholesterol-phospholipid interactions, the liquid-ordered phase and lipid rafts in model and biological membranes. Curr. Opin. Colloid Interface Sci. 2004;8:459–468. [Google Scholar]
- 9.Silvius JR. Role of cholesterol in lipid raft formation: lessons from lipid model system. Biochim. Biophys. Acta. 2003;1610:174–183. doi: 10.1016/s0005-2736(03)00016-6. [DOI] [PubMed] [Google Scholar]
- 10.Ramstedt B, Slotte JP. Membrane properties of sphingomyelins. FEBS Lett. 2002;531:33–37. doi: 10.1016/s0014-5793(02)03406-3. [DOI] [PubMed] [Google Scholar]
- 11.Kirat KE, Morandat S. Cholesterol modulation of membrane resistance to Triton X-100 explored by atomic force microscopy. Biochim. Biophys. Acta. 2007;1768:2300–2309. doi: 10.1016/j.bbamem.2007.05.006. [DOI] [PubMed] [Google Scholar]
- 12.Huang J, Feigenson GW. A microscopic interaction model of maximum solubility of cholesterol in lipid bilayers. Biophys. J. 1999;76:2142–2157. doi: 10.1016/S0006-3495(99)77369-8. [DOI] [PMC free article] [PubMed] [Google Scholar]
- 13.Rozelle A, Machesky L, Yamamoto M, Driessense M, Insall R, Roth M, Luby-Phelps K, Marriott G, Hall A, Yin H. Phosphatidylinositol 4,5-bisphosphate induces actin-based movement of raft-enriched vesicles through WASP-Arp2/3. Curr. Biol. 2000;10:311–320. doi: 10.1016/s0960-9822(00)00384-5. [DOI] [PubMed] [Google Scholar]
- 14.Bodin S, Giuriato S, Ragab J, Humbel BM, Viala C, Vieu C, Chap H, Payrastre B. Production of phosphatidylinositol 3,4,5-triphosphate and phosphatidic acid in platelet rafts: evidence for a critical role of cholesterol-enriched domains in human platelet activation. Biochemistry. 2001;40:15290–15299. doi: 10.1021/bi0109313. [DOI] [PubMed] [Google Scholar]
- 15.Caroni P. Actin cytoskeleton regulation through modulation of PI(4,5)P-2 raft. EMBO J. 2001;20:4332–4336. doi: 10.1093/emboj/20.16.4332. [DOI] [PMC free article] [PubMed] [Google Scholar]
- 16.Hill MM, Feng J, Hemmings BA. Identification of a plasma membrane raft-associated PKB Ser473 kinase activity that is distinct from ILK and PDK1. Curr. Biol. 2002;14:1251–1255. doi: 10.1016/s0960-9822(02)00973-9. [DOI] [PubMed] [Google Scholar]
- 17.Zhuang LY, Lin JQ, Lu ML, Solomon KR, Freeman MR. Cholesterol-rich lipid raft mediate AKT-regulated survival in prostate cancer cells. Cancer Res. 2002;62:2227–2231. [PubMed] [Google Scholar]
- 18.Pike LJ. Lipid rafts: bringing order to chaos. J. Lipid Res. 2003;44:655–667. doi: 10.1194/jlr.R200021-JLR200. [DOI] [PubMed] [Google Scholar]
- 19.Everson VW, Smart EJ. Caveolin and its role in the intracellular chaperone complexes. In: Fielding EC, editor. Lipid rafts and caveolae. WILEY-VCH Verlag GmbH & Co. KGaA. Pub.; Weinheim: 2006. p. 175. [Google Scholar]
- 20.Pike LJ, Casey L. Localization and turnover of phosphatidylinositol 4,5-bisphosphate in caveolin-enriched membrane domains. J. Biol. Chem. 1996;271:26453–26456. doi: 10.1074/jbc.271.43.26453. [DOI] [PubMed] [Google Scholar]
- 21.Pike LJ, Miller JM. Cholesterol depletion delocalizes phosphatidylinositol bisphosphate and inhibits hormone-stimulated phosphatidylinositol turnover. J. Biol. Chem. 1998;273:22298–22304. doi: 10.1074/jbc.273.35.22298. [DOI] [PubMed] [Google Scholar]
- 22.Mayor S, Sabharanjak S, Maxfield FR. Cholesterol-dependent retention of GPI-anchored protein in endosomes. EMBO J. 1998;17:4626–4638. doi: 10.1093/emboj/17.16.4626. [DOI] [PMC free article] [PubMed] [Google Scholar]
- 23.Lund-Katz S, Laboda HN, McLean LR, Phillips MC. Influence of molecular packing and phospholipids type on rate of cholesterol exchange. Biochemistry. 1998;27:3416–3423. doi: 10.1021/bi00409a044. [DOI] [PubMed] [Google Scholar]
- 24.Smaby JM, Brockmann HL, Brown RE. Cholesterol’s interfacial interactions with sphingomyelins and phosphatidylcholines: hydrocarbon chain structure determines the magnitude of condensation. Biochemistry. 1994;33:9135–9142. doi: 10.1021/bi00197a016. [DOI] [PMC free article] [PubMed] [Google Scholar]
- 25.Lie XM, Smaby JM, Momsen MM, Brockmann HL, Brown RE. Sphingomyelin interfacial behavior: the impact of changing acyl chain composition. Biophys. J. 2000;78:1921–1931. doi: 10.1016/S0006-3495(00)76740-3. [DOI] [PMC free article] [PubMed] [Google Scholar]
- 26.Lie XM, Momsen MM, Smaby JM, Brockmann HL, Brown RE. Cholesterol decreases the interfacial elasticity and detergent solubility of sphingomyelins. Biochemistry. 2001;40:5954–5963. doi: 10.1021/bi002791n. [DOI] [PMC free article] [PubMed] [Google Scholar]
- 27.Diociaiuti M, Ruspantini I, Giorfani C, Bordi F, Chistolini P. Distribution of GD3 in DPPC monolayers: a thermodynamic and atomic force microscopy combined study. Biophys. J. 2004;86:321–328. doi: 10.1016/S0006-3495(04)74107-7. [DOI] [PMC free article] [PubMed] [Google Scholar]
- 28.Berring EE, Borrenpohl K, Serfis AB. A comparison of the behavior of cholesterol and selected derivatives in mixed sterol-phospholipid Langmuir monolayers: a fluorescence microscopy study. Chem. Phys. Lipids. 2005;136:1–12. doi: 10.1016/j.chemphyslip.2005.03.004. [DOI] [PubMed] [Google Scholar]
- 29.Grauby-Heywang C, Turlet JM. Behavior of GM3 ganglioside in lipid monolayers mimicking rafts or fluid phase membranes. Chem. Phys. Lipids. 2006;139:68–76. doi: 10.1016/j.chemphyslip.2005.10.003. [DOI] [PubMed] [Google Scholar]
- 30.Stottrup BL, Veach SL, Keller SL. Nonequilibrium behavior in supported lipid membranes containing cholesterol. Biophys. J. 2004;86:2942–2954. doi: 10.1016/S0006-3495(04)74345-3. [DOI] [PMC free article] [PubMed] [Google Scholar]
- 31.Goodrich FC. Molecular interaction in mixed monolayer. In: Schulman JH, editor. Second International Congress on Surface Activity. I. Butterworth & Co.; London: 1957. p. 85. [Google Scholar]
- 32.Ali S, Smaby JM, Brockman HL, Brown RE. Cholesterol’s interfacial interactions with galactosylceramides. Biochemistry. 1994;33:2900–2906. doi: 10.1021/bi00176a020. [DOI] [PMC free article] [PubMed] [Google Scholar]
- 33.Shaiker SR, Dumaual AC, Jenski LJ, Stillwell W. Lipid phase separation in phospholipid bilayers and monolayers modeling the plasma membrane. Biochim. Biophys. Acta. 2001;1512:317–328. doi: 10.1016/s0005-2736(01)00335-2. [DOI] [PubMed] [Google Scholar]
- 34.Demel RA, Geurts van Kessel WSM, Zwaal RFA, Roelofsen B, Van Deenen LLM. Relation between various phospholipase actions on human red cell membranes and the interfacial phospholipid pressure in monolayer. Biochim. Biophys. Acta. 1975;406:97–107. doi: 10.1016/0005-2736(75)90045-0. [DOI] [PubMed] [Google Scholar]
- 35.Nagle JF. Theory of monolayer and bilayer phase transition: effect of headgroup interaction. J. Membr. Biol. 1976;148:997–1007. doi: 10.1007/BF01869138. [DOI] [PubMed] [Google Scholar]
- 36.Blume A. A comparative study of the phase transitions of phospholipid bilayers and monolayers. Biochim. Biophys. Acta. 1979;577:32–44. doi: 10.1016/0005-2736(79)90087-7. [DOI] [PubMed] [Google Scholar]
- 37.Feng SS. Interpretation of mechanochemical properties of lipid bilayer vesicles from the equation of state or pressure-area measurement of the monolayer at the air-water or oil-water interface. Langmuir. 1999;15:998–1010. doi: 10.1021/la051216n. [DOI] [PubMed] [Google Scholar]
- 38.Zhai X, Li XM, Momsen MM, Brockmann HL, Brown RE. Lactosylceramide: lateral interactions with cholesterol. Biophys. J. 2006;91:2490–2500. doi: 10.1529/biophysj.106.084921. [DOI] [PMC free article] [PubMed] [Google Scholar]
- 39.Yuan C, Furlong J, Burgos P, Johnston LJ. The Size of Lipid rafts: an atomic force microscopy study of ganglioside GM1 domains in sphingomyelin/DOPC/cholesterol membranes. Biophys. J. 2002;82:2526–2535. doi: 10.1016/S0006-3495(02)75596-3. [DOI] [PMC free article] [PubMed] [Google Scholar]
- 40.Stottrup BL, Stevens DS, Keller SL. Miscibility of ternary mixtures of phospholipids and cholesterol monolayers, and application to blayer systems. Biophys. J. 2005;88:269–276. doi: 10.1529/biophysj.104.048439. [DOI] [PMC free article] [PubMed] [Google Scholar]
- 41.Birdi KS. Self-assembly monolayer structures of lipids and macromolecules at interfaces. Kluwer Academic/Plenum Publishers; New York: 1999. pp. 125–138. [Google Scholar]
- 42.Ilangumaran S, Hoessli DC. Effects of cholesterol depletion by cyclodextrin on the sphingolipid microdomains of the plasma membrane. Biochem. J. 1998;335:433–440. doi: 10.1042/bj3350433. [DOI] [PMC free article] [PubMed] [Google Scholar]
- 43.Smaby JM, Momsen MM, Brockmann HL, Brown RE. Phosphatidylcholine acyl unsaturation modulates the decrease in interfacial elasticity induced by cholesterol. Biophys. J. 1997;73:1492–1505. doi: 10.1016/S0006-3495(97)78181-5. [DOI] [PMC free article] [PubMed] [Google Scholar]
- 44.Thewalt LJ, Bloom M. Phosphatidylcholine: cholesterol phase diagram. Biophys. J. 1992;63:1176–1181. doi: 10.1016/S0006-3495(92)81681-8. [DOI] [PMC free article] [PubMed] [Google Scholar]
- 45.Greenwood AI, Tristram-Nagle S, Nagle JF. Partial molecular volumes of lipids and cholesterol. Chem. Phys. Lipids. 2006;145:1–10. doi: 10.1016/j.chemphyslip.2006.04.002. [DOI] [PMC free article] [PubMed] [Google Scholar]
- 46.Edholm O, Nagle JF. Area of molecules in membranes consisting of mixtures. Biophys. J. 2005;89:1827–1832. doi: 10.1529/biophysj.105.064329. [DOI] [PMC free article] [PubMed] [Google Scholar]
- 47.Ali MR, Cheng WH, Huang J. Assess the nature of cholesterol-lipid interactions through the chemical potential of cholesterol in phosphatidylcholine bilayers. Proc. Natl. Acad. Sci. U.S.A. 2007;104:5372–5377. doi: 10.1073/pnas.0611450104. [DOI] [PMC free article] [PubMed] [Google Scholar]
- 48.McDaniel PV, McIntosh TJ. Neutron and x-ray diffraction structural analysis of phosphatidylinositol bilayers. Biochim. Biophys. Acta. 1989;983:241–246. doi: 10.1016/0005-2736(89)90239-3. [DOI] [PubMed] [Google Scholar]
- 49.Bushby RJ, Byard SJ, Hansbro PM, Reid DG. The conformational behavior of phosphatidylinositol. Biochim. Biophys. Acta. 1990;1044:231–236. doi: 10.1016/0005-2760(90)90307-j. [DOI] [PubMed] [Google Scholar]
- 50.Hansbro PM, Byard SJ, Bushby RJ, Turnbull PJ, Boden N, Saunders MR, Novelli R, Reid DG. The conformational behavior of phosphatidylinositol in model membranes: 2H-NMR studies. Biochim. Biophys. Acta. 1992;1112:187–196. doi: 10.1016/0005-2736(92)90391-x. [DOI] [PubMed] [Google Scholar]
- 51.Zhou C, Garigapati V, Roberts MF. Short-chain phosphatidylinositol conformation and its relevance to phosphatidylinositol specific phospholipase C. Biochemistry. 1997;36:15925–15931. doi: 10.1021/bi9716175. [DOI] [PubMed] [Google Scholar]
- 52.Bradshaw JP, Bushby RJ, Giles CCD, Saunders MR. Orientation of the headgroup of phosphatidylinositol in model membrane as determined by neutron diffraction. Biochemistry. 1999;38:8393–8401. doi: 10.1021/bi990338+. [DOI] [PubMed] [Google Scholar]
- 53.Fridriksson EK, Shipkova PA, Sheets ED, Holowka D, Baird B, McLafferty FW. Quantitative analysis of phospholipids in functionally important membrane domains from RBL-2H3 mast cells using tandem high-resolution mass spectrometry. Biochemistry. 1999;38:8056–8063. doi: 10.1021/bi9828324. [DOI] [PubMed] [Google Scholar]
- 54.Kodama M, Shibata O, Nakamura S, Lee S, Sugihara G. A monolayer study on three binary mixed systems of dipalmitoyl phosphatidyl choline with cholesterol, cholestanol and stigmasterol. Colloid Surf. B: Biointerf. 2004;33:211–226. [Google Scholar]
- 55.Almeida RFM, Fedorov A, Hinderliter A. Sphingomyelin/phosphatidylcholine/cholesterol phase diagram: boundaries and composition of lipid rafts. Biophys. J. 2003;85:2406–2416. doi: 10.1016/s0006-3495(03)74664-5. [DOI] [PMC free article] [PubMed] [Google Scholar]


