Abstract
Pancreatic β-cells are interconnected by gap junctions, which allow small molecules to pass from cell to cell. In spite of the importance of the gap junctions in cellular communication, modeling studies have been limited by the complexity of the system. Here, we propose a mathematical gap junction model that properly takes into account biological functions, and apply this model to the study of the β-cell cluster. We consider both electrical and metabolic features of the system. Then, we find that when a fraction of the ATP-sensitive K+ channels are damaged, robust insulin secretion can only be achieved by gap junctions. Our finding is consistent with recent experiments conducted by Rocheleau et al. Our study also suggests that the free passage of potassium ions through gap junctions plays an important role in achieving metabolic synchronization between β-cells.
Keywords: pancreatic β-cells, gap junctions, synchronization, robustness
Synchronization of rhythms via receptors plays important roles in a variety of cellular processes. Cellular slime mold1, in which rich quantitative experimental data are available, has played a significant role in studies of rhythm synchronization via cAMP receptors. A synchronization scheme developed for the cellular slime mold2 has been generalized as a universal mathematical scheme3–5. Another important player in cellular synchronization is the gap junction. Most cells in animal tissues including pancreatic β-cells are in communication with their neighbors both electrically and metabolically via gap junctions, which allow the passage of small water-soluble ions and molecules smaller than ∼ 1000 daltons. The phenomenon of synchronization via gap junctions in the pancreatic β-cells has been extensively investigated6,7. Nonetheless, the study of gap junctions is still in a challenging stage in large part because of the complex relationship between structure and function.
Pancreatic β-cells, located in the islets of Langerhans, secrete insulin in response to the level of glucose in the blood allowing the glucose level in the blood to be maintained within a small range around 5.6 mM. Insulin secretion is oscillatory with a period of ≤1 min (fast oscillatory mode), 2–7 min (slow oscillatory mode), or a combination of the two8–10.
It is generally believed that Ca2+ feedback to ATP production is responsible for the fast oscillatory mode of insulin secretion, whereas glycolysis is responsible for the slow oscillatory mode. The glucose-phosphorylating enzyme glucokinase act as a metabolic glucose sensor in liver and β-cells11. The electrical activity of β-cells has a characteristic behavior known as bursting. A burst consists of an active phase of spiking followed by a silent phase of hyperpolarization. During the silent phase, Ca2+ is cleared by Ca2+ ATPases.
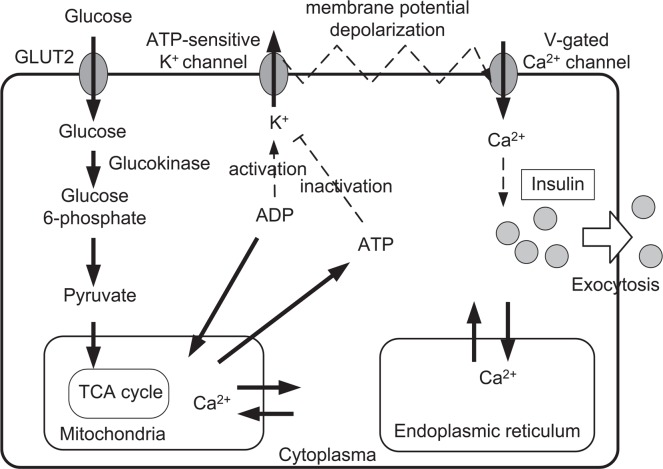
The essential processes in insulin secretion are as follows (see Fig. 1): ATP-sensitive K+ channels in the plasma membrane are activated by ADP and inactivated by ATP; thus the ratio of these nucleotides determines the fraction of open K(ATP) channels. When the ATP/ADP ratio is elevated, there is a reduction in the number of open K(ATP) channels. This results in membrane depolarization, causing voltage-dependent Ca2+ channels to open. The resulting Ca2+ influx evokes insulin secretion. The difference among various mathematical models may originate in the extent to which common cellular processes beyond the essential processes are taken into account.
Figure 1.
Essential processes of the insulin secretion6. Glucose is taken into the β-cell by GLUT-2 transporters, and broken down during glycolysis. Glycolytic product pyruvate is taken into the mitochondria in order to produce ATP. The ATP-sensitive K+ channel regulates membrane potential, and Ca2+ flow into the cell, and the insulin release into the blood is prompted by the elevated cytosolic Ca2+ concentration.
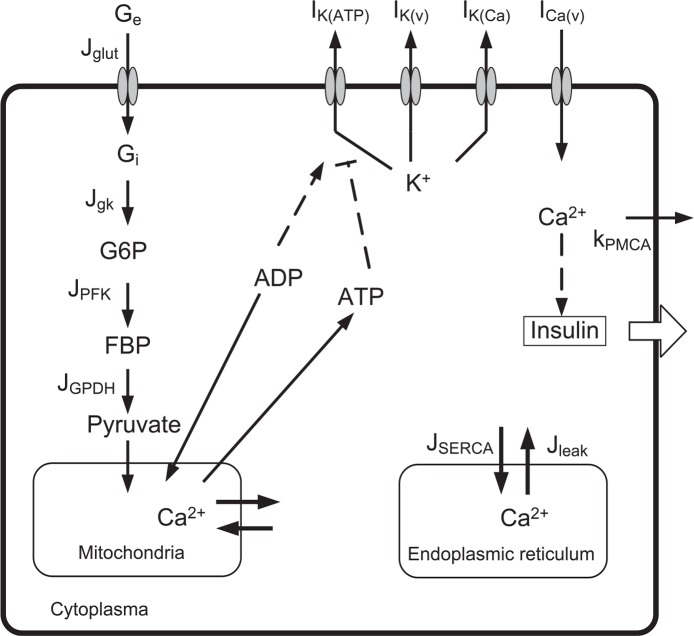
Comparisons among experimental observations have been performed mostly in the context of mathematical models of single β-cells. However, experimental observations are conducted in β-cell clusters, where β-cells are connected with gap junctions. In this letter, we propose a gap junction model that clarifies the relationship between the synchronization phenomena and the cellular processes via gap junctions. From among many proposed single pancreatic β-cell models6,10,12–20, here we adopt one by Pedersen et al.6, and generalize their model from the single-cell level to a multicellular system. The model by Pedersen et al. (see Fig. 2) is not complete as a whole β-cell model, but its relative simplicity facilitates generalization to the multicellular system. We expect that the simplicity of the model can help our intuitive understanding of the numerical investigations. Naturally, this also gives some limitations to our study as discussed in Appendix A.
Figure 2.
A scheme for insulin secretion adopted by Pedersen et al.6 Ge is the extracellular glucose concentration; Gi is the intracellular glucose concentration; G6P is glucose 6-phosphate concentration; FBP is fructose 1-6-bisphosphate concentration; and SERCA means the SERCA pumps.
To model gap junctions, the electrical coupling between cells has often been handled by adding the following linear coupling term6, −gc(vi − vj), where gc is the coupling strength between neighbor cells i and j. Such a linear coupling approximation has recently been extended to Ca2+ and glycolytic metabolites7. In these works, the coupling strength of gap junctions has been treated as a free parameter while the relationship between the adopted coupling parameters and the structure and the function of gap junctions has been left as an unanswered question. Furthermore, the electrical coupling and the ion currents between β-cells must be studied in a consistent manner since ions such as K+ and Ca2+ can freely move through gap junctions. Here, we propose a gap junction model based on the Goldman, Hogkin, and Katz (GHK) approximation21 to answer such a fundamental question. Our proposed scheme can handle both the membrane ion currents and the gap currents in a consistent manner.
The structure of this paper is as follows. Following this brief introduction (Section I), we present our mathematical modeling of gap junctions in Section II, and describe our numerical investigations in Section III. Comparison of the prediction of our model to the recent experimental results of Rocheleau et al.22 is presented in Section IV. Limitations of the linear coupling scheme are discussed in Section V. Finally, we discuss our results in Section VI.
Modeling of gap junctions of β-cells
We generalize the single β-cell model proposed by Pedersen et al to a multicellular system as follows. Our equation for the membrane potential (v) of the i-th β-cell is given by
| (1) |
where Cm is the membrane capacitance, is the v-dependent K+ current, is the v-dependent Ca2+ current, is the calcium-activated K+ current, is the ATP-sensitive K+ current, and is the gap current. Figure 3 shows the general structure of gap junctions. We also assume that the flow of ions through gap junctions is driven not only by the electric field but also by the concentration gradient. Thus, we obtain the Nernst-Planck equation for the flow of ions21
| (2) |
where ϕ is the electrical potential, cA is the concentration of type A ions, F is Faraday’s constant, z is the valence of ions, DA is the diffusion constant of type A ions, SG is the cross-sectional area of the gap junction, and RT is the gas constant multiplied by the absolute temperature. Then, the gap current IG is
We also use , where rC ≅ 0.75 nm is the radius of a single channel and NC is number of channels in a gap junction. It is known that NC is a few to many thousands23. When the length of the gap junctions is d (see Fig. 3b), the potential difference in the gap junction can be approximated (Goldman, Hogkin, and Katz21) as
Next, we obtain the following current equation of type A ions for the gap junctions
| (3) |
| (4) |
where the Einstein relation between the diffusion coeffcient DA and the ionic mobility uA, namely DA = uART/zAF is used. Thus, the gap current becomes
| (5) |
where j is the nearest-neighbor cell of cell i.
Figure 3.
The general structure of gap junctions23. Within a gap junction, there are a few to many thousands channels of diameter 1.5 nm. The length of the cell gap is about 2∼4 nm. The thickness of the cell membrane is about 5 nm. Thus, the length of the gap junctions d is nearly 13 nm. The channels allow inorganic ions and molecules with a mass of less than 1 kDa to pass into the other cell.
Using the gap current, the equation of conservation for K+ ions within the i-th cell becomes
| (6) |
where Vcyt(= 1150(μm)3) is the cytosolic volume of a single cell, is the inward potassium current (see Appendix A for its detailed discussion), and is the gap current of K+ ions. Summing the length of the cell gap (2∼4 nm) and the thickness of the two neighboring cell membranes (∼5 nm), we obtain d=3 nm+5 nm * 2=13 nm as an approximation here (see Fig. 3(b)). Such an approximation is necessary because the intracellular potential difference must vanish when the coupled system is in equilibrium.
Similarly, the equation of conservation for the free cytosolic Ca2+ concentration is
| (7) |
and the equation for the free Ca2+ concentration in the endoplasmic reticulum is
| (8) |
where
is the Ca2+ flux out of the endoplasmic reticulum, is the gap current of Ca2+, fcyt is the fraction of free to total cytosolic Ca2+, and kPMCA ≡ kPMCAVcyt, p˜leak ≡ pleakVcyt, k˜SERCA ≡ kSERCAVcyt. Where kPMCA, kSERCA, and pleak are the PMCA pump rate, SERCA pump rate, and the Ca2+ leakage rate from ER, fcyt and fer are the fraction of free to total cytosolic and the fraction of free to total ER Ca2+, respectively, Ver is the volume of the ER compartment. Thus, we can handle gap junctions consistently.
Synchronization of beta-cells via gap junctions
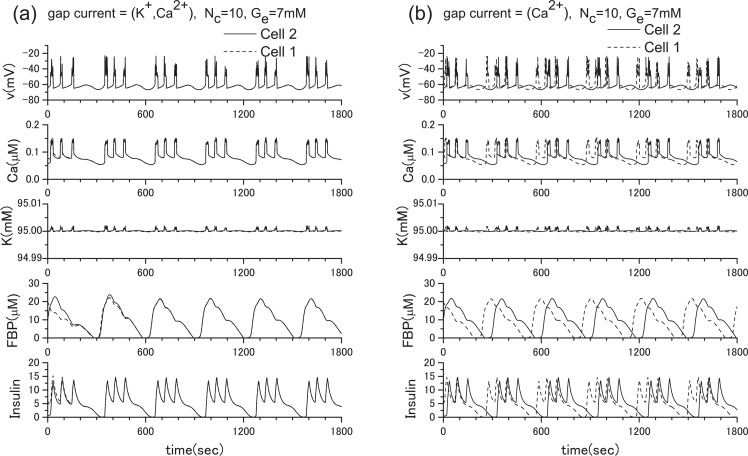
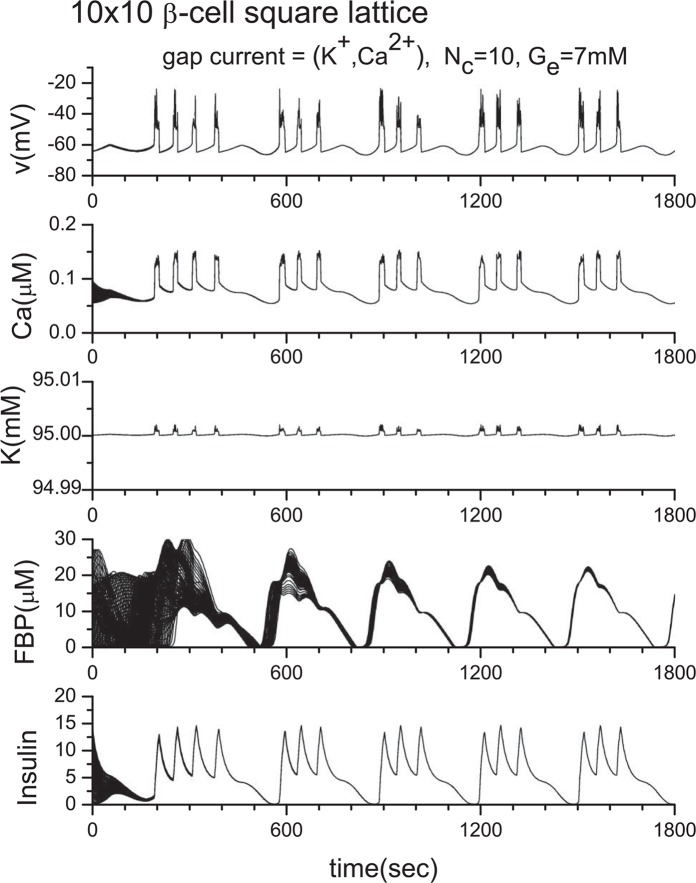
To clarify the role of gap junctions in the cellular processes, we have conducted extensive numerical investigations. From many numerical experiments, first, we show the result for the two β-cell system in Fig. 4, where we adopt ionic mobilities in water at 298 K24, namely, uK = 7.62×10⁻⁸ m2s−1V−1, uCa = 6.17 × 10⁻⁸ m2s−1V−1 as an approximation since specific values for the ionic mobilities in the β-cells are not currently available to our knowledge. In Fig. 4(a), both K+ ions and Ca2+ ions are allowed to pass through gap junctions. In this case, synchronization is achieved immediately although very different initial parameter values are adopted for the different cells. On the other hand, in Fig. 4(b), only Ca2+ ions are allowed to pass through gap junctions. It is clear that without free flow of K+ ions through the gap junction, synchronization cannot be achieved. The result is reasonable since the K+ ion concentration is much higher than the Ca2+ ion concentration within cells. Although we have also tested the case when only K+ ions are allowed to pass through gap junctions, we do not show it here because the obtained figure is nearly identical to Fig. 4(a). For our next example, we show the result for the 100 β-cell system in Fig. 5, where the 10×10 square lattice with the periodic boundary condition is used. Once again, we observed synchronous bursting. We do not provide any figure of channel number dependence because no qualitative change was observed when Nc is changed from 1 to 100.
Figure 4.
Synchronization is achieved immediately when both potassium ions and calcium ions are allowed to pass through gap junctions between two β-cells (a), but is not achieved when only calcium ions are allowed to pass through gap junctions (b). Here, ḡCa =1000 pS, and ḡK(ATP) =40000 pS, and the extracellular glucose concentration is 7 mM. The solid line and dotted line indicate different β-cells.
Figure 5.
Synchronization of 10×10 β-cell square lattice with periodic boundary conditions. Here, ḡCa =1000 pS, and ḡK(ATP) = 40000 pS.
Robustness of the insulin secretion by gap junctions
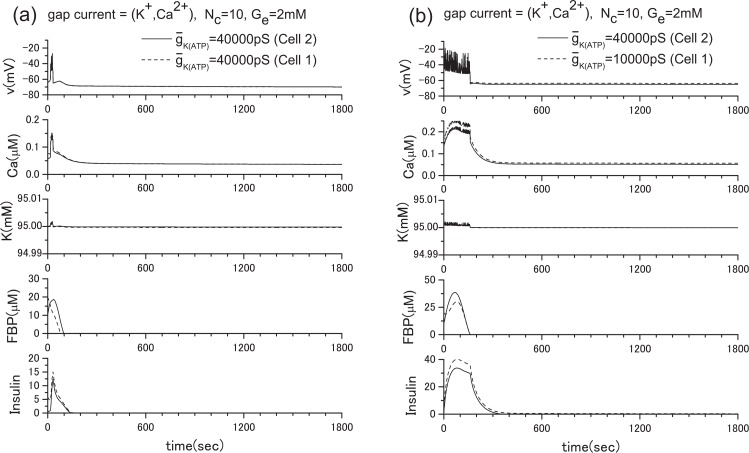
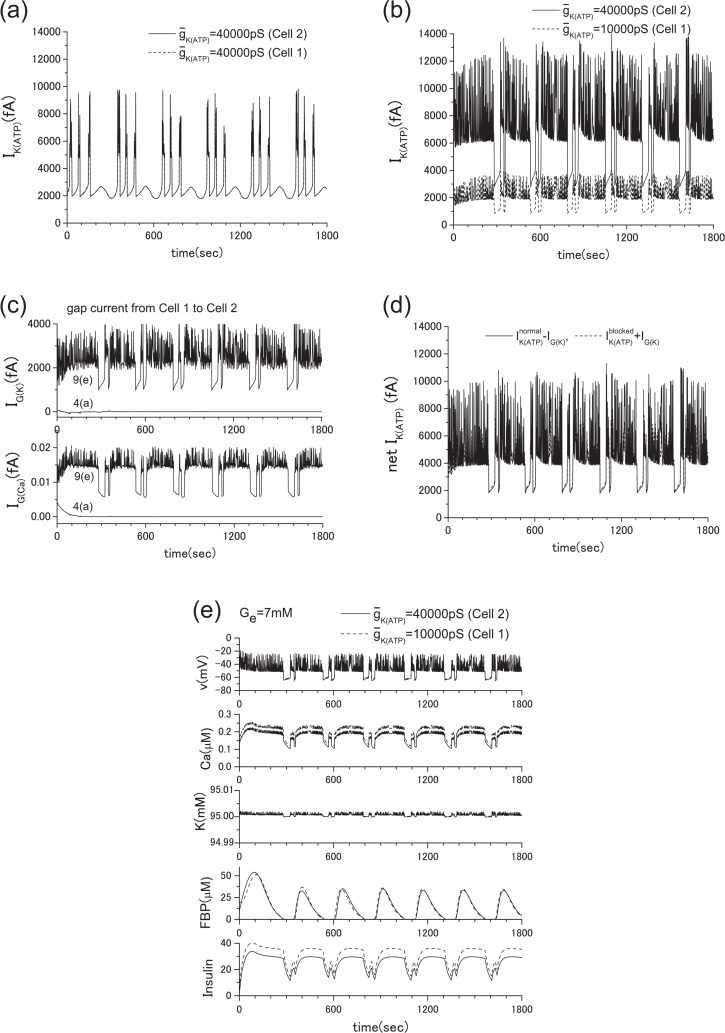
Recently, Rocheleau et al.22 conducted an interesting experiment by blocking the ATP-sensitive K+ channels and gap junctions. They used transgenic mice and showed that the robust control of the insulin secretion can be achieved by the gap junctions. Following their experiment, we conducted a numerical experiment in which Ge = 2 mM. To simulate their experiment, we reduced the conductance of the ATP-sensitive K+ channels by decreasing the value of ḡK(ATP) from the original value of 40000 pS to 10000 pS in a single β-cell. In this case, the insulin secretion is prompted as shown in Fig. 15. This corresponds to the case where the gap junction is disconnected (case in Fig. 6(c)). If the ATP-sensitive K+ channels are fully functional, no insulin secretion should be observed when Ge = 2 mM as shown in Fig. 13. However, when the gap junction is opened (case in Fig. 6(b)), insulin secretion ceases, as shown in Fig. 7(b). This robustness of the insulin secretion is consistent with the experiments of Rocheleau et al. To clarify the detailed mechanism of this robustness, we show the ATP-sensitive potassium current IK(ATP) and the gap currents IG(K) and IK(Ca) in Fig. 8. When the ATP-sensitive potassium channels of both cells are not blocked, the gap currents are negligibly small. However, when one of two cells is blocked, IG(K) and IK(ATP) of the normal cell are significantly increased (see Figs. 8(b), 8(c)). Figure 8(d) shows that minus IG(K) is nearly equal to the IK(ATP) of the blocked cell plus IG(K). Besides, both values are roughly equal to IK(ATP) in equilibrium state in Fig. 8(a). This means that a significant increase of IK(ATP) of the normal cell is brought about mostly by the outward gap current IG(K) from the blocked cell. This increase of IG(K) brings the intracellular potassium density of the blocked cell back to the normal level, and the insulin secretion ceases. Namely, the intercellular collaboration of ATP-sensitive potassium channels via gap junctions is a key of this robustness. Here the positive direction of IK(ATP) is outward from the cell.
Figure 6.
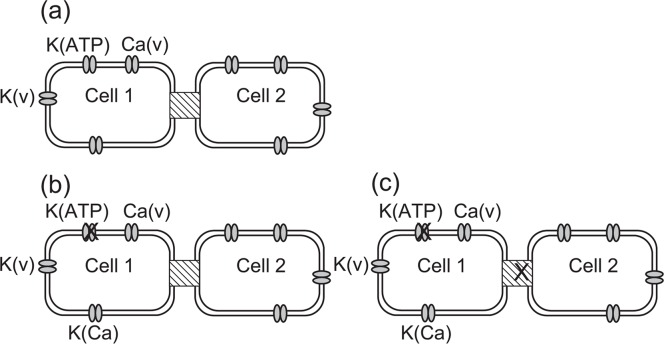
Two β-cells connected with gap junctions. (a) Wild type cells connected with gap junctions. (b) The K(ATP) channel in one of two β-cells is partially blocked. (c) The K(ATP) channel in one β-cell is blocked, and additionally, the gap junction is non-functional.
Figure 7.
Partial blocking of the ATP-sensitive K+ channels of the two β-cell system when Ge= 2 mM. (a) ḡK(ATP) =40000 pS (Cell 2), 40000 pS (Cell 1), (b) ḡK(ATP) =40000 pS (Cell 2), 10000 pS (Cell 1). The above figures correspond to the cases of Figs. 6(a) and 6(b), respectively. In the case of Fig. 6(c), the result becomes the simple sum of Fig. 14 and Fig. 15 since the gap junction is closed. This means that the insulin secretion cannot be stopped, even though the glucose level is low.
Figure 8.
ATP-sensitive K+ current and gap currents of the cases in Fig. 7, where Ge= 2 mM. (a) IK(ATP) of the case of Fig. 7(a), (b) IK(ATP) of the case of Fig. 7(b), (c) gap currents IG(K) and IG(Ca) of the cases of Figs. 7(a) and 7(b). When the ATP-sensitive potassium channels of both cells are fully functional, the gap currents are negligibly small. However, when one of them is blocked, the outward gap currents from the blocked cell and IK(ATP) of the normal cell are significantly increased, (d) a comparison of and , where and are ATP-sensitive potassium current of the blocked cell and that of the normal cell, respectively. Note that and in Fig. 8(d) are roughly equal to IK(ATP) in Fig. 8(a). An increase of IG(K) brings the intracellular potassium density of the blocked cell back to the normal level, and ultimately the insulin secretion is ceased. The intercellular collaboration of ATP-sensitive potassium channels via gap junctions is a key of this robustness. Here the positive direction of IK(ATP) is outward from the cell.
For the further confirmation of the above analysis, we have increased the extracellular glucose concentration Ge from 2 mM to 7 mM as shown in Fig. 9. Since we have already studied the case where both cells are normal as presented in Fig. 4(a), only the blocked case is shown in Fig. 9(e) except gap currents and IK(ATP).When Ge= 7 mM, the insulin is constantly secreted, but the role of gap junction for the metabolic synchronization is still important when some cell is damaged.
Figure 9.
ATP-sensitive K+ current and gap currents, where Ge = 7 mM. Similar to Fig. 8, the blocked or damaged cell significantly increases the outward gap currents IG(K) and IG(Ca) from the cell. (a) IK(ATP) of the case of Fig. 4(a), (b) IK(ATP) of the case of Fig. 9(e), (c) gap currents IG(K) and IG(Ca) of the cases of Figs. 4(a) and 9(e). (d) a comparison of and . They are nearly identical and in the same range of value of IK(ATP) in equilibrium state (2000 fA∼10000 fA) in Fig. 9(a).
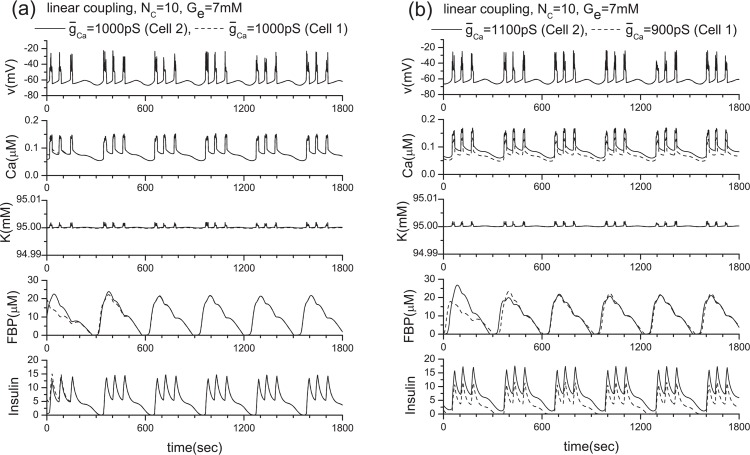
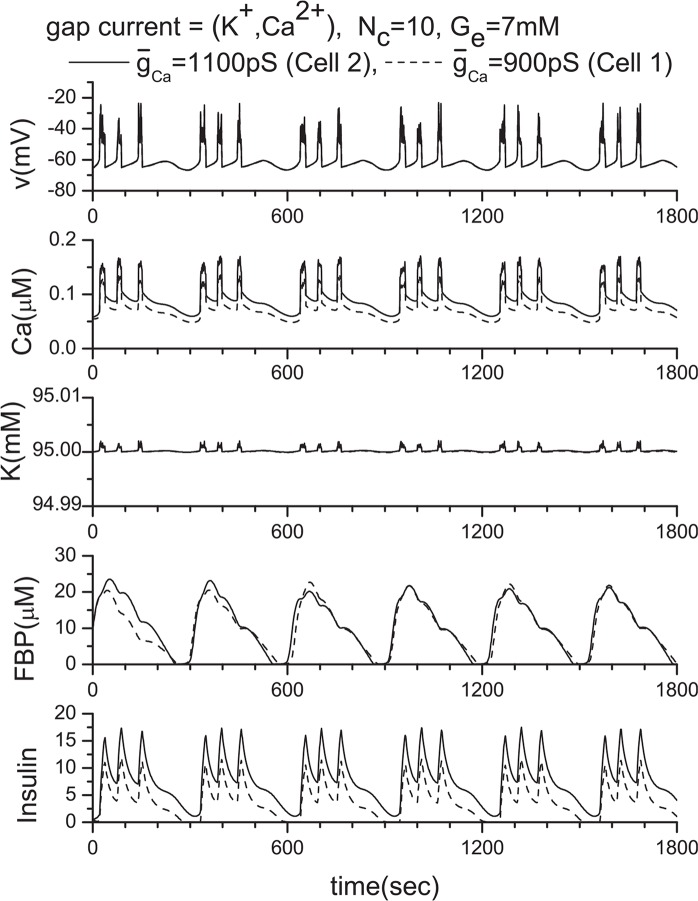
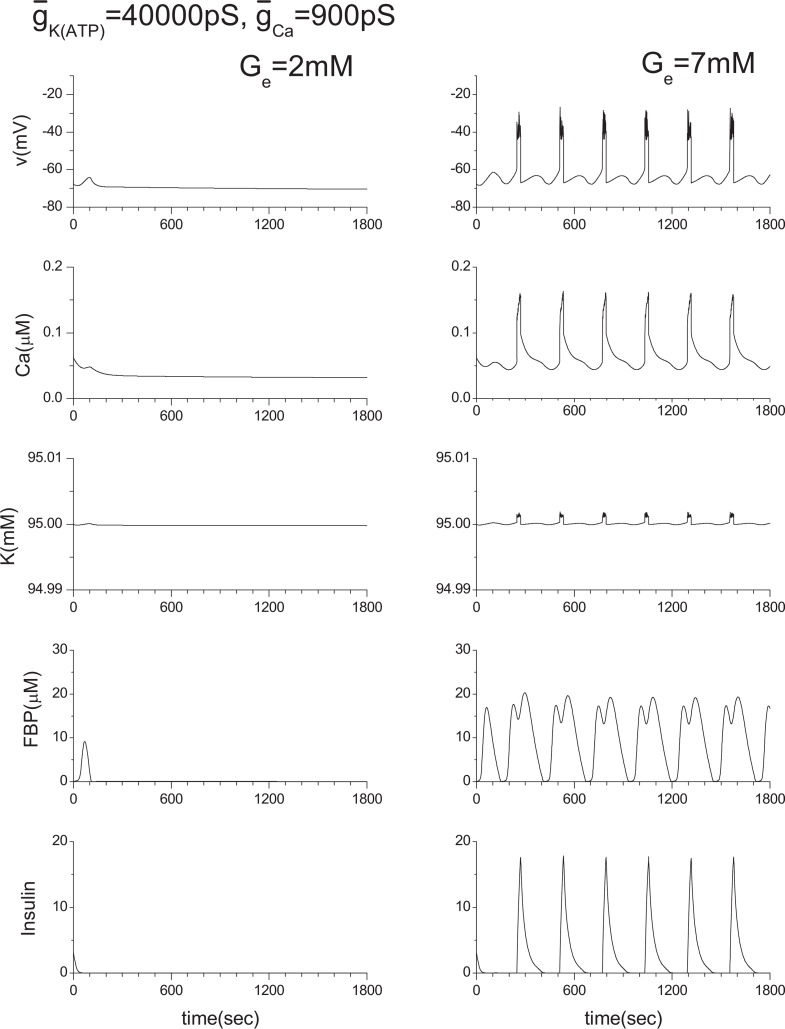
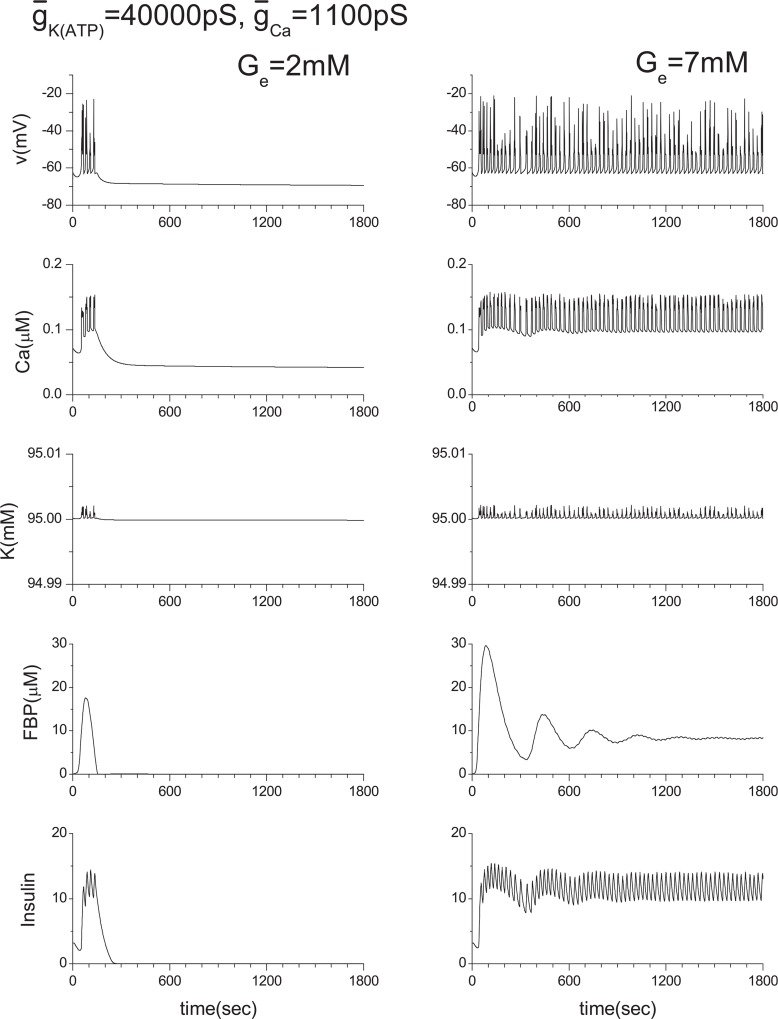
To investigate the role of gap junctions further, we studies the activity of the voltagegated Ca2+ channel by changing ḡCa values. The original ḡCa value is 1000 pS, and Fig. 14 shows the model calculations. We then changed the value of ḡCa from 1000 pS to 900 pS and 1100 pS. Their corresponding results are shown in Figs. 16 and 17, respectively. Two coupled β-cells are successfully synchronized via the gap junction, and a very similar result to that of the ḡCa =1000 pS case is produced (see Fig. 11(a) or Fig. 14) although original individual patterns are very different each other as shown in Figs. 16 and 17. This kind of character has been observed consistently in other tested cases including the three coupled β-cell system.
Figure 11.
Results of the linear coupling scheme. Here, two β-cells with the same and different ḡCa values when Ge = 7 mM. (a) ḡCa =1000 pS (Cell 2), 1000 pS (Cell 1), and (b) ḡCa =1100 pS (Cell 2), 900 pS (Cell 1).
The linear coupling scheme and its limitations
Because of its mathematical simplicity, the linear coupling scheme is often adopted for handling gap junctions without detailed biological discussions. Here we derive it from Eq. (4). By using the condition, (i, j are neighbor cell numbers), we can obtain
| (9) |
where . Here, we assume that only Ca2+ and K+ ions go through gap junctions. Then,
| (10) |
Since cK/cCa ≫ 1 within cells, it is clear that K+ ions play a much more important role than Ca2+ ions in the coupling of β-cells by gap junctions. If we use cK = 95 mM, cCa = 5.5×10⁻² μM, and T =310 K, we obtain gc ≅ gc(K) = 95NcpS and gc(Ca) = 1.1×10⁻⁵NcpS.
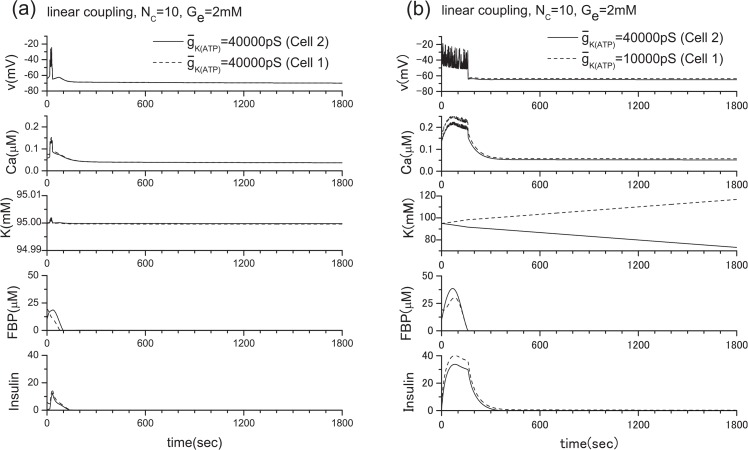
To clarify the limitation of the linear coupling scheme, we have conducted the following numerical experiments. The results are shown in Figs. 11 and 12, in which the number of channels is Nc = 10 as in previous investigations. By comparing Figs. 11(a) and 4(a), Figs. 11(b) and 10, and Figs. 12 and 7, it becomes clear that the linear coupling scheme works very well except when the ḡK(ATP) values of individual β-cells are different as shown in Fig. 12(b). The variation of ḡCa values does not provide any problem as an approximation. This difference originates in how the intra-cellular potassium concentration is a ected by the parameter value variation. As shown in Fig. 15, only ḡK(ATP) variation has a ected the intracellular potassium concentration significantly. As a consequence, the precondition of for this scheme is lost.
Figure 12.
Results of the linear coupling scheme. Here, two β-cells with the same and different ḡK(ATP) values when Ge = 2 mM. (a) ḡK(ATP) =40000 pS (Cell 2), 40000 pS (Cell 1), (b) ḡK(ATP) =40000 pS (Cell 2), 10000 pS (Cell 1).
Figure 10.
Two β-cells with different ḡCa values, where ḡCa =1100 pS (Cell 2), 900 pS (Cell 1), and Ge = 7 mM.
Discussion
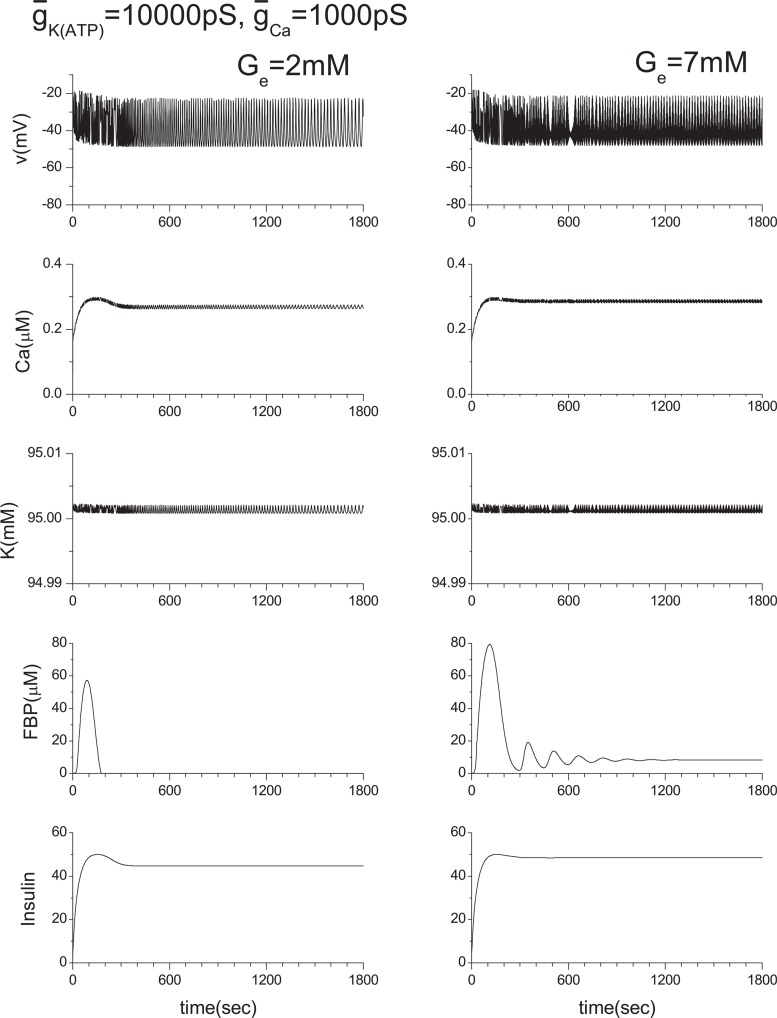
In this study, we have proposed a mathematical model for the gap junction based on the biological functions and the structure of gap junctions, and applied it to the β-cell cluster in the islets of Langerhans. Our model demonstrates that free flow of potassium ions through gap junctions plays an essential role in achieving synchronous bursting. When metabolic synchronization between β-cells is achieved, the net current through gap junctions becomes negligible. However, the ionic flow through gap junctions becomes essential when some of the ATP-sensitive K+ channels in the β-cells are damaged. The proved robustness of the insulin secretion is consistent with the experimental observations of Rocheleau et al.22. We offer the following interpretation of our findings. Intracellular calcium ion concentration is relatively insensitive to the variation of the conductance ḡCa so long as the function of the ATP-sensitive K+ channels is normal. However, when a fraction of the ATP-sensitive K+ channels is damaged, intracellular potassium ion concentration is increased (Fig. 15). This increase also brings about an increase in calcium ion concentration. As a consequence, insulin secretion is stimulated even when the glucose level is low. However, when the damaged cell is connected with the normal cells with gap junctions, mutual membrane potential synchronization is achieved immediately due to the free flow of potassium ions through gap junctions. Thus, the intracellular potassium ion concentration of the damaged cell returns to the normal level, and calcium ion concentration is reduced to the normal level a little later. This stops insulin secretion, and the robust insulin secretion can be achieved (Figs. 7 and 8).
We have also derived a linear coupling scheme from the GHK approximation, assuming that the ion concentrations between neighbor cells are nearly equal. The performance of the linear coupling scheme is excellent, so long as the ATP-sensitive K+ channels are normal between neighbor cells because the intracellular potassium density is sensitive to ATP-sensitive K+ channels (Fig. 15). One cannot expect nearly equal ion concentrations between neighboring cells, as that would break the basis of the linear coupling scheme.
As discussed in Appendix A, we have introduced IK(in) =−ICa(v) term into the equation of conservation for potassium ions as an approximation. This mathematical (as opposed to biological) approximation is necessary to hold intracellular potassium concentration steady, in the context of the single β-cell model by Pedersen et al. and their original parameter values. This problem does not appear explicitly so far as the constant Nernt potential is adopted in any scheme. This inconsistency may have occurred due to the lack of pumps that are responsible for the inward potassium current in the model equations. Thus, in future models, we would like to introduce such pumps along with the sodium current in order to avoid such a drastic approximation. Until then, we should take our findings as predictions and they must be confirmed by the direct observation of gap currents.
Acknowledgments
We appreciate Professor Michael Meyer-Herman very much for sending us β-cell modeling software. We also appreciate Professor Sherman for sending us his preprint (Tsaneva-Atanasova and Sherman, Biophysical Journal 97, November, 2009) after completion of the current work, and very extensive and constructive discussions. He has studied the same problem of Rocheleau et al.22, too, by adopting the linear coupling model. We also acknowledge Mr. Atshushi Yokoyama for his help during the preparatory stages of the current work.
APPENDIX A. Modification of the single b-cell model by Pedersen et al.
In this letter, we adopt the single β-cell model by Pedersen et al., and their fitting parameters6 unless stated otherwise (only typical parameters are shown in Table 1). However, for handling the ion flow through gap junctions, we must modify their model, although their original parameter values are not changed.
Table 1.
Typical variable values. See ref. 6 for other variables
| Variables | |
|---|---|
| Cm = 5300 fF | ḡK =2700 pS |
| ḡCa =1000 pS | ḡK(Ca) =400 pS |
| ḡK(ATP)=40000 pS | vK = −75 mV |
| vCa = 25 mV | Vcyt = 1150 µm3 |
| Vcyt/Ver = 31 | kPMCA = 0.18 ms−1 |
| kSERCA = 0.4 ms−1 | pleak = 0.0002 ms−1 |
| fcyt = 0.01 | fer = 0.01 |
The equation for the membrane potential (v) of a β-cell is and
| (A1) |
the equation for the free cytosolic Ca2+ concentration is
| (A2) |
For potassium, the approximation of constant K+ ion concentration is used. But such an approximation is not appropriate to study the gap junctions. In general, the Nernst potential of the potassium, vK, assumes the constant K+ ion concentrations. A natural replacement of such an approximation is the adoption of the equation for the conservation of K+ ions within a cell,
| (A3) |
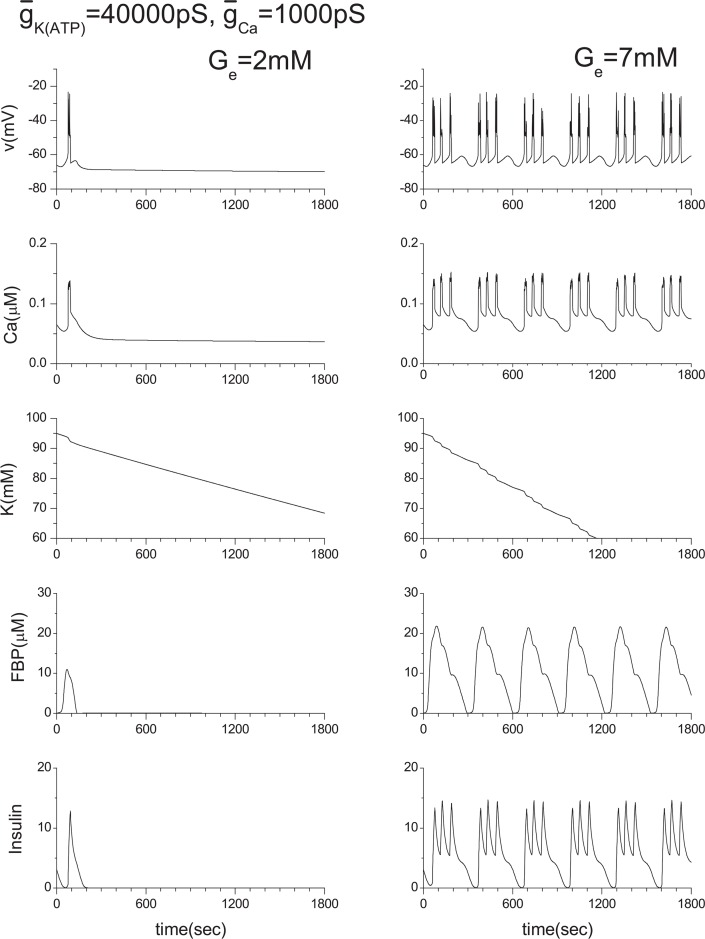
where K ≡ cK is the intracellular K+ ion concentration. However, Eq. (A3) does not guarantee stable K+ ion concentration within a cell as shown in Fig. 13. This result is not consistent with the constant Nernst potential, either. This is because pumps that are responsible for the inward potassium current are not included in the scheme to stabilize the intra-cellular K+ ion concentration. Then, we rewrite Eq. (A3) as
| (A4) |
where IK(in) is the inward potassium current. But an introduction of the new term IK(in) should not break the consistency of the whole scheme. In the steady state, dv/dt = dK/dt = 0. Then, we can derive the relationship, IK(in) = −ICa(v), from Eqs. (A1) and (A4). We adopt it as an approximation in the near-equilibrium state. Figure 14 shows that this approximation can successfully stabilize the intracellular K+ ion concentration without breaking the self-consistency of the whole scheme. We use cK = 95 mM25 as the intracellular K+ ion concentration at the rest-cell state in the current calculations. An adoption of cK = 132.4 mM17 instead of cK = 95 mM only shifts the base values of the K+ ion concentration from 95 mM to 132.4 mM in every calculation. The inward potassium current has already been taken into account in the single β-cell models by Meyer-Hermann20 in a different form.
For a wide range of studies of multicellular systems, it is necessary to confirm that our approximation, IK(in) = −ICa(v), does not produce any artificial e ect within the single β-cell system. Otherwise, the reliability of our study of multicellular systems could be lost. Therefore, we have conducted extensive numerical calculations by changing the values of ḡK(ATP) and ḡCa. Here, several cases closely related with the current work are shown in Figs. 15–17. In Fig. 14, the ḡK(ATP) is changed to 10000 pS from the original value of 40000 pS. ḡCa is changed to 900 pS and 1100 pS from the original value of 1000 pS in Figs. 16 and 17, respectively.
Figure 13.
Single β-cell model calculations of Bedersen et al. together with Eq. (A3). The original model used the approximation of constant potassium ion concentration. Where v is the cell membrane potential, Ca is Ca2+ ion concentration, K is K+ ion concentration, and FBP is the concentration of fructose 1,6-bisphosphate.
Figure 14.
Modified single β-cell model calculations, where Eq. (A4) was used instead of Eq. (A3).
Figure 15.
Effect of ḡK(ATP) variation. Original ḡK(ATP) value is 40000 pS. Note that K value is slightly higher than 95 mM here.
Figure 16.
Effect of the ḡCa variation. Original ḡCa value is 1000 pS.
Figure 17.
Effect of the ḡCa variation. Original ḡCa value is 1000 pS.
References
- 1.Nagano S. Modeling the model organism Dictyostelium discoideum. Develop. Growth Differ. 2000;42:541–550. doi: 10.1046/j.1440-169x.2000.00547.x. [DOI] [PubMed] [Google Scholar]
- 2.Nagano S. Diffusion-assisted aggregation and synchronization in Dictyostelium discoideum. Phys. Rev. Lett. 1998;80:4826–4829. [Google Scholar]
- 3.Nagano S. Biological receptor scheme for the robust synchronization of limit cycle oscillators. Prog. Theor. Phys. 2002;107:861–877. [Google Scholar]
- 4.Nagano S. Receptors as a master key for synchronization of rhythms. Phys. Rev. E. 2003;67:0562151–0562154. doi: 10.1103/PhysRevE.67.056215. [DOI] [PubMed] [Google Scholar]
- 5.Yokoyama A, Nagano S. Biological receptor scheme for the external synchronization of mutually coupled oscillator systems. J. Phys. Soc. Jpn. 2008;77:0240021–0240029. [Google Scholar]
- 6.Pedersen MG, Bertram R, Sherman A. Intra- and inter-islet synchronization of metabolically driven insulin secretion. Biophys. J. 2005;89:107–119. doi: 10.1529/biophysj.104.055681. [DOI] [PMC free article] [PubMed] [Google Scholar]
- 7.Tsaneva-Atanasova K, Zimliki CL, Bertram R, Sherman A. Diffusion of calcium and metabolites in pancreatic islets: killing oscillations with a pitchfork. Biophys. J. 2006;90:3434–3446. doi: 10.1529/biophysj.105.078360. [DOI] [PMC free article] [PubMed] [Google Scholar]
- 8.Bergsten P, Hellman B. Glucose-induced amplitude regulation of pulsatile insulin secretion from individual pancreatic islets. Diabetes. 1993;42:670–674. doi: 10.2337/diab.42.5.670. [DOI] [PubMed] [Google Scholar]
- 9.Bergsten P. Slow and fast oscillations of cytoplasmic Ca2+ in pancreatic islets correspond to pulsatile insulin release. Am. J. Physiol. 1995;268:E282–E287. doi: 10.1152/ajpendo.1995.268.2.E282. [DOI] [PubMed] [Google Scholar]
- 10.Bertram R, Satin LS, Pedersen MG, Luciani DS, Sherman A. Interaction of glycolysis and mitochondrial respiration in metabolic oscillations of pancreatic islets. Biophys. J. 2007;92:1544–1555. doi: 10.1529/biophysj.106.097154. [DOI] [PMC free article] [PubMed] [Google Scholar]
- 11.Baltrusch S, Tiedge M. Glucokinase regulatory network in pancreatic β-cells and liver. Diabetes. 2006;55:S55–S64. [Google Scholar]
- 12.Chay TR, Keizer J. Minimal model for membrane oscillations in the pancreatic β-cell. Biophys. J. 1983;42:181–190. doi: 10.1016/S0006-3495(83)84384-7. [DOI] [PMC free article] [PubMed] [Google Scholar]
- 13.Sherman A, Rinzel J, Keizer J. Emergence of organized bursting in clusters of pancreatic β-cells by channel sharing. Biophys. J. 1988;54:411–425. doi: 10.1016/S0006-3495(88)82975-8. [DOI] [PMC free article] [PubMed] [Google Scholar]
- 14.Smolen P, Keizer J. Slow voltage inactivation of Ca2+ currents and bursting mechanisms for the mouse pancreatic beta-cell. J. Membrane Biol. 127:9–19. doi: 10.1007/BF00232754. [DOI] [PubMed] [Google Scholar]
- 15.Smolen P. A model for glycolytic oscillations based on skeletal muscle phosphofructokinase kinetics. J. Theor. Biol. 1995;174:137–148. doi: 10.1006/jtbi.1995.0087. [DOI] [PubMed] [Google Scholar]
- 16.Maki LW, Keizer J. Analysis of possible mechanism for in vitro oscillations of insulin secretion. Am. J. Physiol. 1995;268:C780–C791. doi: 10.1152/ajpcell.1995.268.3.C780. [DOI] [PubMed] [Google Scholar]
- 17.Fridlyand LE, Tamarina N, Philipson LH. Modeling of Ca2+ flux in pancreatic β-cells: role of the plasma membrane and intracellular stores. Am. J. Endocrinol. 2003;285:E138–E154. doi: 10.1152/ajpendo.00194.2002. [DOI] [PubMed] [Google Scholar]
- 18.Bertram R, Satin LS, Zhang M, Smolen P, Sherman A. Calcium and glycolysis mediate multiple bursting modes in pancreatic islets. Biophys. J. 2004;87:3034–3087. doi: 10.1529/biophysj.104.049262. [DOI] [PMC free article] [PubMed] [Google Scholar]
- 19.Bertram R, Pedersen MG, Luciani DS, Sherman A. A simplified model for mitochondrial ATP production. J. Theor. Biol. 2006;243:575–586. doi: 10.1016/j.jtbi.2006.07.019. [DOI] [PubMed] [Google Scholar]
- 20.Meyer-Hermann ME. The electrophysiology of the β-cell based on single transmembrane protein characteristics. Biophys. J. 2007;92:2952–2968. doi: 10.1529/biophysj.107.106096. [DOI] [PMC free article] [PubMed] [Google Scholar]
- 21.Keener J, Sneyd J. Mathematical Physiology. Berlin: Springer; 1998. [Google Scholar]
- 22.Rocheleau JV, Remedi MS, Granada B, Head WS, Koster JC, Nichols CG, Piston DW. Plos Biol. 2006;4:e26. doi: 10.1371/journal.pbio.0040026. [DOI] [PMC free article] [PubMed] [Google Scholar]
- 23.Alberts B, Johnson A, Lewis J, Raff M, Roberts K, Walter P. Molecular Biology of the Cell. 2002:1075. Garland Science. [Google Scholar]
- 24.Atkins P, Paula J. Physical Chemistry Seventh Edition. Oxford: Oxford Univ. Press.; 2002. p. 1103. [Google Scholar]
- 25.Atwater I, Ribalet B, Rojas E. Cyclic changes in potential and resistance of the β-cell membrane induced by glucose in islets of Langerhans from mouse. J. Physiol. 1978;278:117–139. doi: 10.1113/jphysiol.1978.sp012296. [DOI] [PMC free article] [PubMed] [Google Scholar]


