Abstract
We found that a solution of actin filaments can form a periodic texture in the process of drying on a flat glass surface in the air; the periodic texture was composed of smooth meandering bundles of actin filaments. We also found that a branched salt crystal grows in the space between the meandering bundles of actin filaments. The distance between the adjacent striae (striation period) in the resulting dried two-dimensional pattern of striation decreased from about 50 to 2 μm, as the ambient temperature was increased from 4 to 40°C at 1 mg/ml actin, and showed an increasing tendency from a few to several tens μm with the increase in the initial concentration of actin filaments from 0.6 to 2.0mg/ml at room temperature. As the speed of drying is increased at a certain temperature, the striation period was also found to decrease. We propose that the formation of the two-dimensional striation pattern of bundles of actin filaments is the result of condensation of proteins due to dehydration, and suggest that the solvent flow from the center to the periphery of the sample causes the meandering of actin filaments.
Keywords: Drying of actin solution, liquid crystal, striation pattern, texturing
Actin is a versatile protein both functionally and structurally. One of the significant characteristics that actin exhibits under available physiological conditions is its capacity to form various structural patterns as observed in a wide variety of cytoskeletal organizational patterns1. In particular, actin filaments in an aqueous solution undergo a phase transition from the isotropic state to a liquid crystalline state when either the mean filament length or the actin concentration is increased above a certain threshold value2–6, presumably due to the excluded volume effect of rod-like molecules on the formation of liquid crystalline structure7,8. The phase transition in solution also depends upon the temperature in view of the fact that the interfilamental interactions could be orientation dependent or that the flexibility of the filament could be temperature dependent9. At the same time, pattern formation of actin filaments in condensed medium necessitates the production of a nano-meter scale macromolecular self-assembly which hopefully facilitates various biological functions10–13. One possibility for the fabrication of such an assembly may be the dehydration of those molecules in aqueous suspension14.
Here we report our observation that actin filaments in an aqueous solution exhibit various two-dimensional striation patterns in the process of drying. Our primary interest is to determine the mechanism of formation of the striation pattern and to elucidate what types of factors affect the striation period. A part of this report was presented in Japanese as the graduation dissertation of one of the authors (H. Honda: “Spontaneous Orientation of Actin Filaments in vitro”) at the Undergraduate School of the Department of Physics, School of Science and Engineering, Waseda University (March, 1982).
Materials and Methods
Preparation of proteins
For the preparation of actin, acetone powder was prepared from rabbit white skeletal muscle according to a standard procedure, however the regulatory proteins were extracted prior to the acetone treatment15. After extraction of actin from the acetone powder and purification by polymerization-depolymerization cycles, actin filaments (F-actin) were placed in a buffer composed of 0.1M KCl, 0.5mM ATP, 2mM Tris-HCl (pH8.0) and 0.1mM CaCl2 and stored on ice. The purity of actin was confirmed by SDS-PAGE and the protein concentration was measured by the Biuret method16. Tropomyosin was also prepared from rabbit skeletal muscle17,18. Bovine serum albumin (BSA) was purchased from Sigma (St. Louis, MO).
Recordings
Observation of the various patterns exhibited by F-actin was carried out with the use of phase-contrast (BIOPHOTO VBS-UWT, Nikon, Tokyo) and polarizing microscopes (OPTIPHOT-POL, Nikon). Images were monitored through a CCD camera (CCD-Z1, Shimadzu, Kyoto) and videotape recordings were made (AG-3700, Matsushita, Tokyo). Photographs were taken with a Nikon F4 camera mounted on the microscope.
Two-dimensional pattern formation
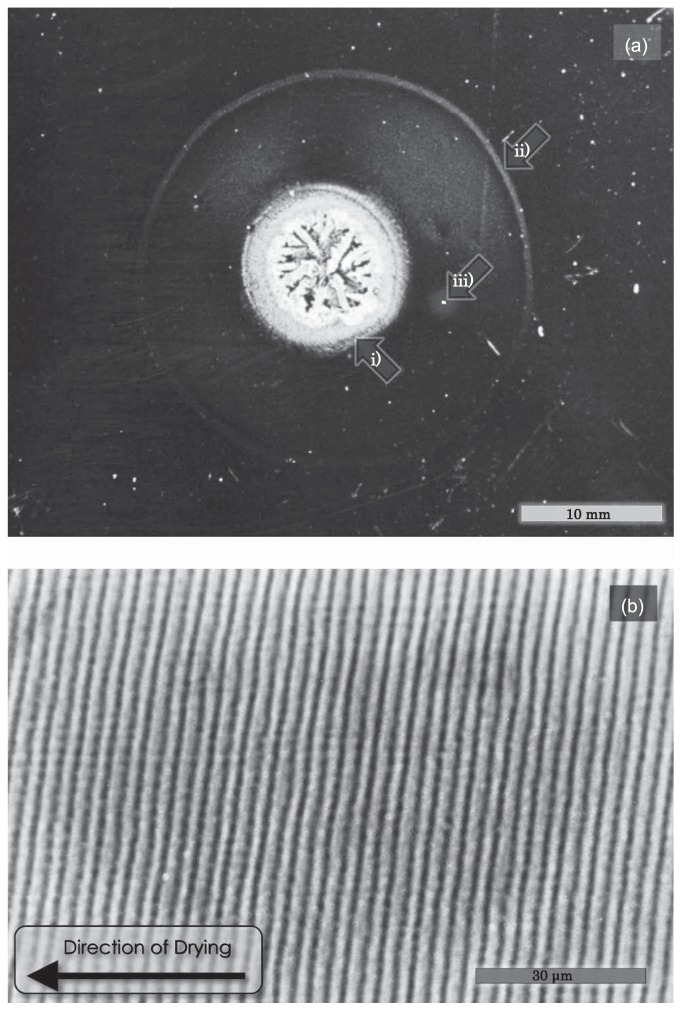
Two-dimensional patterns of F-actin were formed by the following two methods: 1) natural drying of an F-actin solution (0.4 to 2.0mg/ml) or (2) incubation in a small chamber without drying of an F-actin solution (10mg/ml). In the method 1, a droplet of 40–70 μl solution was dropped from about 2 cm above the pre-cleaned glass slide (No. 1, Matsunami, Tokyo) to form a circular shaped spread sample of 10–15mm in diameter. After evaporation of water from the periphery, a two-dimensional pattern having a concentric striation of a few μm to 20–40 μm was formed around the crystallized salt that was finally formed at the center of the circularly spread sample (cf. Fig. 1a). In the method 2, the F-actin solution was put in a covered cylindrical chamber (about 5mm in diameter and about 2mm in depth), and then incubated for a week at room temperature in an ordinary atmospheric conditions.
Figure 1.
General view of the two-dimensional texture obtained by natural drying of F-actin solution. (a) About 70 μl of 1.0mg/ml F-actin solution containing 0.1M KCl, 5mM Tris-HCl (pH 8.0) and 0.2mM ATP was placed on a glass slide at room temperature. The sample was dried under normal atmospheric conditions for about 5 hrs. Image, bright-field. Scale bar, 10.0 mm. Salt crystal region and the periphery of the dried sample are indicated with arrows i) and ii), respectively. (b) A magnified view under phase-contrast microscope of the portion surrounded by a white square with an arrow iii) in (a) shows the concentric circular striation. Scale bar, 30 μm.
Two-dimensional pattern formation: controlled condition of drying
In order to examine the effect of temperature (other than room temperature) on pattern formation under stable drying conditions, we constructed a transparent enclosed box (450W×300D×260Hmm) into which a platform made of brass (120W×65D×10Hmm) was placed. The glass slide was put on the surface of the platform. The platform was connected to a closed pipe system through which temperature-controlled water flowed through at a controlled rate. Depending on whether the temperature examined is higher or lower than the room temperature, the box was placed at room temperature (25±2°C) or in a cold room (about 4°C), respectively. Silica gel was placed in the box to keep the air dry during each experimental time period.
Measurement of the speed of drying
For the circularly spread sample placed on the glass slide, drying began from the periphery. We first determined the edge of drying as the boundary between the wet and the dried portions of the sample, as identified under a microscope. The speed of drying was defined as the moving velocity of the edge of drying thus determined. Samples were completely dried within a few hours at room temperature or within several hours at 4°C.
Results
General view of the two-dimensional texture obtained by natural drying
Figure 1 shows a typical example of the two-dimensional texture obtained by natural drying of an F-actin (1.0mg/ml) solution at room temperature (method 1 described in Materials and Methods). The evaporation of solvent occurred from the periphery, so that the radius of the wet area gradually decreased. After the specimen was completely dried, a two-dimensional texture was formed with salt crystals at the center of the texture as shown by arrow i) in Figure 1a. We found that a concentric striation pattern, the outer periphery of which is indicated by arrow ii), was formed. A magnified view of the phase-contrast micrograph at a rectangular region shown by arrow iii) revealed that the average striation period was about 3.0 μm (Fig. 1b). The striation period was almost independent of the distance from the periphery, suggesting that the period may not depend on the ionic strength (note that the ionic strength of solution increases with drying, see Fig. 9c).
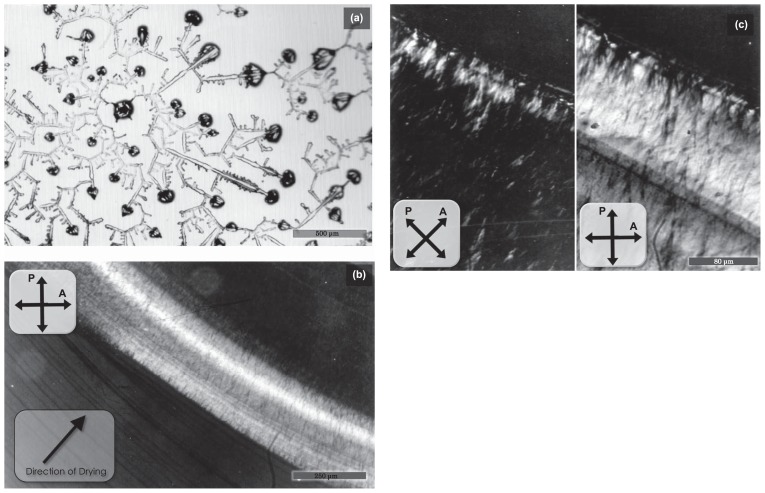
Figure 9.
Polarizing micrograph showing the two-dimensional pattern formed by natural drying of BSA solution (a) and tropomyosin solution (b, c). Drying was performed according to method 1, as described in Materials and Methods. (a) Concentration of BSA, 1.0mg/ml. Solvent, 0.1M KCl, 0.5mM sodium bicarbonate. Scale bar, 500 μm. (b, c) Concentration of tropomyosin, 1.0mg/ml. Solvent, 1.0mM MgCl2, 0.5mM sodium bicarbonate. Photographs in (c) were taken by high magnification in a different place from that of (b). Scale bars, 250 μm (b) and 80 μm (c).
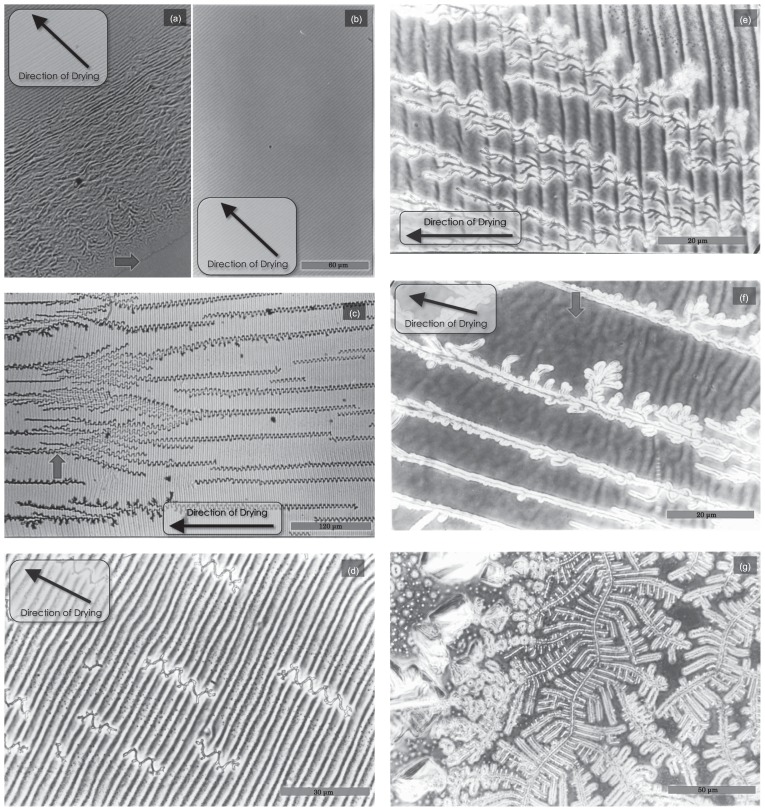
Figure 2 shows the detailed structure which was formed after drying at various places from the peripheral area (Fig. 2a) to the central area (Fig. 2f). Randomly oriented F-actin bundles were frequently observed at the periphery of the dried sample (Fig. 2a); these were caused by the turbulent flow produced when the solution was initially dropped. The striation region of F-actin bundles (Fig. 2b–e) appeared about 0.5 mm within the peripheral region. As the evaporation proceeded, branched salt crystals started to grow along the wavy F-actin bundles (Fig. 2c–e). Then the branched salt crystals gradually diminished. Note that the branching of the salt crystals consistently occurred at the black region of the striation (see Fig. 7b, in the white region the density of actin bundles seems to be low as indicated by the low density of CBB staining; also see the schematic illustration shown in Fig. 10). This result implies that the salt crystal formation preferentially occurs within a space where the protein concentration is low. Approaching the central region, thick salt crystals appeared and an irregular striation-like structure began to be formed (Fig. 2f). Finally, salt crystals grew at the center of the sample (Fig. 2g).
Figure 2.
Typical features of the dried sample observed under phase-contrast microscope at a high magnification. The same F-actin solution as shown in Figure 1 was dried at 30°C under normal atmospheric conditions. (a) Panel taken at the peripheral region where the complicated pattern of dried actin filaments was gradually forced to become a periodic pattern. The periphery is indicated by the arrow. (b) The periodic striation pattern spread widely at about 2mm away from the peripheral. Scale bar, 60 μm. (c) Approaching the central region, salt crystals began to grow in a winding manner. A branched salt crystal is shown by the arrow. Scale bar, 120 μm. (d, e) Panels showing close-up views of the area surrounding the salt crystals, which branched in a dendritic manner. Scale bars, 30 μm (d) and 20 μm (e). (f) Periodic textures of the sample gradually diminished as salt crystals grew. Accordingly, an irregular striation pattern appeared, as indicated by the arrow. Scale bar, 20 μm. (g) Only the salt crystals were observed near the center of the sample. Scale bar, 50 μm.
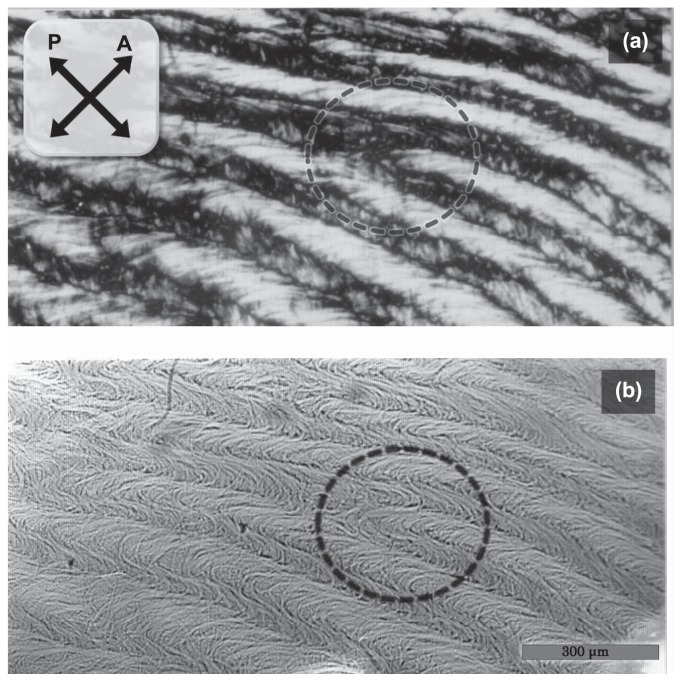
Figure 7.
Striation pattern composed of meandering bundles of F-actin which were formed in a high concentration of F-actin. A polarization image (a) and a bright-field image (b) were obtained before and after staining with Coomassie Brilliant Blue, respectively. The staining was done after the sample was almost dried. This periodic pattern was formed at 10mg/ml of F-actin in 0.1M KCl, 1mM MgCl2 at room temperature according to method 2, described in Materials and Methods. The directions of polarizer (P) and analyzer (A) in the polarizing micrograph (a) are shown by crossed bipolar arrows. Scale bar, 300 μm.
Figure 10.
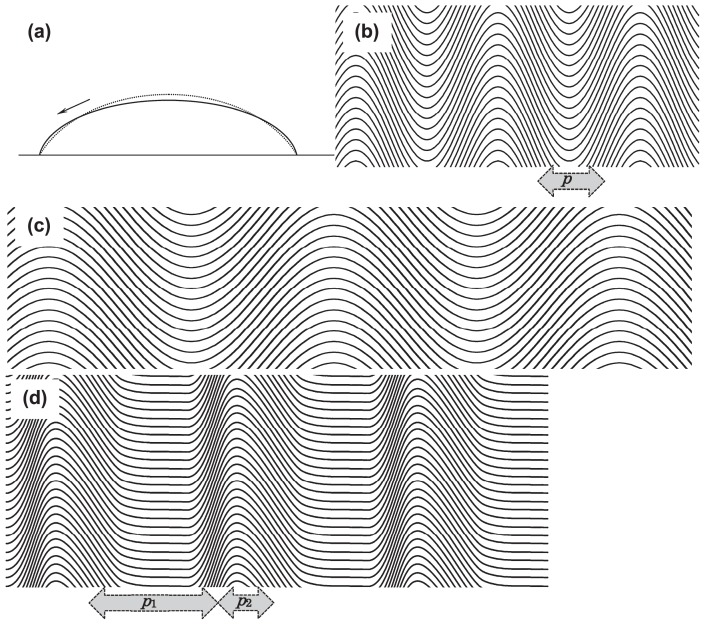
Schematic showing how the striation pattern is formed in F-actin solution during the process of drying. (a) Cross-sectional view of the shape of F-actin solution spread on glass slide surface, showing the direction of flow due to the evaporation of water. The solid curve shows the equilibrium shape of the solution obtained without evaporation of water. Because the evaporation uniformly occurs from the surface, the surface shape deviates from the equilibrium shape, as shown by the dashed curve. This results in the outward flow of solvent in one direction but not in a convectional manner. (b, c), The wavy shape of F-actin bundles and the periodic striation patterns (b) for flexible bundles or in the case of fast drying and (c) for rigid bundles or in the case of slow drying. Solid curves schematically show the F-actin bundles. Vertical dark bands, correspond to the black lines observed in dried samples under the microscope. Here, the shape of the F-actin bundles is assumed to be sinusoidal, so that the period p is uniform. (d) The striation pattern obtained by assuming the asymmetric wavy shape of the F-actin bundles, seems to be more realistic. In the present study, the striation period was defined as the average separation between the adjacent black lines, irrespective of the repetitive long (p1) and short (p2) periods. For more details, see the text.
Effects of temperature
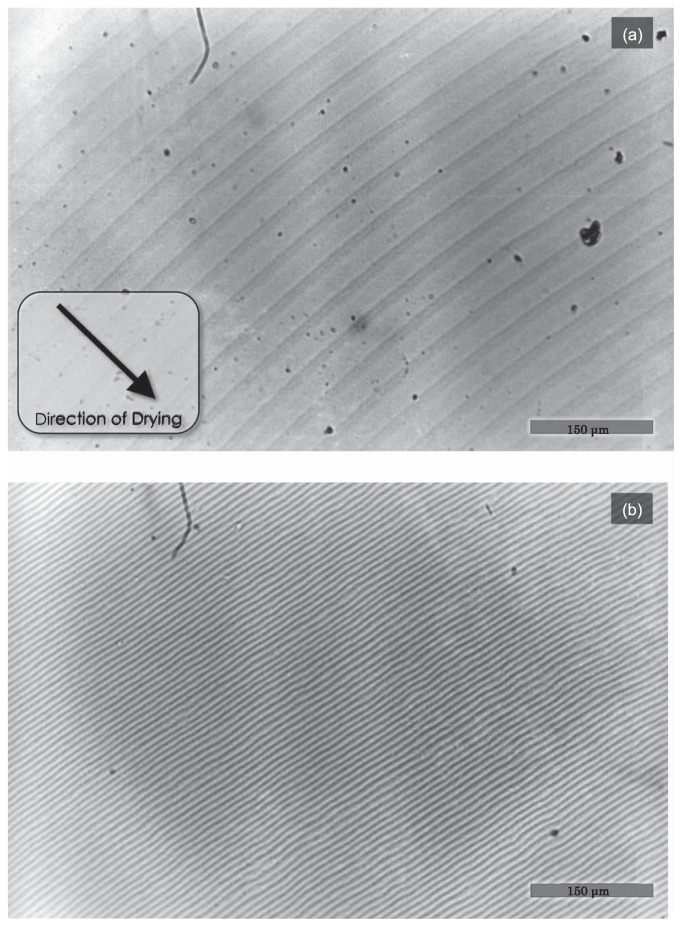
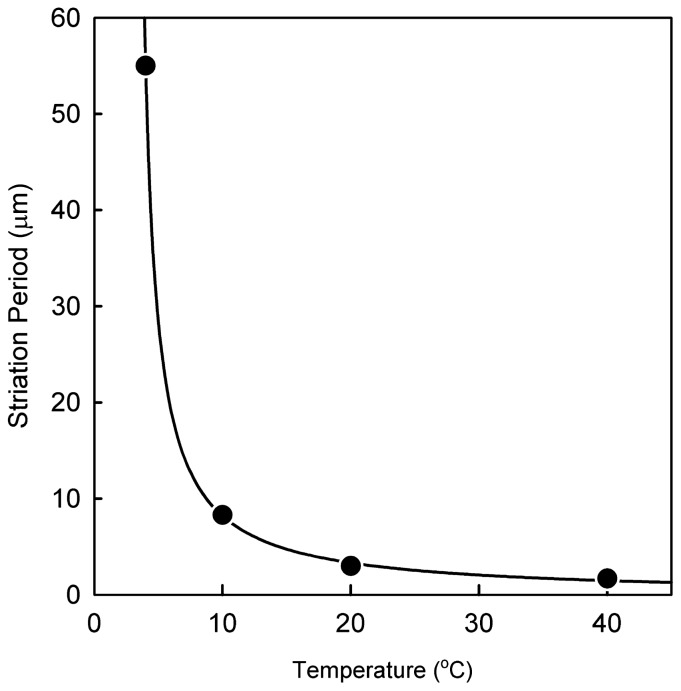
When the drying temperature was increased from 4 to 40°C under the condition of natural drying, the striation period largely decreased monotonically from about 50 μm (at 4°C, Fig. 3a) to 8 μm (at 10°C, Fig. 3b). The temperature dependence of the striation period is summarized in Figure 4. The relationship between the striation period (p) and the temperature (T) was expressed by p = p0 + α/(T − T0), where α, p0 and T0 are, respectively, set to be 58.7 μm°C, 0.11 μm and 3.9°C. This relationship is equivalent to that obtained for a cholesteric liquid crystal12. On lowering the temperature, the drying speed was markedly slowed, so that it became difficult to form the clear striation pattern; in practice, the drying did not occur at lower than 1°C under the drying conditions used in the present study.
Figure 3.
Difference of the striation pattern formed by drying at different temperatures. Concentric circular textures formed at 4°C (a) and 10°C (b) were observed by phase-contrast microscope. An F-actin solution was the same as in Figure 1. Scale bars, 150 μm.
Figure 4.
Relationship between striation period and the temperature at which samples were dried. F-actin solution was dried under the same conditions as in Figure 1 on the glass slide which was mounted on the temperature-controlled brass block. The temperature of the block was plotted on the abscissa. Striation period (p) was inversely proportional to temperature (T) as shown by the solid curve p = 0.11 + 58.7/(T − 3.9).
Effects of F-actin concentration
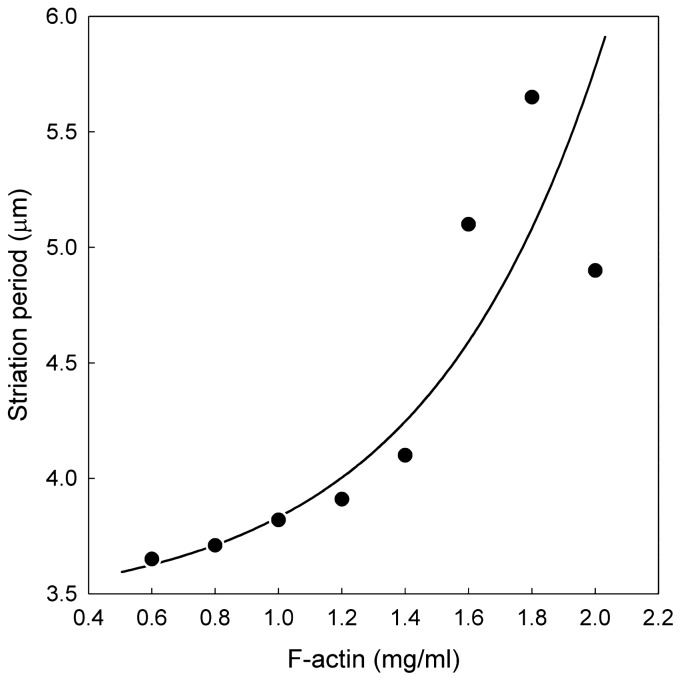
The effects of the F-actin concentration on the striation period were examined between 0.4 and 2mg/ml under the condition of natural drying at 25°C. The result is summarized in Figure 5, in which monotonic increase in the striation period with the increase in the F-actin concentration is seen. We confirmed that no striation was formed at F-actin concentrations of lower than 0.4mg/ml at room temperature, implying that there is a critical actin concentration for the formation of periodic texture.
Figure 5.
Relationship between striation period and F-actin concentrations. Various concentrations of F-actin solutions were dried under the same condition as in Figure 1 on the glass slide which was mounted on the temperature-controlled brass block at 25°C. The striation period increased in accordance with the increase in the concentration of F-actin. No striation was formed at the F-actin concentration lower than 0.4mg/ml.
Dependence on the speed of drying
The effects of drying speed on the striation period were examined under the same conditions as in Figure 1 (1.0mg/ml F-actin) except under various drying speeds (speeds of movement of the boundary between the wet and the dried parts) over the range from 1.0 to 9.0mm/h at 25°C by roughly controlling the humidity in the box (data not shown). The striation period tended to decrease from about 5 to 2.5 μm on increasing the drying rate; but it was maintained nearly constant (about 2.5 μm) at higher than 5mm/h.
Pattern formation in the process of drying
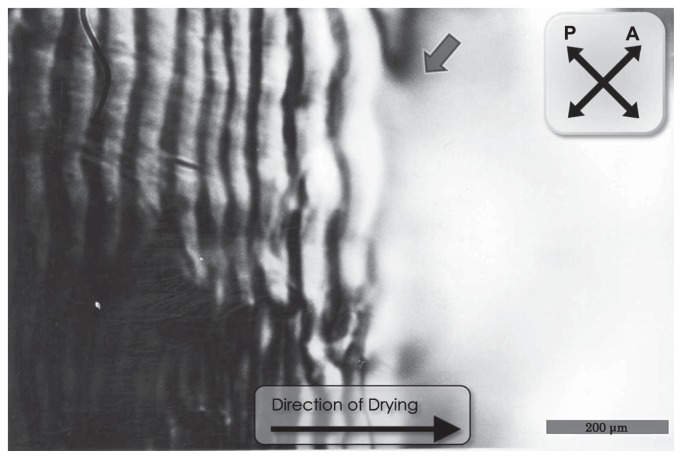
Next we observed the pattern formation at the boundary between the wet and dry regions under a polarizing microscope. Figure 6 demonstrates that the striation pattern formed in the dried portion extends to the wet region, implying that the striation pattern begins to be formed in solution before drying. It is to be noted that the region where the striation pattern is observed is limited near the boundary region (about 10 μm wide), but no type of domain structure was observed within a region away from this boundary region.
Figure 6.
Polarizing micrograph showing the wet part of sample in the process of drying. Two mg/ml of F-actin was dried under the same condition as in Figure 1. The directions of polarizer (P) and analyzer (A) are shown by crossed bipolar arrows. The edge of the wet region is indicated by an arrow. Scale bar, 200 μm.
Two-dimensional striation pattern obtained by incubation without drying
Finally, we examined whether the periodic pattern is obtained without drying by incubating a high concentration of F-actin (corresponding to method 2 described in Materials and Methods). A polarizing micrograph (Fig. 7a) showed that a similar striation pattern (a wavy bundle of actin filaments having large positive birefringence) was formed even in the solution with an F-actin concentration as high as 10 mg/ml. This was confirmed by Coomassie Brilliant Blue staining (Fig. 7b).
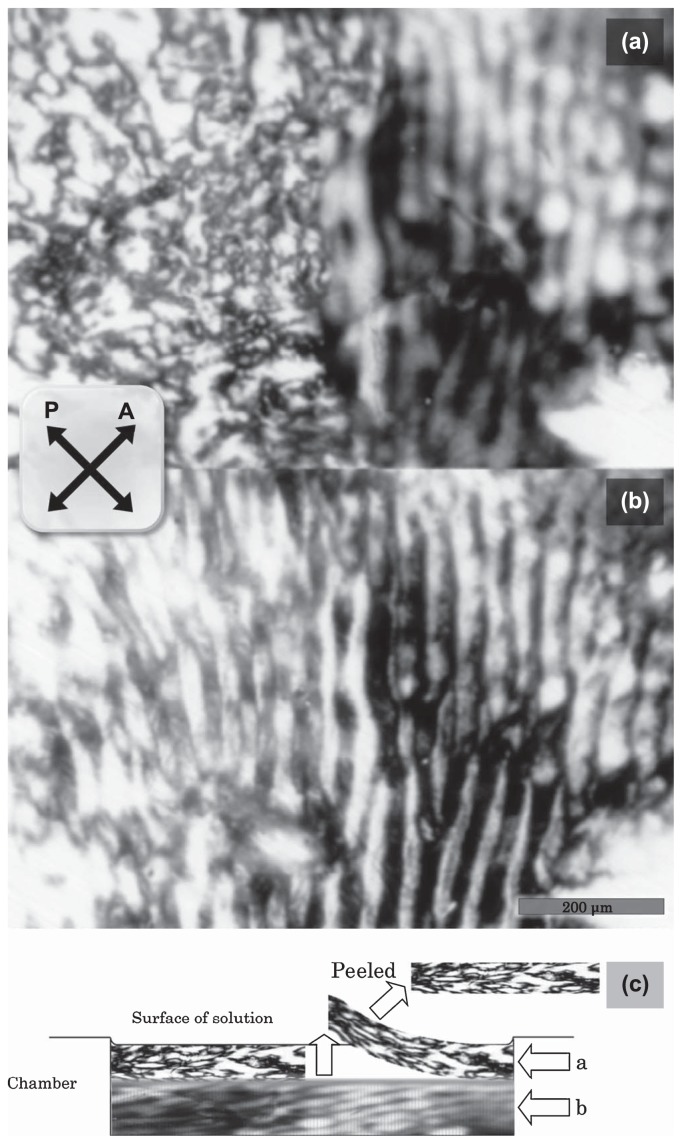
As the striation patterns were formed before the solution was completely dried, it was expected that some similar patterns would also be formed even in the concentrated state of F-actin in solution. In order to confirm this inference, we incubated the concentrated solution of F-actin in the open air at more than 10mg/ml inside a cylindrical well under a polarized microscope. As the solute water evaporated from the open-top of the well, patch-work domains appeared in the sample, which coincided with the pattern reported by Coppin and Leavis (2). The polarized light intensity from the domain structure was so strong that all actin filaments were assumed to be recruited to the domain-structure formation. However, the situation was found to be more complicated. The top surface of the sample was found to be rigid and formed a film-like structure. When this film was peeled off using a glass needle, striation patterns appeared beneath the film, which were essentially the same as that observed before during the evaporating process.
Figure 8 shows the polarizing micrographs of the F-actin solution (10mg/ml), of which the film-like structure was partly peeled in the right area of Figure 8a and b. Figure 8a focuses on the top of the sample where the film-like structure was formed, and in Figure 8b the focus was set at about mid-depth of the sample where the striation patterns were observed. Figure 8c schematically illustrates the side view of this sample.
Figure 8.
Polarizing micrographs obtained from two different focal planes (a and b) of the sample prepared according to method 2 in a cylindrical chamber and the schematic representation of the sample well and the focal planes (c). (a) Photo taken at the focus near the surface and (b) photo taken at the near-central depth of the solution. The left part of each micrograph was covered with surface structure of the sample and the right part was focused of the area beneath them as revealed by peeling away the dried surface using tweezers, where the striation pattern was observed. Scale bar, 200 μm. The schematic illustration (c) represents the location of the edge of the peeled surface structure and the focal plane taken for panels (a) and (b).
Two-dimensional patterns obtained by drying of BSA and tropomyosin solutions
For the purpose of comparison, we examined the pattern formation of BSA (as a typical example of globular proteins) and tropomyosin (as a typical example of rod-like proteins, about 40 nm long) by drying in a similar manner as method 1 for F-actin. In the case of BSA solution, the evaporation of solution occurred evenly (not from the periphery), so that drying occurred rather sporadically and no regular pattern was formed (Fig. 9a). On the other hand, in the case of tropomyosin solution, only MgCl2 was added as a salt because it was expected that Mg-paracrystals of tropomyosin were formed within a limited range of Mg2+ concentrations from 10 to several tens mM19–21, so that the increase in the ionic strength might be visualized by the paracrystal formation. As shown in Figure 9b and c, a circular birefringent ring about 200 μm in width appeared as a result of evaporation of the solvent from the periphery. The fact that the ring was birefringent and appeared in the middle of dried circle strongly suggests that the ring is composed of Mg-paracrystals of tropomyosin, which are formed within a limited range of Mg concentrations (the concentration range depends on tropomyosin concentration, pH and so on.).
Discussion
Branched salt crystals formed along meandering F-actin bundles
As observed in Figure 2, branched salt crystals were formed in the space between meandering F-actin bundles. The nucleus formation (crystallization) of branched crystals may have started at the microscopic region where the salt concentration was supersaturated by gradual evaporation of water from the periphery and the crystals grew along the wavy shape of F-actin bundles. This is likely attributable to the increase in the salt concentrations in the aqueous area created between F-actin bundles.
The reason for large temperature dependence of striation period
As the temperature increases, the evaporation rate must increase due to the higher saturation pressure of vapor. In addition, we noticed that the direction of the solution flow was from the center to the periphery of the sample for both F-actin and tropomyosin solutions but not for BSA solution. In addition, the rate of flow became larger as temperature was increased, which is likely to be attributable to a higher evaporation rate. Based on these results, we suggest that the shorter striation period at higher temperatures (Figs. 3 & 4) is due to the higher flow rate, which produces a larger shear force, so that the acute buckling of F-actin bundles occurs.
The dependence of the striation period on actin concentrations
The striation period in the F-actin solution was longer at higher actin concentrations (Fig. 5). Also, it is interesting to note that there is a critical concentration of actin below which the striation pattern is not formed. This suggests that the condensation (bundling) of actin filaments starts to occur at the periphery of the evaporating sample, where the actin concentration is above the critical value. As the condensation of actin bundles proceeds, the meandering of the bundle occurs, likely due to the shear force produced by the flow of solution spreading outwards. As the actin concentration is higher, the actin bundles seem to become thicker, i.e., stiffer, which results in the longer period of the striation pattern; this is because the degree of buckling will be determined by the competition of forces between the shear flow and the stiffness of the F-actin bundles.
The mechanism of formation of striated texture under the present conditions
Several driving forces, such as capillary forces, surface tension and solvent flow, may be involved in the pattern formation. Here we focus on the solvent flow and propose the following mechanism for the formation of the striation pattern obtained during the process of drying: When the sample is dropped onto the glass surface, the sample solution spreads out in a circular shape with the upper surface convex upward (Fig. 10a). The evaporation occurs from the upper surface maintaining a certain contact angle at its surrounding periphery. If evaporation occurs in proportion to the surface area, the evaporation rate per unit area of the circular-shaped base of the sample must be higher at the periphery than at the center (Fig. 10a), such that the depth of the sample at the periphery would be lower than its stable level. This will result in a continuous compensatory flow of solution from the center to the periphery throughout the evaporation process (Fig. 10a). We confirmed this solution flow under the microscope by observing the movement of dust particles added to the sample. This flow would cause the shear force to align F-actin within the solution, which would induce spontaneous orientation of the filaments. The condensation process causing bundling of the filaments occurs because of the alignment of the filaments coupled with the concentration and dehydration due to the evaporation of water. The meandering of bundles would be carried by the force balance between the shear force caused by solution flow and the bending stiffness of the F-actin bundles (see ref. 9 on the bending stiffness of F-actin under various conditions). As a result, meandering bundles arranged in parallel should make a periodic streaking pattern in the perpendicular direction as shown in Figure 10b–d. Thus, thick and stiff bundles formed in a concentrated F-actin solution should configure a long striation period, and fast and strong shear flow should make a short period. As mentioned in the above paragraphs, this mechanism can well explain the dependency on both temperature and the actin concentration in a qualitative manner.
The meandering phase of bundles would be concurrent within some regions, which coincided with the observation that the striation pattern was uniform for a wide range, i.e., in a mm-order. Stochastically, the concurrence sometimes mismatches and dislocation-like branches of striation patterns occur, as observed at the lower left of Figure 2c and as shown with a circle in Figure 7.
It is to be noted that the striation period defined in the present study is always one-half of the period of dendritic salt crystals (see Fig. 2c–e). This is understandable according to the schematic illustrations shown in Figure 10b and c, where the salt dendrites are grown in the space between the wavy F-actin bundles. However, note that the striation period was not always uniform as suggested by the schematics in Figure 10b and c, where the shape of each bundle is assumed to be sinusoidal. But in practice, sometimes it appeared as a repetition of short and long periods (cf. Fig. 2d, e). This is probably because the wavy shape of buckled bundles of F-actin is not necessarily sinusoidal but rather asymmetrical, as schematically shown in Figure 10d.
Because the condensation process of F-actin bundles proceeds to the over-all evaporation process, the striation pattern tends to be formed from the periphery to the center. As the evaporation proceeds, the concentrations of salts, KCl and/or MgCl2, increase and sometimes form dendrite salt crystals along the bundles. Finally, the large crystals of KCl/MgCl2 salts are formed at the center of the sample.
Acknowledgements
We would like to thank Mr. Y. Shinozaki and Mrs. C. Kaku of Nagaoka University of Technology for their technical assistance, and Dr. K. Hatori of Yamagata University and Dr. K. Matsuno of Nagaoka University of Technology for their helpful discussions.
References
- 1.Oosawa F, Asakura S. Thermodynamics of the Polymerization of Protein. Academic Press; London: 1975. [Google Scholar]
- 2.Coppin CM, Leavis PC. Quantitation of liquid-crystalline ordering in F-actin solutions. Biophys J. 1992;63:794–787. doi: 10.1016/S0006-3495(92)81647-8. [DOI] [PMC free article] [PubMed] [Google Scholar]
- 3.Newman J, Mroczka N, Schick KL. The spontaneous formation of long-range order in actin polymer networks. Macromolecules. 1989;22:1006–1008. [Google Scholar]
- 4.Suzuki A, Maeda T, Ito T. Formation of liquid crystalline phase of actin filament solutions and its dependence on filament length as studied by optical birefringence. Biophys J. 1991;59:25–30. doi: 10.1016/S0006-3495(91)82194-4. [DOI] [PMC free article] [PubMed] [Google Scholar]
- 5.Fujime S, Maeda T, Ishiwata S. In: Biomedical Application of Laser Light Scattering. Sattelle DB, Lee WI, Ware BR, editors. Elsevier Biomed. Press; Amsterdam: 1983. p. 251. [Google Scholar]
- 6.Kerst A, Chmielewski C, Livesay C, Buxbaum RE, Heidemann SR. Liquid crystal domains and thixotropy of filamentous actin suspensions. Proc Natl Acad Sci USA. 1990;87:4241–4245. doi: 10.1073/pnas.87.11.4241. [DOI] [PMC free article] [PubMed] [Google Scholar]
- 7.de Gennes PG, Prost J. The Physics of Liquid Crystal. second edition. Oxford University Press; 1995. [Google Scholar]
- 8.Pincus P. Excluded volume effects and stretched polymer chains. Macromolecules. 1976;9:386–388. [Google Scholar]
- 9.Ishiwata S. Doctoral Thesis. Nagoya University; 1975. Study on muscle and muscle proteins — principally, dynamic properties of actin filament studied by quasielastic scattering of laser light. [Google Scholar]
- 10.Fratzl P, Daxer A. Structural transformation of collagen fibrils in corneal stroma during drying. An x-ray scattering study. Biophys J. 1993;64:1210–1214. doi: 10.1016/S0006-3495(93)81487-5. [DOI] [PMC free article] [PubMed] [Google Scholar]
- 11.Hayashi S, Kumamoto Y, Suzuki T, Hirai T. Imaging by polystyrene latex particles. J Colloid Interface Sci. 1991;144:538–547. [Google Scholar]
- 12.Dushkin CD, Yoshimura H, Nagayama K. Nucleation and growth of two-dimensional colloidal crystals. Chem Phys Lett. 1993;204:455–460. [Google Scholar]
- 13.Denkov ND, Velev OD, Kralchevsky PA, Ivanov IB, Yoshimura H, Nagayama K. Two-dimensional crystallization. Nature. 1993;361:26. [Google Scholar]
- 14.Whitesides GM, Mathias JP, Seto CT. Molecular selfassembly and nanochemistry: a chemical strategy for the synthesis of nanostructures. Science. 1991;254:1312–1319. doi: 10.1126/science.1962191. [DOI] [PubMed] [Google Scholar]
- 15.Kondo H, Ishiwata S. Uni-directional growth of F-actin. J Biochem. 1976;79:159–171. doi: 10.1093/oxfordjournals.jbchem.a131043. [DOI] [PubMed] [Google Scholar]
- 16.Mihashi K. Molecular characteristics of G-ADP actin. Arch Biochem Biophys. 1964;107:441–448. doi: 10.1016/0003-9861(64)90300-5. [DOI] [PubMed] [Google Scholar]
- 17.Higashi S, Ooi T. Crystals of tropomyosin and native tropomyosin. J Mol Biol. 1968;34:699–701. doi: 10.1016/0022-2836(68)90190-3. [DOI] [PubMed] [Google Scholar]
- 18.Ebashi S, Kodama A, Ebashi F. Troponin: 1. Preparation and physiological function. J Biochem. 1968;64:465–477. doi: 10.1093/oxfordjournals.jbchem.a128918. [DOI] [PubMed] [Google Scholar]
- 19.Cohen C, Longley W. Tropomyosin paracrystals formed by divalent cations. Science. 1966;152:794–796. doi: 10.1126/science.152.3723.794. [DOI] [PubMed] [Google Scholar]
- 20.Ohtsuki I. Localization of troponin in thin filament and tropomyosin paracrystal. J Biochem. 1974;75:753–765. doi: 10.1093/oxfordjournals.jbchem.a130448. [DOI] [PubMed] [Google Scholar]
- 21.Ishii Y, Lehrer SS. Mg2+-paracrystal formation of tropomyosin as a condensation phenomenon. Effects of pH, salt, temperature, and troponin binding. Biophys J. 1989;56:107–114. doi: 10.1016/S0006-3495(89)82655-4. [DOI] [PMC free article] [PubMed] [Google Scholar]


