Abstract
Objective:
We propose the application of virtual nodules to evaluate the performance of computer-aided detection (CAD) of lung nodules in cancer screening using low-dose CT.
Methods:
The virtual nodules were generated based on the spatial resolution measured for a CT system used in an institution providing cancer screening and were fused into clinical lung images obtained at that institution, allowing site specificity. First, we validated virtual nodules as an alternative to artificial nodules inserted into a phantom. In addition, we compared the results of CAD analysis between the real nodules (n = 6) and the corresponding virtual nodules. Subsequently, virtual nodules of various sizes and contrasts between nodule density and background density (ΔCT) were inserted into clinical images (n = 10) and submitted for CAD analysis.
Results:
In the validation study, 46 of 48 virtual nodules had the same CAD results as artificial nodules (kappa coefficient = 0.913). Real nodules and the corresponding virtual nodules showed the same CAD results. The detection limits of the tested CAD system were determined in terms of size and density of peripheral lung nodules; we demonstrated that a nodule with a 5-mm diameter was detected when the nodule had a ΔCT > 220 HU.
Conclusion:
Virtual nodules are effective in evaluating CAD performance using site-specific scan/reconstruction conditions.
Advances in knowledge:
Virtual nodules can be an effective means of evaluating site-specific CAD performance. The methodology for guiding the detection limit for nodule size/density might be a useful evaluation strategy.
INTRODUCTION
Screening by low-dose CT has been shown to reduce mortality from lung cancer in high-risk individuals.1 Computer-aided detection (CAD) systems are increasingly being used to assist radiologists in the detection of lung nodules. Performance evaluations of CAD systems for the detection of lung nodules have been carried out using clinical images including actual nodules.2–4 When a CAD system is introduced in an institution providing CT screening, its performance should be evaluated by image data obtained under the same scan and image reconstruction conditions as those used at that site, because of the dependence of CAD performance on scan/reconstruction conditions.5–7 However, it would be difficult for end users of a CAD system to archive a large database of CT screenings with sufficient numbers of nodules at each screening site. Public image databases are available,8 but such images are usually obtained under a limited range of scan/reconstruction conditions, which are not always equivalent across institutions. One way to overcome this limitation is with the use of a lung phantom containing artificial nodules.9,10 Images of the phantom acquired with the same scan/reconstruction parameters as those used for screening are then subjected to CAD. This approach is effective for assessing site-specific CAD performance. Another method is the use of virtual (computer-simulated) nodules.11,12 As virtual nodules can be fused into the clinical images obtained in each institution, this approach can also lead to the evaluation of site-specific CAD performance. However, virtual nodules are obtained by arbitrarily selected modelling and filtering such that the resultant nodules appear to be similar to real nodules (i.e. they do not accurately depend on the characteristics of the spatial resolution in the CT system). This is a large disadvantage of virtual nodules compared with artificial nodules.
Another approach to generating nodules has been reported.13–15 In this method, virtual nodules are computed with a dependence on the spatial resolution characteristics measured for each CT system, which, in turn, are based on the image-generating system itself. Therefore, this method is the most appropriate computational technique for nodule generation. We have explored the feasibility of using this method to assess CAD performance; in this study, the virtual nodules were suggested to be useful for generating free-response receiver-operating characteristic curves for a CAD system.16 However, in this preliminary study, the validity of the use of virtual nodules as an alternative to artificial nodules included in a lung phantom was not verified. A comparative study between virtual and artificial nodules is necessary. In addition, the use of virtual nodules has the potential advantage of being suitable for assessing the dependence of CAD performance on nodule size and density. This is because of the predetermined (known) size and density of the nodules. When using real nodules in CT images obtained from patients, the true values of the size and density of the nodules are not known. Real nodules have heterogeneous densities and various complicated shapes; therefore, it is difficult to measure their size and density accurately. By using virtual nodules, we are able to clarify the detection limit of the CAD system in terms of nodule size and density. This might lead to a useful evaluation strategy of CAD performance.
In this study, we first validated the application of virtual nodules13–16 regarding their use for the evaluation of CAD performance in place of artificial nodules included in a lung phantom. Next, as a further validation study, virtual nodules were made to appear to be comparable with real nodules with regard to size and density and were applied to the detection test of the CAD system. Finally, we demonstrated the detection limit of the CAD system in terms of nodule size and density.
METHODS AND MATERIALS
Virtual nodules
We assume that CT image blurring is described by a two-dimensional (2D) point spread function (PSF) in the x–y scan plane and a slice sensitivity profile (SSP) in the z direction perpendicular to the scan plane.13,17,18 The three-dimensional CT image I(x,y,z) is expressed as
| (1) |
where O(x,y,z) is the object function and PSF(x,y) and SSP(z) are the 2D PSF and SSP, respectively. The operators * and ** are one-dimensional and 2D convolutions, respectively. The image simulation based on Equation (1) has been used widely and its validity has been verified.13–15
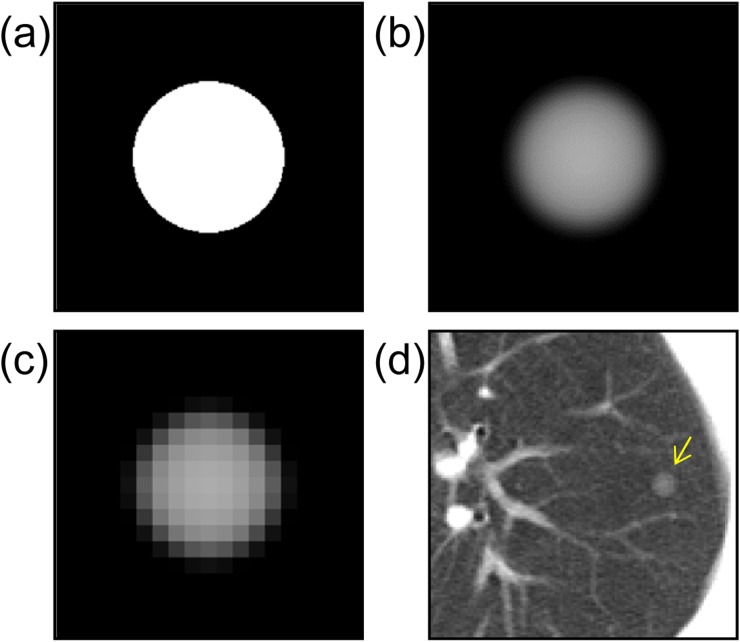
The PSF and SSP are measured in a CT scanner. Object functions are generated numerically as ideal spheres with uniform density on the assumption of typical solitary pulmonary nodules (Figure 1a). The image I(x,y,z) is calculated from Equation (1) (Figure 1b). Subsequently, the computer-simulated nodule is resampled in three dimensions with intervals equal to the pixel size and slice interval found in clinical CT images (Figure 1c).19 The resultant image is a virtual nodule that can be fused into practical images by the process shown in Figure 1d and can be used for clinical evaluation.19,20 In image fusion, the nodule is added into multiple slices to cover the whole virtual nodule in the z direction (only the centre slice is shown in Figure 1d).
Figure 1.
A schematic explanation of virtual nodule generation: (a) the object function of a typical solitary pulmonary nodule with a diameter of 6 mm; (b) a computer-simulated nodule obtained from the object function by Equation (1); (c) a virtual nodule generated by resampling the previous image (b) in three dimensions at clinical CT image resolution; (d) a virtual nodule added to the clinical CT image (arrow).
Validation using artificial nodules in a phantom
Phantom and measurements of point spread function and slice sensitivity profile
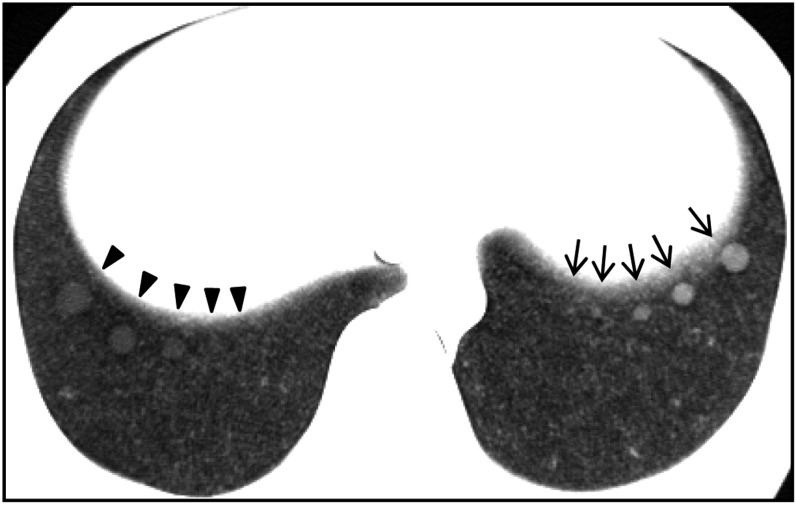
We used a commercially available anthropomorphic chest phantom (LSCT001; Kyoto Kagaku Co. Ltd, Kyoto, Japan) (Figure 2). CT images of this phantom are considered to be similar to actual CT images obtained in clinical examinations.21 The artificial nodules included in the phantom were placed at three levels: the lung apex, the tracheal bifurcation and the lung base. In each slice level, there were artificial nodules with a high density of −630 HU in the left lung and with a low density of −800 HU in the right lung.21 The background density was −900 HU; then, the contrast between nodule density and background density (ΔCT) was 270 HU for high-contrast nodules and 100 HU for low-contrast nodules. The example image shown in Figure 2 is of the lung base. In this study, we used four high-contrast nodules with diameters of 4 mm, 6 mm, 8 mm and 10 mm and four low-contrast nodules with diameters of 6 mm, 8 mm, 10 mm and 12 mm.
Figure 2.
An image of a chest phantom including artificial nodules: there are five high-contrast nodules in the left lung with diameters of 2 mm, 4 mm, 6 mm, 8 mm and 10 mm (arrows) and five low-contrast nodules in the right lung with diameters of 12 mm, 10 mm, 8 mm, 6 mm and 4 mm (arrowheads). The high-contrast 2-mm nodule and the low-contrast 4-mm nodule were not used in this study because of the difficulty in identifying them in this image.
A four-detector row CT scanner (Asteion; Toshiba Medical Systems, Tokyo, Japan) was used for the validation study. The PSF and SSP were measured for the FC50 (for standard lung imaging) kernel and for slice thickness of 8 mm, respectively. The PSF was determined by scanning a high-contrast CT test phantom (MHT-type; Kyoto Kagaku Co. Ltd, Kyoto, Japan); this method includes a means of verifying the obtained PSF and is therefore considered to give accurate values.22,23 The SSP was measured with the use of a Gold Disk Delta phantom (Kyoto Kagaku Co. Ltd), comprising a gold disc 50-μm thick and 1.0 mm in diameter placed in a tissue-equivalent material (acrylic).
Comparison of virtual nodules with artificial nodules
The lung phantom was scanned at 30 mA, 120 kV, 4 × 5 mm collimation, 0.75 s/rotation and pitch factor of 1.375. A targeted image reconstruction was performed using a field of view (FOV) of 60 mm, slice thickness of 8.0 mm, FC50 reconstruction kernel and matrix size of 512 × 512. We used the image through the middle of the artificial nodules at the slice level of the lung base (Figure 2).
The object functions were generated as ideal spheres whose size and ΔCT corresponded to those of eight artificial nodules at the slice level of the lung base. The virtual nodules obtained from the object functions were compared with the images of the corresponding artificial nodules, and the image differences were quantified by the standard deviation (SD) on the subtracted image.
Comparison of computer-aided detection system detections for virtual nodules and artificial nodules
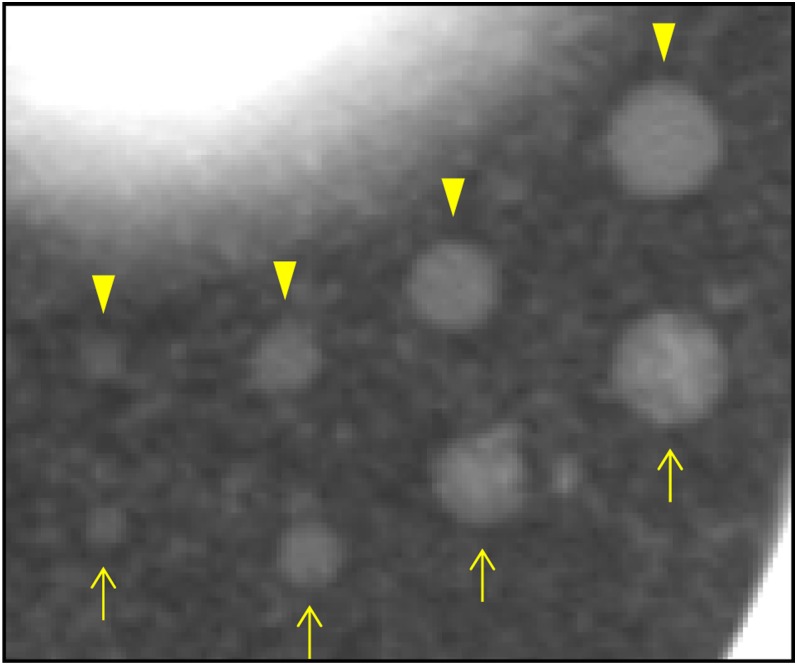
The lung phantom was scanned and reconstructed with tube currents of 30 mA and 200 mA, a slice thickness of 8.0 mm with an interval of 8.0 mm and an FOV of 320 mm (other conditions were the same as described in the above section). The two tube currents corresponded to different CT scanning conditions and the 320-mm FOV was chosen to mimic a clinical setting for CT screening and CAD analysis. The computer-simulated nodules were generated from object functions having the same size/density as the artificial nodules, as illustrated in Figure 1a,b. The virtual nodules were obtained by resampling the computer-simulated nodules (Figure 1c). The virtual nodules obtained were superimposed onto the phantom images (Figure 3). We chose 24 artificial nodules in the left and right lungs at the 3 slice levels, and we used 2 kinds of phantom images obtained with tube currents of 30 mA and 200 mA; i.e. a total of 48 nodules were used. The detection test of the CAD system was performed on the 48 artificial nodules and the corresponding virtual nodules. We applied Cohen's kappa coefficient (κ) to assess the agreement in detection results between the artificial nodules and the virtual nodules using the CAD system. The CAD system used for the detection test was a prototype one developed by our research team,24 and its development has continued.
Figure 3.
Virtual nodules added to the phantom image containing artificial nodules: each virtual nodule (arrows) has been placed near the location of the corresponding artificial nodule (arrowheads).
Validation with real nodules
An image database archived at an institution providing low-dose CT screening for lung cancer was used. Ethical board approval to access image data was obtained from the institution. Images were obtained with a four-detector row CT scanner (Asteion; Toshiba Medical Systems). This scanner is different from the one described in the above section. The scan was performed at a setting of 30 mA, 120 kV, 4 × 5 mm collimation, 0.75 s/rotation and pitch factor of 1.375. Image reconstruction was performed with a slice thickness of 8.0 mm at an interval of 8.0 mm, an FC50 reconstruction kernel and an FOV of 280–350 mm. The PSF and SSP were measured on this scanner for the kernel and the slice thickness, respectively.
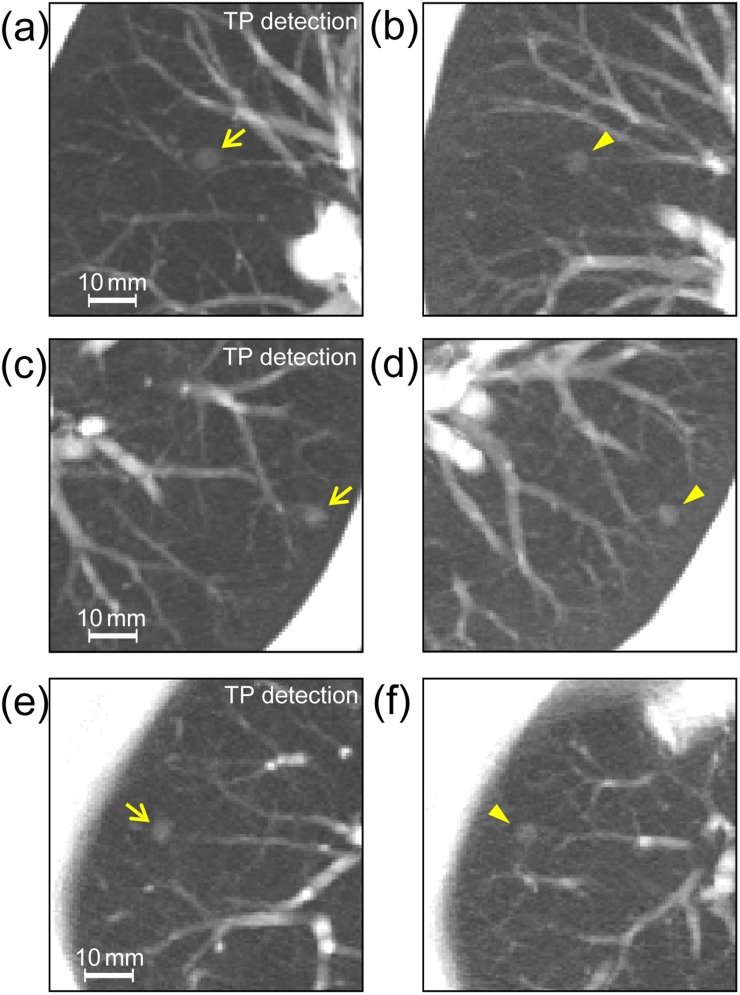
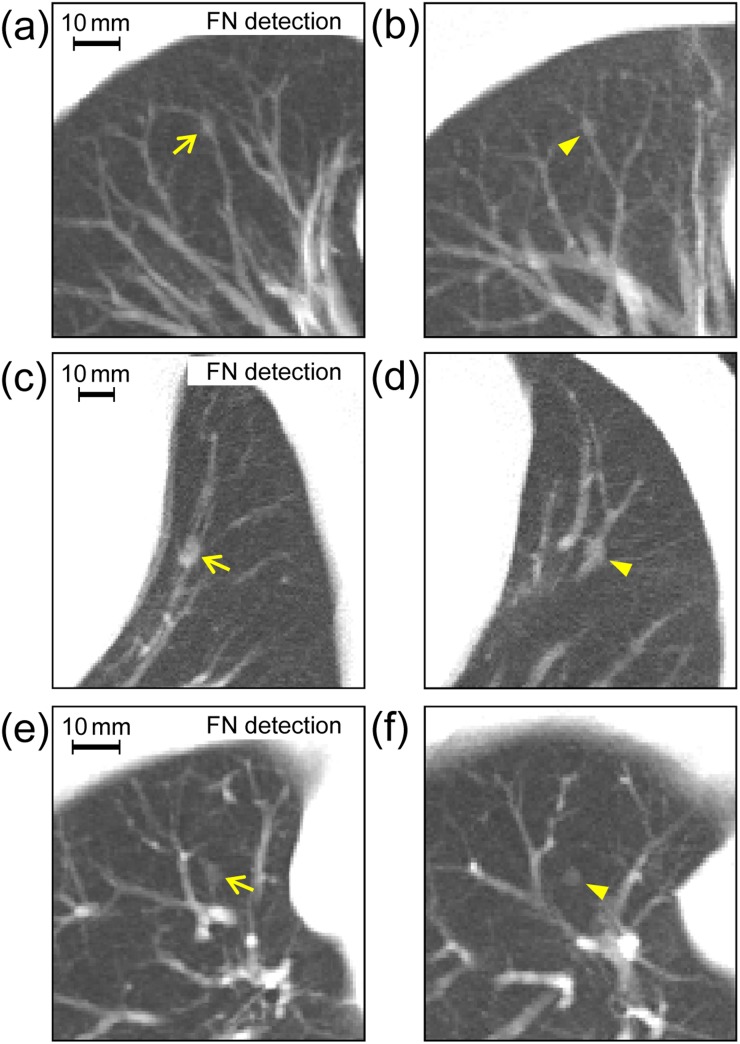
Image data sets in the database were applied to the detection test of the CAD system described above. We chose image data sets of six cases from the database in which a nodular shadow on the image suggested the presence of lung cancer; three of those nodules were detected by the CAD system [i.e. true positive (TP)] (Figure 4) and the others were not detected [i.e. false negative (FN)] (Figure 5). To simulate these nodules, we generated various virtual nodules by changing the diameter and density of the object functions (uniform spheres). Then, we compared the obtained virtual nodules with the real nodules qualitatively in terms of size and density. By visual inspection, we chose virtual nodules that appeared to be most similar to the real nodules overall. Further image data sets of additional cases were selected from the database. In these data sets, the virtual nodules were situated in locations similar to those of the original real nodules with regard to anatomical structures around the nodules, as indicated in Figures 4 and 5. When deciding nodule placement locations, to locate blood vessels existing near nodules, we used maximum intensity projection images generated from three consecutive sections with the virtual nodule in the middle section. The resulting data sets (plus data sets with subtle changes in positions of the virtual nodules in Figure 5) were submitted for analysis by the CAD system.
Figure 4.
Real nodules (arrows) in patient images (a), (c) and (e) are showing computer-aided detection results of true positives (TPs) and corresponding virtual nodules (arrowheads) added into comparable images (b), (d) and (f) of other cases; images were generated using maximum intensity projection of three consecutive sections with the nodule in the centre section. The diameters and contrasts (between nodule density and background density) of object functions used for generating virtual nodules were 6.0 mm and 250 HU (b), 5.5 mm and 350 HU (d) and 5.6 mm and 310 HU (f).
Figure 5.
The analogous comparison of real nodules (left) with corresponding virtual nodules (right) as described in Figure 4, but here with real nodules showing computer-aided detection results of false negatives (FNs): the diameters and contrasts between nodule density and background density of object functions used for generating virtual nodules were 4.5 mm and 360 HU (b), 7.0 mm and 480 HU (d) and 4.3 mm and 320 HU (f).
Application of virtual nodules to computer-aided detection performance evaluation
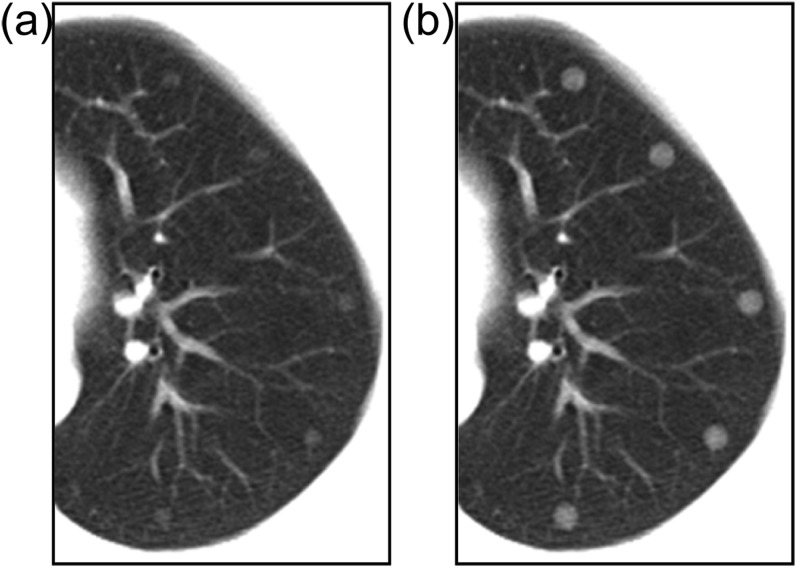
The object functions were generated as typical solitary pulmonary nodules of ideal spheres with diameters of 4.0 mm, 4.5 mm, 5.0 mm, 6.0 mm, 7.0 mm and 8.0 mm, and ΔCT was changed from 100 HU to 800 HU in 100-HU increments.25 A corresponding virtual nodule was obtained from each object function. We used image data sets of 10 cases obtained from the database described in the above section and placed the virtual nodules in the images. Some examples of resultant images are shown in Figure 6. We chose one axial image at the level of the tracheal bifurcation slice in each case, and a virtual nodule obtained with a selected diameter and ΔCT was fused into the image at five locations in the left lung (Figure 6). The three-dimensional virtual nodule occupied multiple 2D slices (only the centre slice is shown in each image in Figure 6). The locations of virtual nodules were selected in the lung periphery so that there was no overlap with large blood vessels, adjacent nodules were sufficiently distant and there was no contact with the lung wall. A total of 48 virtual nodule data sets were obtained per case for the combinations of the 6 diameters and 8 ΔCT values.
Figure 6.
Five virtual nodules have been added to a clinical image at locations in the lung periphery: the object function diameters and contrasts (between nodule density and background density) are (a) 5 mm and 200 HU and (b) 7 mm and 400 HU, respectively.
We performed CAD system detection in all image data sets. When the total number of TP detections for five nodules with a selected diameter and ΔCT was ≥4 (i.e. detection rate ≥80%), the CAD was considered to be able to detect that nodule. In this manner, for all settings of the diameter and ΔCT, we determined the nodule detectability of CAD.
RESULTS
Validation with artificial nodules
Comparison of virtual nodules with artificial nodules
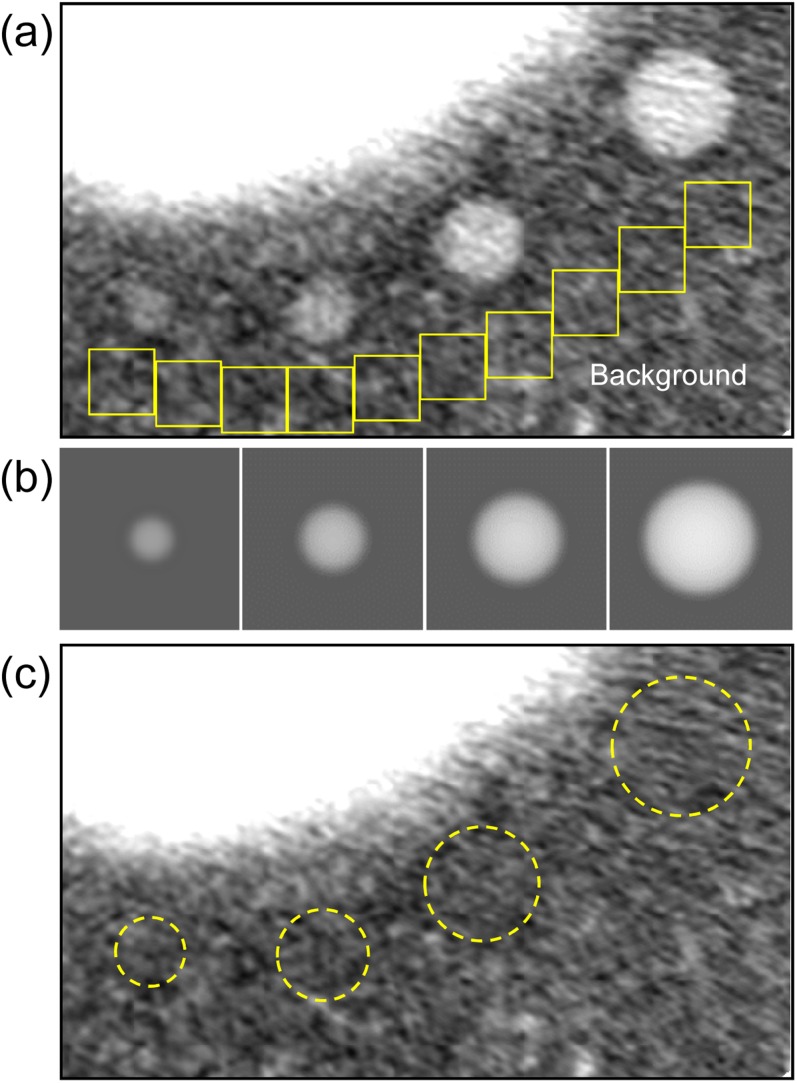
In Figure 7, virtual nodules are compared with the images of high-contrast artificial nodules scanned from the phantom. Subtraction of these images shows little residual intensity around the nodules, except for a component related to noise, artefacts and fine structures in the simulated lung of the phantom (Figure 7c). The equivalent result for low-contrast nodules is obtained (not shown). The SD values measured for high-contrast nodules in the regions of interest on the subtraction image (Figure 7c) are summarized in Table 1, in which these values were averaged. The SD values for the background (measured in the regions of interest indicated in Figure 7a) varied with location in the lung; their mean value is shown in the table. Values were also obtained for low-contrast nodules and summarized in Table 1. The mean values of the SD for high-contrast and low-contrast nodules did not exceed those for the corresponding background.
Figure 7.
A comparison of virtual nodules with the phantom image containing high-contrast artificial nodules: (a) artificial nodules—the regions of interest (ROIs), indicated by boxes, were used to determine a representative standard deviation (SD) of the background intensity; (b) virtual nodules are corresponding to artificial nodules; (c) the image obtained by subtracting each nodule image (b) from (a). The SDs of the subtraction residuals were evaluated in the ROIs indicated by the dashed circles. A narrow window width (400 HU) was used for all images.
Table 1.
Standard deviations (SDs) in the regions of interest (ROIs) on the subtraction image between virtual nodules and artificial nodules, indicated in Figure 7c for high-contrast nodules. SD values measured at various background locations (in the ROIs indicated in Figure 7a) were averaged. These values were also obtained for low-contrast nodules
| Region | SD (HU) |
|
|---|---|---|
| High-contrast nodules | Low-contrast nodules | |
| Nodule | ||
| 12 mm | – | 30.8 |
| 10 mm | 34.4 | 29.6 |
| 8 mm | 28.5 | 26.7 |
| 6 mm | 31.1 | 34.6 |
| 4 mm | 31.9 | – |
| Mean value | 31.5 | 30.5 |
| Background | ||
| Mean value | 33.7 | 32.3 |
HU, Hounsfield units.
Comparison of computer-aided detection system detections for virtual nodules and artificial nodules
The results of CAD system detections for virtual nodules were compared with those for the corresponding artificial nodules. The total numbers of TP and FN detections for all nodules are summarized in Table 2. For 20 virtual nodules detected by CAD, 18 corresponding artificial nodules were detected. For the 28 virtual nodules not detected by CAD, the corresponding artificial nodules were also not detected. 46 of the 48 virtual nodules showed the same TP and FN detections as those for the artificial nodules, indicating near perfect agreement (κ = 0.913).
Table 2.
Number of true-positive (TP) detections and false-negative (FN) detections by the computer-aided detection system for virtual nodules and their corresponding artificial nodules (kappa coefficient = 0.913)
| Virtual nodule | Artificial nodule |
||
|---|---|---|---|
| TP | FN | Total | |
| TP | 18 | 2 | 20 |
| FN | 0 | 28 | 28 |
| Total | 18 | 30 | 48 |
Validation with real nodules
All virtual nodules in Figure 4 were detected by the CAD system, and those in Figure 5 were not detected, indicating the agreement with detection results of corresponding real nodules. For the virtual nodules in Figure 5, the locations of the nodule centres were changed from their initial locations, as shown in Figure 8. When the nodules were repositioned away from the blood vessels (Figure 8a,b), detection results became TP. For the virtual nodules not located close to blood vessels (Figure 8c), changing the location of nodule had no effect on its undetectability (FN).
Figure 8.
Virtual nodules (arrows) not detected by the computer-aided detection (CAD) system: the virtual nodules shown in (a)–(c) are the same as those in Figure 5b,d,f respectively. The locations of the nodule centres were changed from their initial locations to those locations marked with closed triangles “▲” and closed circles “●” in the figure. When nodules were placed on the locations “▲”, they were not detected by the CAD system. When nodules were placed on the locations “●”, they were detected.
Evaluation of computer-aided detection performance by virtual nodules
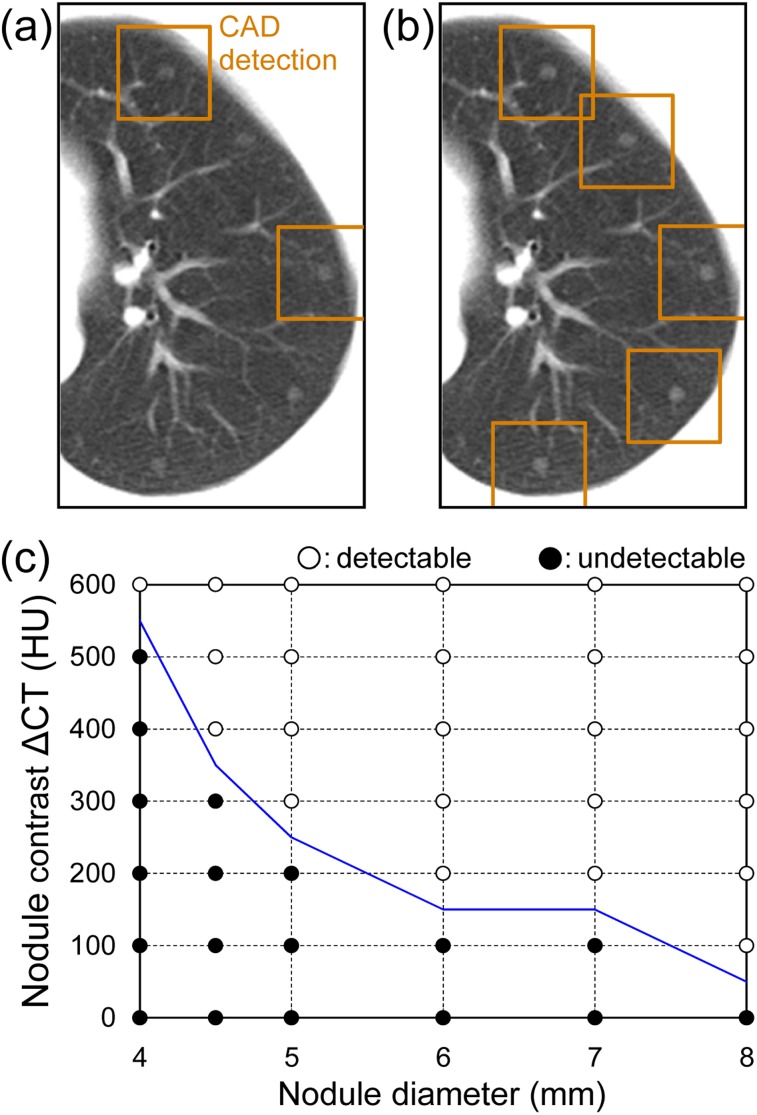
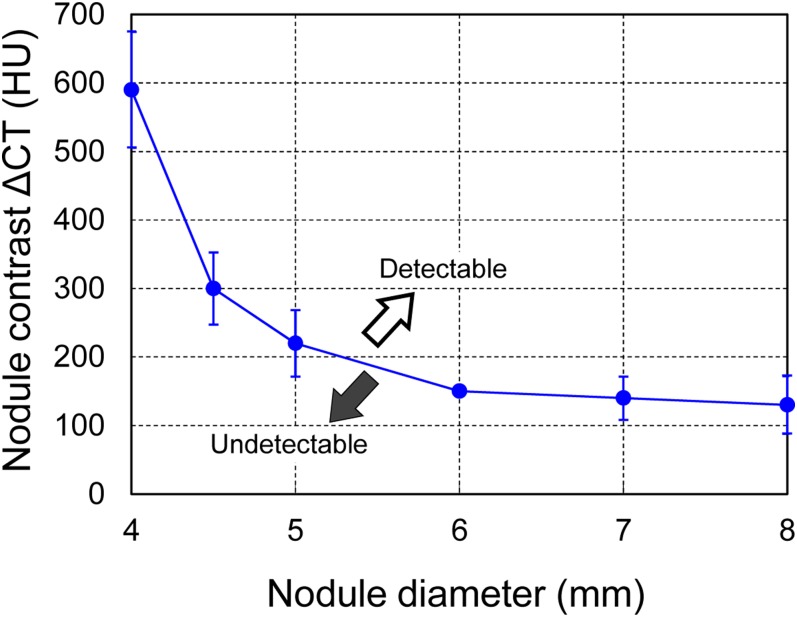
The CAD system detection of virtual nodules in a subject is shown in Figure 9. When the diameter and ΔCT of the object function were set at 5 mm and 200 HU, respectively, only two nodules were detected (Figure 9a). However, when the ΔCT was increased to 300 HU, all five of the virtual nodules were detected (Figure 9b). The summary results for all detections plotted in the diameter–ΔCT space are shown in Figure 9c. The results from Figure 9a,b are denoted as “undetectable” and “detectable” data, respectively, in Figure 9c. When the nodule diameter was increased, the minimum ΔCT required for nodule detection decreased. The solid line delineates the detection limit. The trends were similar for other cases and the overall average detection limit is shown in Figure 10. When the nodule diameter was >5 mm, nodules with a ΔCT more than approximately 220 HU would be detectable with CAD. In addition, the nodule with a diameter of approximately 8 mm was detectable even with a ΔCT as low as approximately 130 HU. For detecting a small nodule 4 mm in diameter, the nodule must have a very high contrast of more than approximately 590 HU. These results for the detection limit in terms of nodule size and density demonstrate the basic performance of the tested CAD system. The mean number of FP detections was 4.8 per case; this value was invariant to the size and density of the virtual nodules.
Figure 9.
Results of computer-aided detection (CAD) system detections of virtual nodules fused into clinical lung images: (a) two of the five virtual nodules were detected (indicated by boxes) when the object function was 5 mm in diameter and the contrast between nodule density and background density was (ΔCT) = 200 HU. (b) All five 5-mm virtual nodules were detected when the contrast was ΔCT = 300 HU. (c) The summary of all detection results with the detection limit is indicated by the solid line. When four or more nodules were detected (i.e. detection rate ≥80%), the data with the corresponding diameter and ΔCT in the figure are marked as “○” (detectable); otherwise, they are marked as “●” (undetectable).
Figure 10.
The detection limit of the computer-aided detection system averaged over all cases (n = 10) (Figure 9c). Error bars are indicating standard deviation. ΔCT, contrast between nodule density and background density.
DISCUSSION
Because CAD performance is affected by scanning and image reconstruction conditions,5–7 performance evaluation should be implemented using the same site-specific conditions used for lung cancer screening. The virtual nodules proposed in this study were generated from the scan/reconstruction conditions of a particular institution and thus, the CAD performance evaluation intrinsically took into account local factors. The detection limit that was determined for our prototype CAD system, in terms of size and density of peripheral lung nodules (Figure 10), served as a practical guide. As it has been reported that follow-up CT is required for nodules of diameter >5 mm,26 the evaluation of different detection limits that depend on site-specific scan/reconstruction conditions is an important step towards the clinical use of CAD systems.
The virtual nodule method was validated by comparing virtual nodule images with images of artificial nodules in a lung phantom (Figure 7 and Table 1). In the detection test of the CAD system, the results for virtual nodules showed good agreement with those for artificial nodules (Table 2). There were only two virtual nodules that showed different results from those of artificial nodules. This is attributed to the conditions of the background (i.e. simulated lung in the phantom) around the artificial nodules, which were different from those around the fused virtual nodules, as seen in Figure 3. Taking this into account, the agreement (κ = 0.913) is highly satisfactory. These results indicate that virtual nodules can be applied to CAD performance evaluation with similar accuracy to artificial nodules. Moreover, virtual nodules avoid the expense of physical manufacture of artificial nodules and can also be deployed in clinical images. For CAD performance evaluation, virtual nodules present a number of advantages over their artificial counterparts.
Virtual nodules, which were generated and situated to be comparable with real nodules (Figures 4 and 5), generated the same CAD results as the real nodules, further elucidating the dependence of CAD performance on nodule location (Figure 8). This also supports the results depicted in Figure 10. The virtual nodule shown in Figure 5b was generated from an object function having a diameter of 4.5 mm and a ΔCT of 360 HU. Although the nodule was judged to be detectable by the CAD system (Figure 10), it was actually not detected. We surmise that the reason was the nodule proximity to (or overlapping with) a blood vessel; this was evidenced by the result that the nodule was detected by moving it away from the blood vessel (Figure 8a). This explanation also applies to the nodule shown in Figures 5d and 8b (diameter of 7.0 mm and ΔCT of 480 HU). Conversely, the virtual nodule shown in Figure 5f was generated from an object function having a diameter of 4.3 mm and a ΔCT of 320 HU. As shown in Figure 10, this nodule was accurately predicted to be undetectable by the CAD system. In this case, the reason for undetectability would be the nodule size and density, not the location; this was evidenced by the result that the nodule remained undetectable after changing its location (Figure 8c). The virtual nodules shown in Figure 4 were accurately predicted to be detectable (Figure 10) as well. Only by using virtual nodules can such detailed analysis about detections by the CAD system be performed. This analysis is not possible when using real nodules.
Our study has some limitations. First, the validation studies were limited by the small number of artificial nodules included in the phantom. And we used only our prototype CAD system throughout our study. A greater number of nodules would be beneficial, as would using additional scan/reconstruction settings and CAD systems. Second, virtual nodules were generated from object functions of ideal spheres with uniform density. For better simulations of real nodules in patients, it is necessary to generate virtual nodules using object functions of heterogeneous density and non-uniform shape. This is theoretically possible, because object functions can be generated numerically with arbitrary shapes and densities. Third, accurate measurement of the spatial resolution in a CT system is essential for generating valid virtual nodules. When scanning a point-source phantom, common methods, such as using a thin wire or a microbead, have known difficulties in obtaining an accurate PSF.27 We submit that the 2D PSF measurement method accompanied by verification,22,23 which was used in the present study, yields sound results for validation.
CONCLUSION
We proposed an application of virtual nodules to evaluate CAD performance using the specific clinical scan/reconstruction conditions of each site. We confirmed that virtual nodules elicited results similar to those of artificial nodules. In addition, the virtual nodules, which were made to be comparable with real nodules, elicited the same CAD results as real nodules, further illustrating the dependence of CAD performance on nodule location. The detection limits of our prototype CAD system were determined in terms of the size and density of peripheral lung nodules; it was demonstrated that a 5-mm nodule was detected when the nodule had a ΔCT > 220 HU. This methodology of guiding the detection limit might be a useful strategy in the evaluation of CAD performance.
FUNDING
This work was supported by JSPS KAKENHI Grant Numbers JP 23602005, 25461803 and 26460722 and a joint study undertaken between Niigata University and Fujitsu Limited.
Contributor Information
Hajime Kobayashi, Email: m08c208g@alumni.niigata-u.ac.jp.
Masaki Ohkubo, Email: mook@clg.niigata-u.ac.jp.
Akihiro Narita, Email: narita@clg.niigata-u.ac.jp.
Janaka C Marasinghe, Email: janakamarasinghe@yahoo.com.
Kohei Murao, Email: murao.kohei@jp.fujitsu.com.
Toru Matsumoto, Email: matsu-ke@kud.biglobe.ne.jp.
Shusuke Sone, Email: gpls357@yahoo.co.jp.
Shinichi Wada, Email: swada@clg.niigata-u.ac.jp.
REFERENCES
- 1.Church TR, Black WC, Aberle DR, Berg CD, Clingan KL, Duan F, et al. ; National Lung Screening Trial Research Team. Results of initial low-dose computed tomographic screening for lung cancer. N Engl J Med 2013; 368: 1980–91. doi: https://doi.org/10.1056/NEJMoa1209120 [DOI] [PMC free article] [PubMed] [Google Scholar]
- 2.Armato SG, 3rd, Roy AS, Macmahon H, Li F, Doi K, Sone S, et al. Evaluation of automated lung nodule detection on low-dose computed tomography scans from a lung cancer screening program. Acad Radiol 2005; 12: 337–46. doi: https://doi.org/10.1016/j.acra.2004.10.061 [DOI] [PubMed] [Google Scholar]
- 3.Zhao Y, de Bock GH, Vliegenthart R, van Klaveren RJ, Wang Y, Bogoni L, et al. Performance of computer-aided detection of pulmonary nodules in low-dose CT: comparison with double reading by nodule volume. Eur Radiol 2012; 22: 2076–84. doi: https://doi.org/10.1007/s00330-012-2437-y [DOI] [PMC free article] [PubMed] [Google Scholar]
- 4.Zinovev D, Duo Y, Raicu DS, Furst J, Armato SG. Consensus versus disagreement in imaging research: a case study using the LIDC database. J Digit Imaging 2012; 25: 423–36. doi: https://doi.org/10.1007/s10278-011-9445-3 [DOI] [PMC free article] [PubMed] [Google Scholar]
- 5.Godoy MC, Kim TJ, White CS, Bogoni L, de Groot P, Florin C, et al. Benefit of computer-aided detection analysis for the detection of subsolid and solid lung nodules on thin- and thick-section CT. AJR Am J Roentgenol 2013; 200: 74–83. doi: https://doi.org/10.2214/AJR.11.7532 [DOI] [PubMed] [Google Scholar]
- 6.Hwang J, Chung MJ, Bae Y, Shin KM, Jeong SY, Lee KS. Computer-aided detection of lung nodules: influence of the image reconstruction kernel for computer-aided detection performance. J Comput Assist Tomogr 2010; 34: 31–4. doi: https://doi.org/10.1097/rct.0b013e3181b5c630 [DOI] [PubMed] [Google Scholar]
- 7.White CS, Pugatch R, Koonce T, Rust SW, Dharaiya E. Lung nodule CAD software as a second reader: a multicenter study. Acad Radiol 2008; 15: 326–33. doi: https://doi.org/10.1016/j.acra.2007.09.027 [DOI] [PubMed] [Google Scholar]
- 8.Armato SG, 3rd, McLennan G, Bidaut L, McNitt-Gray MF, Meyer CR, Reeves AP, et al. The lung image database consortium (LIDC) and image database resource initiative (IDRI): a completed reference database of lung nodules on CT scans. Med Phys 2011; 38: 915–31. doi: https://doi.org/10.1118/1.3528204 [DOI] [PMC free article] [PubMed] [Google Scholar]
- 9.Christe A, Leidolt L, Huber A, Steiger P, Szucs-Farkas Z, Roos JE, et al. Lung cancer screening with CT: evaluation of radiologists and different computer assisted detection software (CAD) as first and second readers for lung nodule detection at different dose levels. Eur J Radiol 2013; 82: e873–8. doi: https://doi.org/10.1016/j.ejrad.2013.08.026 [DOI] [PubMed] [Google Scholar]
- 10.Wielpütz MO, Wroblewski J, Lederlin M, Dinkel J, Eichinger M, Koenigkam-Santos M, et al. Computer-aided detection of artificial pulmonary nodules using an ex vivo lung phantom: Influence of exposure parameters and iterative reconstruction. Eur J Radiol 2015; 84: 1005–11. [DOI] [PubMed] [Google Scholar]
- 11.Shin HO, Blietz M, Frericks B, Baus S, Savellano D, Galanski M. Insertion of virtual pulmonary nodules in CT data of the chest: development of a software tool. Eur Radiol 2006; 16: 2567–74. doi: https://doi.org/10.1007/s00330-006-0254-x [DOI] [PubMed] [Google Scholar]
- 12.Zhao B, Gamsu G, Ginsberg MS, Jiang L, Schwartz LH. Automatic detection of small lung nodules on CT utilizing a local density maximum algorithm. J Appl Clin Med Phys 2003; 4: 248–60. doi: https://doi.org/10.1120/1.1582411 [DOI] [PMC free article] [PubMed] [Google Scholar]
- 13.Ohkubo M, Wada S, Kunii M, Matsumoto T, Nishizawa K. Imaging of small spherical structures in CT: simulation study using measured point spread function. Med Biol Eng Comput 2008; 46: 273–82. doi: https://doi.org/10.1007/s11517-007-0283-x [DOI] [PubMed] [Google Scholar]
- 14.Prevrhal S, Fox JC, Shepherd JA, Genant HK. Accuracy of CT-based thickness measurement of thin structures: modeling of limited spatial resolution in all three dimensions. Med Phys 2003; 30: 1–8. doi: https://doi.org/10.1118/1.1521940 [DOI] [PubMed] [Google Scholar]
- 15.Rollano-Hijarrubia E, Stokking R, van der Meer F, Niessen WJ. Imaging of small high-density structures in CT: a phantom study. Acad Radiol 2006; 13: 893–908. doi: https://doi.org/10.1016/j.acra.2006.03.009 [DOI] [PubMed] [Google Scholar]
- 16.Marasinghe JC, Ohkubo M, Kobayashi H, Murao K, Matsumoto T, Sone S, et al. Feasible method to assess the performance of a lung cancer CT screening CAD system in clinical practice: dependence on nodule size and density. Int J Med Phys Clin Eng Radiat Oncol 2014; 3: 107–16. doi: https://doi.org/10.4236/ijmpcero.2014.32016 [Google Scholar]
- 17.Ohkubo M, Wada S, Kayugawa A, Matsumoto T, Murao K. Image filtering as an alternative to the application of a different reconstruction kernel in CT imaging: feasibility study in lung cancer screening. Med Phys 2011; 38: 3915–23. doi: https://doi.org/10.1118/1.3590363 [DOI] [PubMed] [Google Scholar]
- 18.Polacin A, Kalender WA, Brink J, Vannier MA. Measurement of slice sensitivity profiles in spiral CT. Med Phys 1994; 21: 133–40. doi: https://doi.org/10.1118/1.597251 [DOI] [PubMed] [Google Scholar]
- 19.Ohno K, Ohkubo M, Marasinghe JC, Murao K, Matsumoto T, Wada S. Accuracy of lung nodule density on HRCT: analysis by PSF-based image simulation. J Appl Clin Med Phys 2012; 13: 277–92. doi: https://doi.org/10.1120/jacmp.v13i6.3868 [DOI] [PMC free article] [PubMed] [Google Scholar]
- 20.Funaki A, Ohkubo M, Wada S, Murao K, Matsumoto T, Niizuma S. Application of CT-PSF-based computer-simulated lung nodules for evaluating the accuracy of computer-aided volumetry. Radiol Phys Technol 2012; 5: 166–71. doi: https://doi.org/10.1007/s12194-012-0150-9 [DOI] [PubMed] [Google Scholar]
- 21.Muramatsu Y, Tsuda Y, Nakamura Y, Kubo M, Takayama T, Hanai K. The development and use of a chest phantom for optimizing scanning techniques on a variety of low-dose helical computed tomography devices. J Comput Assist Tomogr 2003; 27: 364–74. doi: https://doi.org/10.1097/00004728-200305000-00012 [DOI] [PubMed] [Google Scholar]
- 22.Ohkubo M, Wada S, Matsumoto T, Nishizawa K. An effective method to verify line and point spread functions measured in computed tomography. Med Phys 2006; 33: 2757–64. doi: https://doi.org/10.1118/1.2214168 [DOI] [PubMed] [Google Scholar]
- 23.Ohkubo M, Wada S, Ida S, Kunii M, Kayugawa A, Matsumoto T, et al. Determination of point spread function in computed tomography accompanied with verification. Med Phys 2009; 36: 2089–97. doi: https://doi.org/10.1118/1.3123762 [DOI] [PubMed] [Google Scholar]
- 24.Awai K, Murao K, Ozawa A, Komi M, Hayakawa H, Hori S, et al. Pulmonary nodules at chest CT: effect of computer-aided diagnosis on radiologists' detection performance. Radiology 2004; 230: 347–52. doi: https://doi.org/10.1148/radiol.2302030049 [DOI] [PubMed] [Google Scholar]
- 25.Sone S, Hanaoka T, Ogata H, Takayama F, Watanabe T, Haniuda M, et al. Small peripheral lung carcinomas with five-year post-surgical follow-up: assessment by semi-automated volumetric measurement of tumor size, CT value and growth rate on TSCT. Eur Radiol 2012; 22: 104–19. doi: https://doi.org/10.1007/s00330-011-2241-0 [DOI] [PubMed] [Google Scholar]
- 26.Naidich DP, Bankier AA, MacMahon H, Schaefer-Prokop CM, Pistolesi M, Goo JM, et al. Recommendations for the management of subsolid pulmonary nodules detected at CT: a statement from the Fleischner society. Radiology 2013; 266: 304–17. doi: https://doi.org/10.1148/radiol.12120628 [DOI] [PubMed] [Google Scholar]
- 27.Kayugawa A, Ohkubo M, Wada S. Accurate determination of CT point-spread-function with high precision. J Appl Clin Med Phys 2013; 14: 3905. doi: https://doi.org/10.1120/jacmp.v14i4.3905 [DOI] [PMC free article] [PubMed] [Google Scholar]


