

Abstract
Key points
Calcium ions regulate mitochondrial ATP production and contractile activity and thus play a pivotal role in matching energy supply and demand in cardiac muscle.
The magnitude and kinetics of the changes in free mitochondrial calcium concentration in cardiac myocytes are largely unknown.
Rapid stimulation frequency‐dependent increases but relatively slow decreases in free mitochondrial calcium concentration were observed in rat cardiac myocytes. This asymmetry caused a rise in the mitochondrial calcium concentration with stimulation frequency.
These results provide insight into the mechanisms of mitochondrial calcium uptake and release that are important in healthy and diseased myocardium.
Abstract
Calcium ions regulate mitochondrial ATP production and contractile activity and thus play a pivotal role in matching energy supply and demand in cardiac muscle. Little is known about the magnitude and kinetics of the changes in free mitochondrial calcium concentration in cardiomyocytes. Using adenoviral infection, a ratiometric mitochondrially targeted Förster resonance energy transfer (FRET)‐based calcium indicator (4mtD3cpv, MitoCam) was expressed in cultured adult rat cardiomyocytes and the free mitochondrial calcium concentration ([Ca2+]m) was measured at different stimulation frequencies (0.1–4 Hz) and external calcium concentrations (1.8–3.6 mm) at 37°C. Cytosolic calcium concentrations were assessed under the same experimental conditions in separate experiments using Fura‐4AM. The increases in [Ca2+]m during electrical stimulation at 0.1 Hz were rapid (rise time = 49 ± 2 ms), while the decreases in [Ca2+]m occurred more slowly (decay half time = 1.17 ± 0.07 s). Model calculations confirmed that this asymmetry caused the rise in [Ca2+]m during diastole observed at elevated stimulation frequencies. Inhibition of the mitochondrial sodium–calcium exchanger (mNCE) resulted in a rise in [Ca2+]m at baseline and, paradoxically, in an acceleration of Ca2+ release. In conclusion: rapid increases in [Ca2+]m allow for fast adjustment of mitochondrial ATP production to increases in myocardial demand on a beat‐to‐beat basis and mitochondrial calcium release depends on mNCE activity and mitochondrial calcium buffering.
Keywords: calcium mitochondria, cardiac muscle, cardiomyocyte, muscle energetics
Key points
Calcium ions regulate mitochondrial ATP production and contractile activity and thus play a pivotal role in matching energy supply and demand in cardiac muscle.
The magnitude and kinetics of the changes in free mitochondrial calcium concentration in cardiac myocytes are largely unknown.
Rapid stimulation frequency‐dependent increases but relatively slow decreases in free mitochondrial calcium concentration were observed in rat cardiac myocytes. This asymmetry caused a rise in the mitochondrial calcium concentration with stimulation frequency.
These results provide insight into the mechanisms of mitochondrial calcium uptake and release that are important in healthy and diseased myocardium.
Abbreviations
- [Ca2+]m
free Ca2+ concentration in the mitochondrial matrix
- [Ca2+]o
external Ca2+ concentration
- CFP
cyan fluorescent protein
- FRET
Förster resonance energy transfer
- MCU
mitochondrial calcium uniporter
- mNCE
mitochondrial sodium–calcium exchanger
- SR
sarcoplasmic reticulum
- t10‐90%
rise time from 10% to 90% of peak amplitude
- t50%
half time of decay from start of electrical stimulation
- tp
time to peak from start of electrical stimulation
- YFP
yellow fluorescent protein
Introduction
Calcium ions regulate contractile activity as well as mitochondrial ATP production and thus play a pivotal role in matching energy supply and demand in cardiac muscle. Calcium uptake by the mitochondria has been studied to a great extent in isolated mitochondria in vitro, which lack the spatial organization of mitochondria near the calcium release units (Franzini‐Armstrong, 2007; Szabadkai & Duchen, 2008; Lu et al. 2013; Dorn & Maack, 2013). Here we used a fast ratiometric FRET‐based calcium sensor (4mtD3cpv, MitoCam), genetically targeted to the mitochondrial matrix (Palmer & Tsien, 2006; Palmer et al. 2006; Scorzeto et al. 2013; Kaestner et al. 2014) to determine the changes in free mitochondrial calcium concentration ([Ca2+]m) in adult rat cardiomyocytes in situ.
The speed of mitochondrial calcium uptake is a matter of ongoing debate (Hüser et al. 2000; O'Rourke & Blatter, 2009). Recent studies suggested beat‐to‐beat variations in the free mitochondrial calcium concentration which could be important for mitochondrial function (Maack et al. 2006; Maack & O'Rourke, 2007; Kettlewell et al. 2009; Lu et al. 2013; Boyman et al. 2014). However, the magnitude of the changes in free mitochondrial calcium concentration have not been assessed.
To obtain insight in the mechanisms of mitochondrial calcium uptake and release, mitochondrial calcium measurements were performed at different stimulation frequency, external calcium concentration, temperature (27 and 37°C) and in the presence and absence of CGP‐ 35157, a specific inhibitor of the mitochondrial sodium–calcium exchanger (mNCE), also known as the sodium‐calcium‐litium exchanger. In parallel experiments, the relation was studied between the cytosolic calcium concentration (assessed using Fura‐4AM) and the mitochondrial free calcium concentration. In addition, model simulations of mitochondrial calcium handling were carried out to assess the role of mitochondrial calcium buffering.
Methods
Ethical approval
Investigations were approved by the ethics committee of the VU medical center. All procedures were in accordance with institutional guidelines.
Myocyte isolation and viral transfection
Adult Wistar rats (∼300 g; Charles River, Leiden, Netherlands) were anaesthetized by isoflurane inhalation and killed by bleeding after heart removal. Ventricular cardiomyocytes were isolated from the excised hearts by enzymatic dissociation as described previously (Kaestner et al. 2009; Fowler et al. 2015). Freshly isolated cells were plated on laminin‐coated dishes (MatTek Corporation, Ashland, MA, USA) for 1 h before transfection in M199 medium (PAA Laboratories, Pasching, Austria) supplemented with 100 μg ml−1 penicillin and 100 μg ml−1 streptomycin (P/S), 5% Fetal Bovine Serum (FBS) and 0.2% Insulin Transferrin Selenium (ITS). The 4mtD3cpv cameleon (MitoCam) plasmid targeted to the mitochondrial matrix via a targeting sequence, derived from subunit VIII of human cytochrome c oxidase (COX), and replicated 4 times (Filippin et al. 2005) in pcDNA3 (kindly donated by Dr R. Y. Tsien, University of California, San Diego, CA, USA) was incorporated in adenovirus serotype 5 using the XL AdEasy Adenoviral Vector System (Stratgene, La Jolla, CA, USA).
Adenoviral‐mediated 4mtD3cpv gene transduction was carried out by infection for 2 h at a multiplicity of approximately 500 virus particles per cell. Infected cells were kept in culture in M199 medium supplemented with P/S, ITS (0.2%) and a low concentration of cytochalasin D (0.5 μm) obtained from Sigma‐Aldrich (Zwijndrecht, the Netherlands). Measurements were performed between 40 and 60 h after the start of infection. Previous studies indicate that cardiac remodelling is largely prevented under these experimental conditions (Tian et al. 2012).
Intramitochondrial free Ca2+ concentration measurements
Measurements of the free Ca2+ concentration inside the mitochondrial matrix ([Ca2+]m) were carried out using a fluorescence photometry setup (IonOptix Corp., Milton, MA, USA) on the stage of an inverted fluorescence microscope (AE31; Motic, Richmond, BC, Canada) equipped with a ×63 oil immersion objective (Plan Apochromat, NA 1.4, Zeiss, Sliedrecht, the Netherlands). A 75 W xenon lamp (USHIO, Tokyo, Japan), set to 65 W, and filtered at 436 nm (bandwidth 20 nm) was used for illumination. A rectangular mask was used to select light emitted from the cardiomyocyte. Filters and dichroic mirrors were purchased from Chroma Technology (Brattleboro, VT, USA) unless indicated otherwise. Emitted light was passed through a long‐pass dichroic mirror with a cut‐off frequency of 455 nm (T455LP). A dichroic mirror (585 nm long‐pass; 585DCXR) was used to separate the fluorescence light from the red filtered light used for transmission illumination. An image of the cell was displayed on a CCD camera (MyoCam‐S, IonOptix) and sarcomere length within a selected region was determined at a rate of 250 s−1 via spatial fast Fourier transform. Emitted light with a wavelength of 485 nm (cyan fluorescent protein, CFP) and 535 nm (yellow fluorescent protein, YFP) was selected with a dichroic mirror (510 nm long‐pass; T510lprxt) and filters (480/30X (262833) for CFP and ET540/40M (287814) for YFP) and detected with two identical photomultiplier tubes (PMT; H7360‐02MOD; Hamamatsu Photonics, Hamamatsu, Japan) at a sampling frequency of 250 Hz. A neutral density filter (attenuation 50% or more) was inserted into the light path to avoid saturation and to reduce bleaching. Background intensities were determined from an adjacent empty region in the dish by moving the cardiomyocytes out of the field of view. The YFP/CFP ratio (R) was calculated after subtraction of the background intensities. A computer program (IonWizard, IonOptix) was used for data acquisition and analysis. Ensemble averaging and digital filtering was used when appropriate, and is indicated in the figure legends.
Subcellular localization of the mitochondrial calcium probe
Mitochondria were localized by application of 0.2 μm MitoTracker Red FM (M22425, Invitrogen, Breda, Netherlands) for at least 20 min using confocal scanning laser microscopy on a Leica TCS SP8 3X (Leica Microsystems, Mannheim, Germany). Mitochondria containing MitoCam and MitoTracker Red were visualized using a pulsed excitation white light laser (max. 10% laser power) at 495 nm and 580 nm, respectively. Fluorescence signals were detected using Hybrid Detectors (Leica Microsystems) at 535 nm (MitoCam) and 645 nm (MitoTracker Red). Images were acquired using a ×40 oil objective (Leica Microsystems, NA 1.3). Standard image acquisition protocols included 3‐D stacks of multiple cardiomyocytes. Finally, images were deconvolved using Huygens Professional software (Scientific Volume Imaging, Hilversum, the Netherlands).
Calibration of the mitochondrial calcium sensor
Calibration of the intramitochondrial Ca2+ sensor (4mtD3cpv, MitoCam) was performed using a simplified version of a protocol described previously (Haviland et al. 2014). Cardiomyocytes were incubated in Tyrode solution (in mm): Hepes (20), KCl (140), MgCl2 (1.51), KH2PO4 (0.5), set at pH = 8.0 with KOH, and 5 mm BAPTA (Sigma). The pH of the solution was adjusted to 8.0 to mimic the mitochondrial pH. Ionomycin (5 μm) was added to determine the minimum in the YFP/CFP ratio (R min). Small volumes of CaCl2 (100 mm stock) were added until the maximum value (R max ) was reached. The free Ca2+ concentration of the BAPTA‐buffered solution was determined using a custom‐made computer program described previously (Papp et al. 2002). The equation was used to estimate the free [Ca2+]m, in which is the apparent dissociation constant and h a measure of the steepness of the relation (Palmer et al. 2006).
Cytosolic Ca2+ measurements
Untransfected cardiomyocytes kept in culture for 2 days were loaded with 1 μm Fura‐4 acetoxymethyl ester (Fura‐4AM; Life Technologies, Bleiswijk, the Netherlands) in Tyrode solution for 15 min at room temperature. Thereafter cells were washed and left for de‐esterification for 15 min. Cytosolic Ca2+ signals were recorded using a dual‐beam excitation fluorescence photometry setup (IonOptix) equipped with an UV‐enhanced ×40 objective (UApo/340, Olympus, Zouterwoude, the Netherlands). A HyperSwitch (IonOptix) was used for rapid wavelength switching between 340 and 380 nm at 250 Hz. Excitation was measured at 510 nm. After background correction, the F340/F380 ratio was used as a measure of cytosolic Ca2+ concentration. An image of the cell was displayed on a CCD camera (MyoCam‐S, IonOptix) and sarcomere length was determined via spatial fast Fourier transform at 250 Hz. Ensemble averaged transients were used in the analysis.
Experimental protocols
Experiments were performed in a temperature‐controlled MatTek dish at 37°C (unless noted otherwise) equipped with platinum stimulation electrodes, filled with 5 ml of normal Tyrode solution containing (in mm): NaCl (133.5), KCl (5), MgSO4 (1.2), Hepes (10), glucose (11.1) and CaCl2 (1.8–3.6) (pH 7.4). Bipolar pulses (duration: 4 or 14 ms, amplitude: 10–40 V, frequency: 0.1–4 Hz) were used for electrical field stimulation. The free calcium concentrations at baseline in quiescent cells at the beginning of the experiments were derived from the YFP/CFP intensity ratio (R), after subtraction of the background intensities.
Effect of stimulation frequency
The measurements to determine the frequency dependence of the mitochondrial calcium transients were started by measuring either mitochondrial or cytosolic [Ca2+] and sarcomere length at 0.1 Hz stimulation for 5 min (30 contractions). Thereafter measurements were performed at 1, 2 and 4 Hz for 60 s. Each stimulation period was followed by a period of rest of 2 min. The experimental sequence was concluded with a control measurement at 1 Hz. The results were discarded when contractions became irregular during the experimental run.
Effect of external calcium
To determine the dependence of the calcium transients on external calcium concentration ([Ca2+]o) the cells were stimulated at 0.1 Hz. Most experiments started in 1.8 mm [Ca2+]o. Signals were recorded for 5 min from several cells in a dish. Subsequently, CaCl2 was injected inside the measuring chamber in order to raise [Ca2+]o to 2.4, 3.0 and 3.6 mm.
Inhibition of the mitochondrial sodium–calcium exchanger
The effects of the selective mitochondrial sodium–calcium exchanger (mNCE) blocker CGP‐37157 (CGP; 1 or 4 μm) were studied after an incubation period of at least 5 min – in paired measurements on the same cells – by stimulation of cells at 0.1 Hz and [Ca2+]o of 2.4 mm.
Statistical analysis
Statistical comparisons were made using Student's t test and one‐ or two‐way ANOVA, with Tukey post hoc tests, where appropriate. The level of significance was set at P < 0.05. Values are presented as mean ± SEM (n = number of cells). The ranges of the estimate of the calibrated free mitochondrial calcium concentration were derived from the R – SEM and the R + SEM values, in which R represents the YFP/CFP ratio after background subtraction.
Results
Targeting of MitoCam to the mitochondria
Images of a rat cardiomyocyte expressing MitoCam are shown in Fig. 1 A–D. MitoCam fluorescence shows the typical mitochondrial pattern overlapping (Fig. 1 E) with fluorescence of the mitochondrial marker MitoTracker Red. Twenty‐four hours after transfection, MitoCam expression was present in almost all cells but considerable differences were observed between cells. After 48 h in culture mean fluorescence intensity almost doubled and the differences in expression between cells were smaller.
Figure 1. MitoCam targeting and temporal relations between sarcomere shortening, free cytosolic calcium concentration and free mitochondrial calcium concentration.
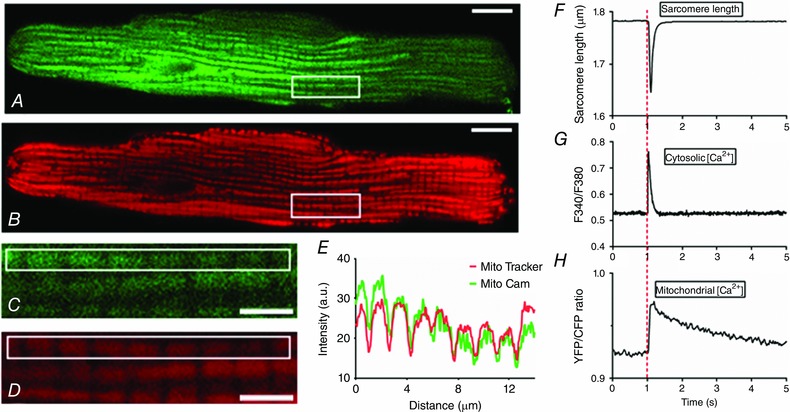
A and B, MitoCam expression (excitation: 495 nm/emission: 535 nm, in green) and MitoTracker Red staining (excitation: 585 nm/emission: 645 nm, in red) in a rat cardiomyocyte (scale bar: 10 μm). C and D, a stack of images in the vertical direction in the area indicated by the rectangle in A and B was used to deconvolve the images shown (scale bar: 3 μm). E, intensity profile in the green and red channel in the rectangle shown in C and D. F–H, sarcomere shortening, free cytosolic calcium (Fura‐4 ratio) and free mitochondrial Ca2+ concentration (YFP/CFP ratio) in electrically stimulated cardiac myocytes at low stimulation frequency (0.1 Hz). At t = 1 s the cell is stimulated electrically. The rise time from 10 to 90% of the amplitude of the increase in free mitochondrial Ca2+ concentration (t 10‐90%) is rapid (∼50 ms) whereas the decay occurs more slowly (decay half time, t 50%: ∼1.2 s). Corresponding values for the cytosolic calcium transient are: t 10‐90%: ∼12 ms; t 50%: ∼80 ms. [Color figure can be viewed at wileyonlinelibrary.com]
Temporal relation between mitochondrial and cytosolic calcium transients and sarcomere shortening
The temporal relation between the changes in sarcomere length and the cytosolic and mitochondrial calcium transients is illustrated in Fig. 1 F–H. During stimulation at 0.1 Hz, rapid decreases in sarcomere length and increases in cytosolic [Ca2+] occurred which returned to baseline within 0.5 s. In contrast, [Ca2+]m increased rapidly with a rise time from 10 to 90% of the peak value (t 10‐90%) of 49 ± 2 ms and a time to peak (t p) of 106 ± 4 ms, but decayed much more slowly with a half time (t 50%, measured from the start of stimulation) of 1.17 ± 0.07 s (n = 59).
Ratiometric properties of the FRET‐based indicator
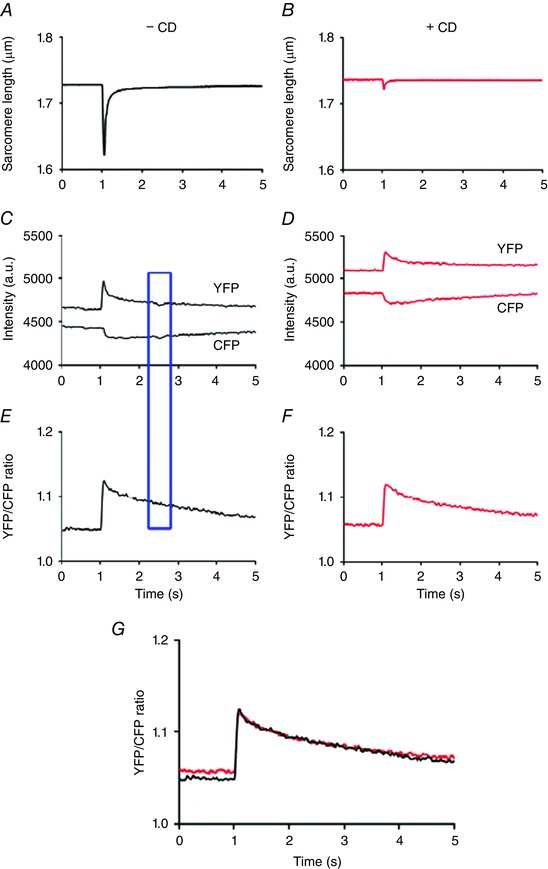
An example of the sarcomere length, the changes in YFP and CFP intensity and the YFP/CFP ratio in the absence and presence of a high concentration of the mechanical uncoupler cytochalasin D is shown in Fig. 2. It can be seen that, as expected, the YPF (acceptor) and CFP (donor) intensities change in opposite directions. This figure also demonstrates that the ratiometric properties of this FRET‐based indicator largely eliminate the effects of intensity fluctuation of the incident light and motion artifacts.
Figure 2. The ratiometric properties of MitoCam largely eliminate motion artifacts.
A and B, averaged sarcomere length recording from a single cardiomyocyte at 0.1 Hz is almost completely abolished in the presence of the mechanical uncoupler cytochalasin D (CD; 40 μm) (absence of CD, black; presence of CD, red). C and D, the corresponding YPF and CFP intensities. E and F, the corresponding YFP/CFP ratios. G, superposition of the YFP/CFP ratios in the absence and presence of CD, indicating that the time courses were very similar. The intensity fluctuations in the YFP and CFP signal indicated by the blue rectangle did not result in a disturbance of the YFP/CFP ratio. The recordings in C–G were low‐pass filtered at 10 Hz. [Color figure can be viewed at wileyonlinelibrary.com]
Calibration of MitoCam and estimation of the baseline calcium concentration in quiescent cardiomyocytes
Calibration of MitoCam was performed as described in Methods. The results obtained in six different unstimulated cells are illustrated in Fig. 3 A. The relation was fitted to the averaged data points, with R min = 1.32 ± 0.05, R max = 2.43 ± 0.15, = 1.77 ± 0.36 μm and h = 0.60 ± 0.08. The average YFP/CFP ratio in these experiments in quiescent cardiomyocytes at baseline (in 1.8 mm external calcium) amounted to 1.47 ± 0.04, which corresponded to 79 nm (range: 44–127 nm).
Figure 3. MitoCam calibration and time‐dependent changes in autofluorescence.
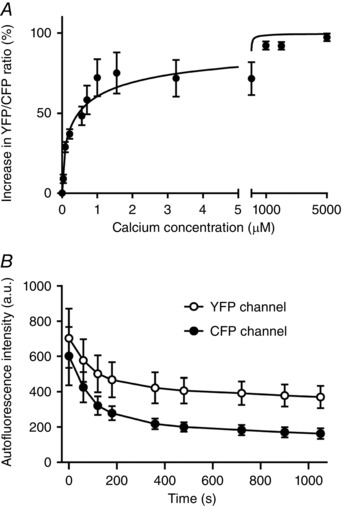
A, average results (mean ± SEM, n = 6 cells) of the relative increase in YFP/CFP ratio after correction of background intensity (R) at different Ca2+ concentrations. The relation was fitted to the averaged data points, with R min = 1.32 ± 0.05, R max = 2.43 ± 0.15, = 1.77 ± 0.36 μm and h = 0.60 ± 0.08. The mean YFP/CFP ratio in these experiments in quiescent cardiomyocytes at baseline (in 1.8 mm external calcium) amounted to 1.47 ± 0.04, which corresponded to 79 nm (range: 44–127 nm). B, average results (n = 3) illustrating the changes in autofluorescence in the YFP and CFP channels measured in quiescent cells.
In additional experiments on six cells, we followed the protocol of Haviland et al. (2014). In these experiments saponin (50 μg ml−1; 2 min) was applied to permeabilize the cells, ionomycin (5 μm) was used as calcium ionophore, thapsigargin (5 μm) was used to inhibit Ca2+ uptake by the sarcoplasmic reticulum, and FCCP (5 μm) and oligomycin (1 μm) were used to uncouple the mitochondria. In these experiments R min = 1.37 ± 0.03, R max = 2.25 ± 0.17, = 0.47 ± 0.10 μm and h = 0.55 ± 0.09. The net effect of the difference between the two methods is rather small. Using the protocol of Haviland et al., the YFP/CFP ratio at baseline in Tyrode solution with 1.8 mm Ca2+ was very similar to R min, whereas the ratio in washing Tyrode solution with 0 Ca2+ was less than R min. Since this was not the case in our protocol we prefer to use the estimates calculated on the basis of our simplified calibration protocol. It should be noted, however, that given the relatively large impact of uncertainties in the parameter and baseline values, our estimates of the mitochondrial calcium concentration and the changes thereof are rather crude.
Influence of autofluorescence and effects of bleaching
The effects of autofluorescence of the cardiomyocytes at the excitation and emission wavelengths used for the mitochondrial calcium measurements were assessed in untransfected cells kept in culture for 2 days. Bleaching of the autofluorescence signal in the CFP channel occurred more rapidly than that in the YFP channel (Fig. 3 B). Using a neutral density filter with 50% attenuation, the averaged intensities at the YFP and CFP wavelengths (corrected for background intensity) at the start of the measurements amounted to 703 ± 292 and 602 ± 286 units (n = 3). Corresponding values of the initial values in transfected cells, i.e. the sum of probe and autofluorescence signals, were: 5842 ± 287 units for YFP and 4569 ± 218 units for CFP (n = 44). Time control experiments performed in quiescent cells (n = 4) showed that the YFP/CFP ratio increased during an illumination period of 1000 s by 4.8 ± 1.6%. These results indicate that the influence of autofluorescence and bleaching in the mitochondrial calcium measurements is small.
A minor positive correlation was observed between the YFP intensity level at baseline (which is a surrogate marker of the expression level of the probe) and the amplitude of the mitochondrial calcium transients. This trend could well be explained by the influence of autofluorescence, and is opposite to an effect of calcium buffering of the probe inside the mitochondrial matrix. We therefore expect that, at the expression levels used, the buffering capacity of MitoCam is small in comparison to the capacity of the intrinsic calcium buffers inside the mitochondrial matrix.
Temperature dependence of the time course of the mitochondrial calcium transients
In part of the experiments a comparison was made between the time course of the mitochondrial calcium transients elicited at 0.1 Hz at 27°C and 37°C. At 27°C the rise time (t 10‐90%) amounted to 64 ± 4 ms and the decay half time (t 50%) to 1.54 ± 0.16 s (n = 11). Corresponding values in parallel experiments at 37°C were 62 ± 9 ms and 1.46 ± 0.19 s (n = 7), i.e. not significantly different from those at 27°C.
Dependence of the free mitochondrial calcium concentration on stimulation frequency
Figure 4 A–D illustrates the recordings obtained successively at 0.1, 1, 2 and 4 Hz. Individual transients can be recognized in the upper recording (0.1 Hz). At higher stimulation frequencies, a transient fast rise and relatively slow fall in [Ca2+]m could be observed in the averaged responses (insets). During the 60 s stimulation periods at 1, 2 and 4 Hz, a gradual accumulation of mitochondrial Ca2+ occurred (indicated by ΔR in Fig. 4 B). Figure 4 E shows the averaged responses of the 0.1 Hz recordings and illustrates the determination of t 10‐90%. The main characteristics of the [Ca2+]m transients at different stimulation frequencies are summarized in Fig. 4 F–I. The initial baseline determined before the start of the train of stimuli tended to increase (Fig. 4 F). This effect, however, was not significant in the average data. Additional experiments in which the recovery period of rest after 4 Hz stimulation was increased suggested the presence of a small and very slow recovery phase lasting more than 10–20 min.
Figure 4. Kinetics of mitochondrial calcium uptake and release depend on stimulation frequency.
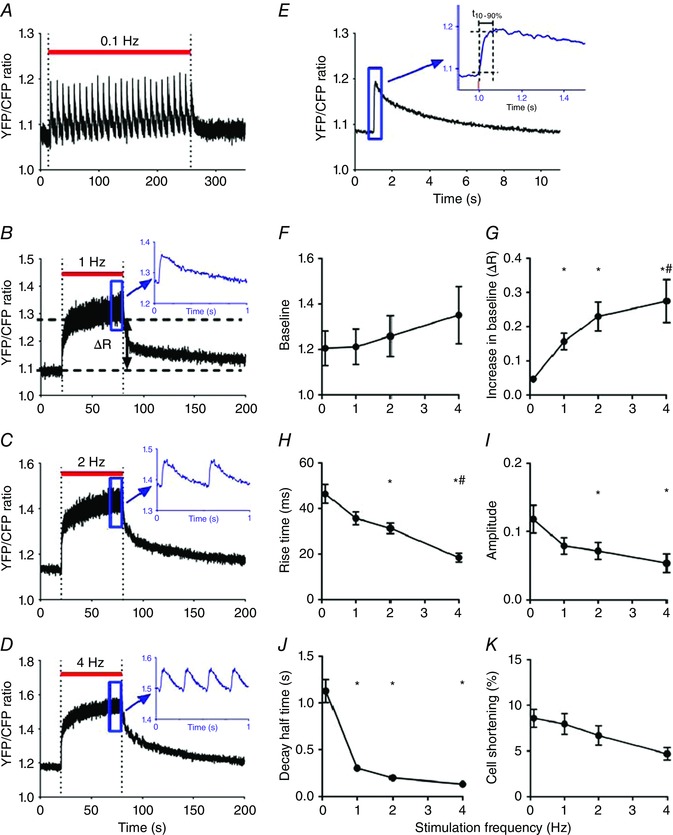
A–D, consecutive recordings of free mitochondrial calcium concentration (YFP/CFP ratio) obtained from a single cardiomyocyte stimulated at 0.1, 1, 2 and 4 Hz during the periods indicated by the red bars, with 120 s pauses in between, at 1.8 mm external calcium. For illustration purposes, the recordings were smoothed using a 2‐points running average. The insets of the 1, 2 and 4 Hz recordings show averaged recordings of the quasi‐steady state reached during the final phase of the stimulation period (indicated by the blue rectangles). It can be seen that the free mitochondrial calcium concentration changes on a beat‐to‐beat basis. E, averaged mitochondrial calcium transient derived from the responses obtained at 0.1 Hz shown in A. The inset illustrates the determination of the 10–90% rise time (t 10‐90%). The stimulus pulse occurred at t = 1 s. F–J, overview of the stimulation frequency dependence of [Ca2+]m. K, stimulation frequency dependence of relative cell shortening derived from the changes in sarcomere length. The average values (mean ± SEM) at 0.1, 1, 2 and 4 Hz were obtained from 16, 16, 13 and 9 different cells, respectively. * P < 0.05 vs. 0.1 Hz; # P < 0.05 vs. 1 Hz (one‐way ANOVA). [Color figure can be viewed at wileyonlinelibrary.com]
Calcium accumulation during the stimulation intervals (ΔR) increased significantly with stimulation frequency (Fig. 4 G). Moreover, rise time (t 10‐90%) and time to peak decreased from 46 ± 4 ms and 94 ± 4 ms at 0.1 Hz (n = 16) to 20 ± 3 ms and 53 ± 5 ms at 4 Hz (n = 9) (Fig. 4 H). The amplitude of the [Ca2+]m transients significantly decreased with stimulation frequency (Fig. 4 I). Figure 4 J indicates that recovery was slow (at 0.1 Hz the decay half time, t 50%, amounted to 1.18 ± 0.16 s (n = 16)). The decay half time was inversely related to stimulation frequency. This was as expected because the duration of the decay phase depended on the duration of the stimulus interval. Resting sarcomere length remained constant during the experimental run. The amplitude of sarcomere shortening at different stimulation frequency is shown in Fig. 4 K.
The initial level of the YFP/CFP ratio measured in quiescent cells (cf. Fig. 4 B) corresponded, on the basis of calibration experiments (Fig. 3 A), to an average [Ca2+]m of 79 nm (range: 27–141 nm). The maximum diastolic calcium concentration determined at the end of the train of stimuli at 4 Hz amounted to 0.80 μm (range: 0.21–2.41 μm) and the maximum systolic calcium concentration reached at 4 Hz corresponded to 0.89 μm (range: 0.23–2.79 μm). An overview of the estimated calcium levels, ranges and the number of cells studied at different stimulation frequencies is given in Table 1.
Table 1.
Estimated free mitochondrial calcium concentrations (μm)
| Frequency series ([Ca2+]o 1.8 mm) | ||||
|---|---|---|---|---|
| Frequency (Hz) | Initial [Ca2+] (range) | End‐diastolic [Ca2+] (range) | Peak systolic [Ca2+] (range) | n |
| 0.1 | 0.079 (0.027–0.141) | 0.136 (0.049–0.283) | 0.321 (0.132–0.653) | 16 |
| 1 | 0.079 (0.026–0.142) | 0.355 (0.168–0.661) | 0.603 (0.279–1.181) | 16 |
| 2 | 0.079 (0.020–0.150) | 0.595 (0.238–1.294) | 0.798 (0.321–1.783) | 13 |
| 4 | 0.079 (0.005–0.179) | 0.798 (0.213–2.412) | 0.888 (0.232–2.792) | 9 |
| External calcium series (0.1 Hz) | ||||
|---|---|---|---|---|
| [Ca2+]o (mm) | Initial [Ca2+] (range) | End‐diastolic [Ca2+] (range) | Peak systolic [Ca2+] (range) | n |
| 1.8 | 0.079 (0.044–0.127) | 0.329 (0.223–0.468) | 50 | |
| 2.4 | 0.098 (0.060–0.148) | 0.240 (0.168–0.331) | 32 | |
| 3.0 | 0.922 (0.653–1.286) | 1.648 (1.131–2.397) | 16 | |
| 3.6 | 0.877 (0.560–1.342) | 2.486 (1.658–3.765) | 15 | |
| CGP‐37157 series ([Ca2+]o 2.4 mm; 0.1 Hz) | ||||
|---|---|---|---|---|
| [CGP] (μm) | Initial [Ca2+] (range) | End‐diastolic [Ca2+] (range) | Peak systolic [Ca2+] (range) | n |
| 0 | 0.116 (0.070–0.178) | 0.587 (0.394–0.850) | 24 | |
| 1 | 0.236 (0.148–0.355) | 0.899 (0.603–0.318) | 24 | |
| 0 | 0.079 (0.036–0.142) | 0.509 (0.307–0.803) | 18 | |
| 4 | 0.334 (0.206–0.512) | 1.125 (0.729–1.709) | 18 | |
Initial, end‐diastolic and peak systolic free mitochondrial calcium concentration (in μm) with ranges calculated from the YFP/CFP ratios as indicated in Methods. The initial YFP/CFP ratios of the frequency series were corrected for changes in baseline during the experimental run. The end‐diastolic values in the External calcium series and CGP‐37157 series were the same as the initial values. The magnitude of mitochondrial calcium transients and the effects of stimulation frequency and external calcium concentrations did not depend on the initial YFP/CFP ratio at baseline. In the calculation of the mean free mitochondrial calcium concentration of the different experimental groups at baseline we therefore assume that the initial YFP/CFP ratio corresponds to the free mitochondrial calcium concentration at baseline observed in the calibration experiments, i.e. 79 nm (see Fig. 3).
Effect of β‐adrenergic stimulation of mitochondrial calcium handling
Mitochondrial calcium uptake could be important to match ATP supply and demand during increases in cardiac workload. These are, under physiological conditions, mediated by β‐adrenergic stimulation. Since mitochondrial calcium uptake depends to a large extent on release of calcium from the sarcoplasmic reticulum (SR), and β‐adrenergic stimulation has a strong impact on the rate and net amount of release of calcium from the SR, we tested the effects of 100 nm isoprenaline (isoproterenol). In these experiments the free [Ca2+]m increased but the cells became unstable and the contractions became irregular, especially at higher, near physiological, stimulation frequencies. This feature is prominent in rat cardiac myocytes (see e.g. Bovo et al. 2016; Lu et al. 2016). In two additional experiments, we tested the effect of increasing doses of isoprenaline at rest and during 0.1 Hz stimulation (baseline and 10, 18, 24.2, 29.4, 33.5 and 40.1 nm incubated for 5 min). One cell became unstable at 29.4 nm and the other one at 40.1 nm. At threshold isoprenaline concentrations a 5–10% increase in the basal YFP/CFP ratio was observed and no conspicuous alterations in the kinetics of the mitochondrial calcium transients were observed.
Simulation of the mitochondrial calcium transients
To facilitate quantitative interpretation of the time dependence of mitochondrial calcium handling we simulated the mitochondrial calcium transient using the model described in the Appendix (Figure. A1). It can be seen that there is good agreement between the experimental results and model calculations at stimulation frequencies of 0.1 and 1 Hz (Fig. 5) using the parameter values shown in Table 2. It appeared that the literature value for the K d of the mitochondrial calcium uniporter (MCU; 10−5 m −1) of Mallilankaraman et al. (2012) yielded a satisfactory fit to the data at 0.1 Hz, but the value given in Table 2 (3 × 10⁻⁵ m −1) yielded a better fit to the rise in mitochondrial calcium at 1 Hz.
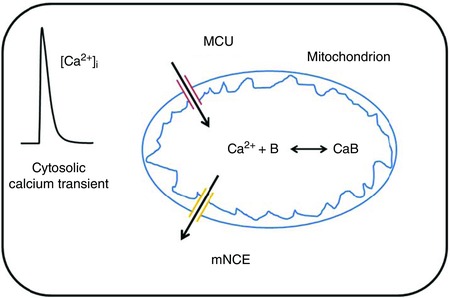
Figure A1. Schematic diagram of mitochondrial calcium handling used in the simulations.
[Color figure can be viewed at wileyonlinelibrary.com]
Figure 5. Asymmetric calcium uptake and release causes frequency‐dependent mitochondrial calcium accumulation.
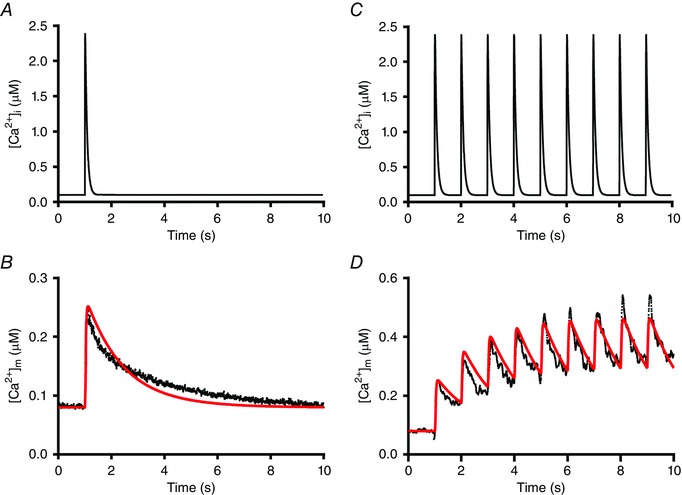
A, schematic diagram of the cytosolic calcium transient ([Ca2+]i). B, the mitochondrial calcium transient ([Ca2+]m, in black) obtained – after calibration – from the experimental recording shown in Fig. 2 E and the simulated mitochondrial calcium transient (in red). C, schematic diagram of the cytosolic calcium transient ([Ca2+]i) at 1 Hz. D, simulation (in red) of the early part of the mitochondrial calcium transient at 1 Hz (in black, derived from the recording shown in Fig. 2 B). For clarity, the averaged experimental recording obtained after calibration at 0.1 Hz was smoothed using a 5‐points running average and the calcium transient at 1 Hz was digitally filtered at 5 Hz. Details on the model and the parameter values used are given in the Appendix. [Color figure can be viewed at wileyonlinelibrary.com]
Table 2.
Overview of the parameter values used to simulate the mitochondrial calcium transients
| Parameter | Description | Value | Reference |
|---|---|---|---|
| Initial conditions | |||
| [Ca2+]i | Cytosolic calcium concentration | 100 nm | Boyman et al. (2013) |
| [Ca2+]m | Mitochondrial calcium concentration | 79 nm | This study |
| [Na+]i | Cytosolic sodium concentration | 10 mm | Boyman et al. (2013) |
| [Na+]m | Mitochondrial sodium concentration | 5 mm | Boyman et al. (2013) |
| Model parameters | |||
| λ | Mitochondrial volume fraction | 0.3 | Barth et al. (1992); Olivetti et al. (1992) |
| B tot | Total mitochondrial calcium buffer concentration | 2 × 10⁻⁶ m | This study |
| k on | Rate of calcium binding of B | 6 × 10⁸ m −1 s−1 | This study |
| k off | Rate of calcium release of B | 0.4 s−1 | This study |
| ΔΨm | Mitochondrial membrane potential | 190 mV | Dash & Beard (2008) |
| V MCU | Rate of calcium uptake via MCU | 2 s−1 | Boyman et al. (2013) |
| K d,MCU | Affinity of calcium binding to the MCU | 3 × 10⁻⁶ m | This study |
| h | Parameter Hill equation | 3.5 | Mallilankaraman et al. (2012) |
| f MCU | Multiplication factor MCU | 2.3 × 10⁻⁶ | This study |
| X mNCE | Activity of the mNCE | 9.2 × 10⁻⁹ m s−1 | Dash & Beard (2008) |
| f mNCE | Multiplication factor mNCE | 2.7 | This study |
| K Ca,mNCE | Ca2+ binding constant of mNCE | 2.1 × 10⁻⁶ m | Dash & Beard (2008) |
| K Na,mNCE | Na+ binding constant of mNCE | 8.2 × 10⁻³ m | Dash & Beard (2008) |
| [Ca2+]i(t) | Cytosolic calcium transient | Equation (A1) | |
| [Ca2+]m(t) | Mitochondrial calcium transient | Equation (A2) | |
| [Ca2+]m,tot(t) | Total mitochondrial calcium concentration | Equations (A2) and (A3) | |
| J mNCE | Calcium flux via mNCE | Equation (A3) | Dash & Beard (2008) |
| J MCU | Calcium flux via MCU | Equation (A4) | Mallilankaraman et al. (2012) |
The total mitochondrial calcium buffer concentration used yields a ratio of free:bound calcium of 1:250 in quiescent cells, which is consistent with an estimate of 1:100 of (Lu et al. 2013). Larger buffer concentrations also yielded a satisfactory fit to the data at 0.1 Hz, but the rise in mitochondrial calcium at 1 Hz appeared to be more pronounced. This is illustrated in Fig. 6 where mitochondrial calcium transients as well as the corresponding fluxes via the mNCE (J mNCE) are shown for a mitochondrial buffer concentration B tot of 2 μm and 20 μm.
Figure 6. Model calculations of changes in free mitochondrial calcium concentration and calcium flux via the mNCE.
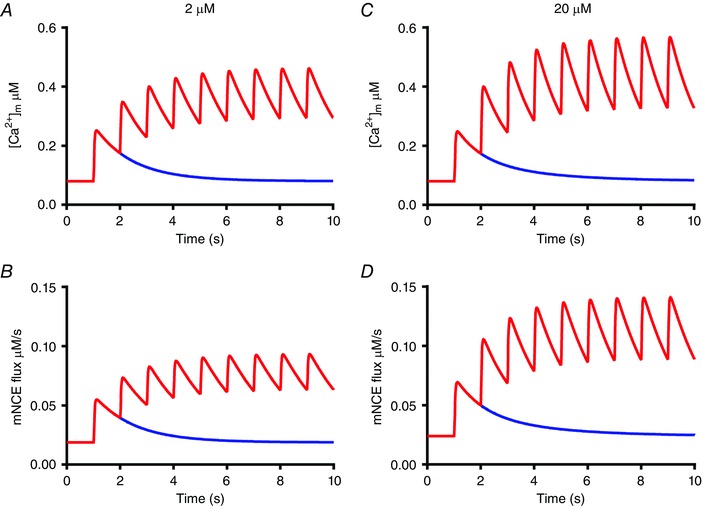
A and B, mitochondrial calcium transient (top) and calcium flux via the mNCE using the parameter values shown in Table 2, i.e. with a total mitochondrial calcium buffer concentration (B tot) of 2 μm. C and D, corresponding graphs at B tot = 20 μm. The multiplication factors f MCU and f mNCE were increased to 3.5 × 10⁻⁶ and 3.45, respectively, in order to mimic the amplitude and time course of the mitochondrial calcium transient to a single stimulus at t = 1 s (in blue) shown in A. Note that as a result of a 10‐fold increase in B tot, the amplitude and the maximum value of the mitochondrial calcium transient and of the calcium flux via the mNCE reached at 1 Hz stimulation are increased. [Color figure can be viewed at wileyonlinelibrary.com]
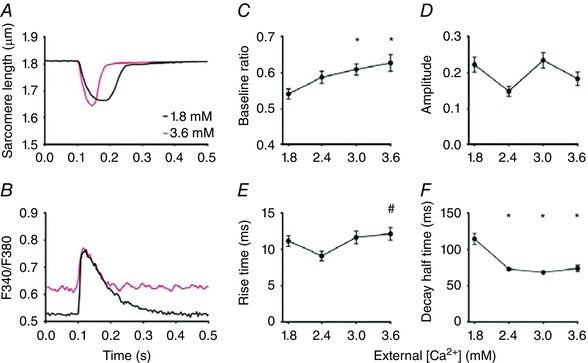
Dependence of the free mitochondrial calcium concentration on external calcium
Recordings of the sarcomere length changes and free mitochondrial calcium transients during 0.1 Hz stimulation at 1.8 and 3.6 mm [Ca2+]o are shown in Fig. 7 A and B. The [Ca2+]m at baseline at 3.6 mm was larger than at 1.8 mm [Ca2+]o. To study the time course of the development of the increase in baseline, measurements were performed at different times after a sudden increase from 1.8 to 3.6 mm [Ca2+]o (Fig. 7 C). These results indicated that the rise in [Ca2+]m in unstimulated cells occurred on a slow time scale. [Ca2+]m at baseline in 3.0 and 3.6 mm [Ca2+]o was larger than at 1.8 mm [Ca2+]o (Fig. 7 D), whereas the amplitude of the [Ca2+]m transient (Fig. 7 E) remained the same. The rise time of the increase in [Ca2+]m decreased (Fig. 7 F) and the half time of the decay in [Ca2+]m (Fig. 7 G) increased with [Ca2+]o. Average results of sarcomere length and cell shortening are shown in Fig. 7 H and I.
Figure 7. Mitochondrial free calcium at baseline and the speed of mitochondrial calcium uptake and release depend on external calcium concentration.
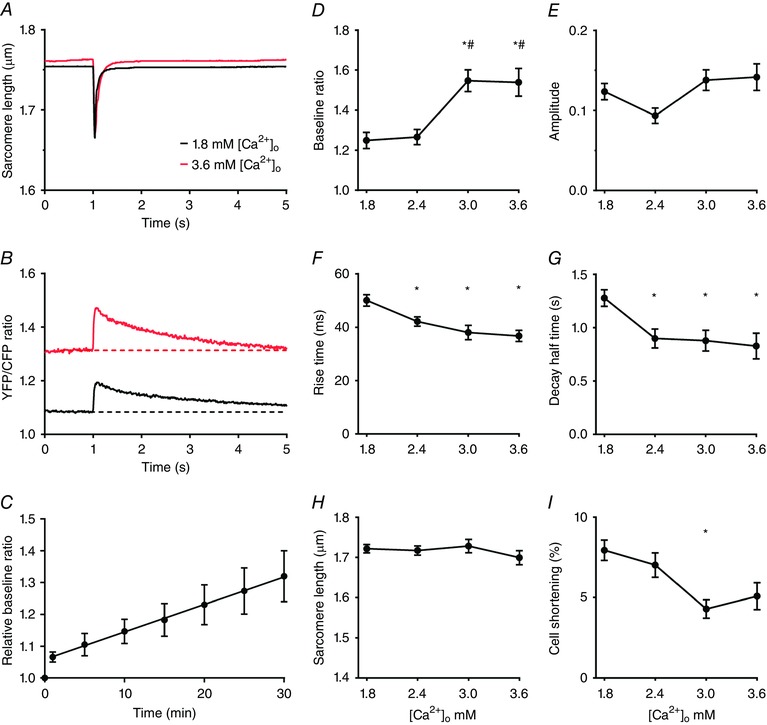
A and B, averaged recordings of sarcomere length and free mitochondrial calcium concentration (YFP/CFP ratio) from a single cardiomyocyte stimulated at 0.1 Hz at 1.8 and 3.6 mm external calcium ([Ca2+]o). The free mitochondrial calcium concentrations at baseline at 3.0 and 3.6 mm were significantly larger than at 1.8 mm. C, the rise in free mitochondrial calcium concentration upon an abrupt change in [Ca2+]o from 1.8 to 3.6 mm was time dependent (n = 4; all mean values P < 0.05 vs. t = 0 s; slope significantly larger than 0, P = 0.0001). D–G, overview of the [Ca2+]o dependence of the [Ca2+]m transient at 0.1 Hz. H and I, [Ca2+]o dependence of sarcomere length and relative cell shortening. The average values (mean ± SEM) at 1.8, 2.4, 3.0 and 3.6 mm in D–I were obtained from 50, 32, 16 and 15 different cells, respectively. * P < 0.05 vs. 1.8 mm [Ca2+]o; # P < 0.05 vs. 2.4 mm [Ca2+]o (one‐way ANOVA). [Color figure can be viewed at wileyonlinelibrary.com]
[Ca2+]m determined in quiescent cells prior to the train of stimuli at 0.1 Hz amounted to 79 nm and the maximum value reached at 3.6 mm corresponded to 0.88 μm. The maximum peak systolic calcium concentration reached during the train of stimuli at 0.1 Hz increased from 0.33 μm at 1.8 mm [Ca2+]o to 2.49 μm at 3.6 mm [Ca2+]o. An overview of the results at different external Ca2+ concentrations is given in Table 1.
Inhibition of the mitochondrial sodium–calcium exchanger
Inhibition of the mitochondrial sodium–calcium exchanger by CGP‐37157 (CGP) had no effect on sarcomere shortening (Fig. 8 A) but resulted in a significant dose‐dependent rise in [Ca2+]m at baseline (Fig. 8 B and C). The amplitude of the mitochondrial calcium transients remained the same (Fig. 8 D). A decrease in rise time of the mitochondrial calcium transient was observed, both at 1 and at 4 μm CGP (Fig. 8 E). Paradoxically a decrease in the decay half time of [Ca2+]m was observed (Fig. 8 F).
Figure 8. Inhibition of the mitochondrial mNCE by CGP‐37157 results in an increase in the mitochondrial free calcium concentration at baseline and an increase in speed of mitochondrial calcium uptake and release.
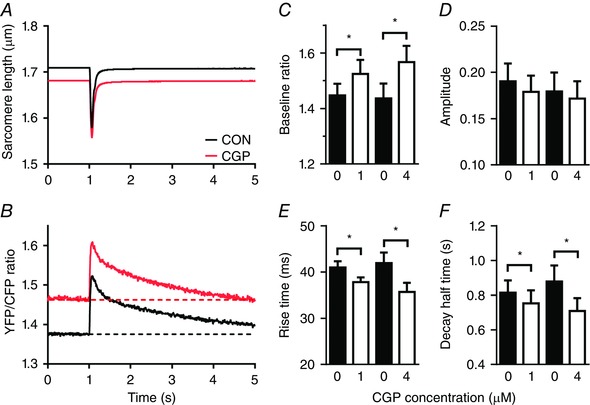
A and B, averaged sarcomere length recording and mitochondrial calcium transient from a single cardiomyocyte at 0.1 Hz in the absence (CON, black) and presence of 4 μm CGP‐37157 (CGP) (red). C, the free mitochondrial calcium concentration at baseline increased significantly relative to control (0 CGP) both at 1 and 4 μm CGP. D, the amplitude of the mitochondrial calcium transient remained unaltered both at 1 and 4 μm CGP. E and F, the rise time and the half time of the decay of the mitochondrial calcium transient at 0.1 Hz decreased significantly both at 1 and 4 μm CGP relative to control. The average values (mean ± SEM) at 0 and 1 μm CGP (n = 24) and at 0 and 4 μm CGP (n = 18) were obtained from paired observations. * P < 0.05 vs. 0 μm CGP (Student's t test). [Color figure can be viewed at wileyonlinelibrary.com]
The end‐diastolic and peak systolic calcium concentrations reached at 0.1 Hz without CGP amounted to 116 and 512 nm, respectively (at 2.4 mm [Ca2+]o). At 4 μm CGP the corresponding values amounted to 0.33 and 1.13 μm. A complete overview is given in Table 1.
In order to investigate the effects of CGP we concentrated on the decay at 0.1 Hz because this enabled us to examine the almost complete recovery phase. In three cells we studied the effect of 1 μm CGP at 1 Hz stimulation (while in one of these cells results were also obtained at 2 and 4 Hz). The data at 1 Hz can be compared with those obtained in 11 cells at 2.4 mm external calcium concentration without CGP. The decay half time without CGP amounted to 276 ± 27 ms, and in the presence of 1 μm CGP to 240 ± 42 ms (P = 0.52). This suggests that the acceleration of the decay observed at 0.1 Hz is also visible as a trend at 1 Hz.
Frequency and external calcium dependence of cytosolic calcium transients
Cytosolic calcium transients were recorded in untransfected cardiomyocytes after 2 days in culture using Fura‐4AM. An overview of the results obtained at different stimulation frequencies and at different external [Ca2+]o is shown in Figs 9 and 10. The rise time of the cytosolic calcium transients (10–15 ms) was smaller than that of the mitochondrial transients. However, at 4 Hz, the difference in rise time became rather small (∼5 ms). The cytosolic free calcium concentration at rest at 3.6 mm [Ca2+]o was larger than at 1.8 mm [Ca2+]o. However, the level reached was below the calcium levels reached during systole, because sarcomere length during diastole remained unaltered (Fig. 10 A).
Figure 9. Cytosolic calcium transients at different stimulation frequencies.
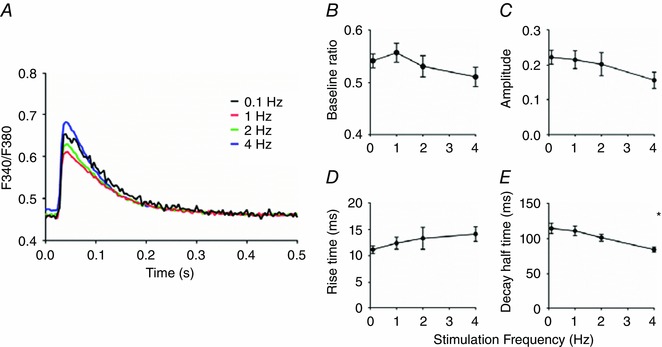
A, averaged cytosolic calcium transients (F340/F380 ratio) obtained at stimulation frequencies of 0.1, 1, 2 and 4 Hz at 1.8 mm external calcium. B–D, no significant differences were observed in baseline, amplitude or rise time of the calcium transients. E, the decay half time was significantly lower at 4 Hz compared to 0.1 Hz. The average values (mean ± SEM) at 0.1, 1, 2 and 4 Hz were obtained from 20, 21, 13 and 10 different cells, respectively. * P < 0.05 vs. 0.1 Hz (one‐way ANOVA). [Color figure can be viewed at wileyonlinelibrary.com]
Figure 10. Cytosolic calcium transients at different [Ca2+]o .
A and B, averaged recordings of sarcomere length and free cytosolic calcium concentration (F340/F380 ratio) from a single cardiomyocyte stimulated at 0.1 Hz at 1.8 and 3.6 mm external calcium ([Ca2+]o). The free cytosolic calcium concentrations at baseline at 3.0 and 3.6 mm were significantly larger than at 1.8 mm. C–F, overview of the [Ca2+]o dependence of the cytosolic calcium transient at 0.1 Hz. The average values (mean ± SEM) at 1.8, 2.4, 3.0 and 3.6 mm in C–F were obtained from 19, 21, 21 and 24 different cells, respectively. * P < 0.05 vs. 1.8 mm [Ca2+]o; # P < 0.05 vs. 2.4 mm [Ca2+]o (one‐way ANOVA). [Color figure can be viewed at wileyonlinelibrary.com]
Discussion
The main results of this study are as follows. (1) [Ca2+]m increased rapidly but the decline in [Ca2+]m was rather slow. This asymmetry caused an increase in mitochondrial calcium accumulation with stimulation frequency. (2) [Ca2+]m at baseline depended on the cytosolic calcium concentration during diastole. At 1.8 mm external calcium concentration the free calcium concentrations in the cytosol and mitochondria were similar (∼70–100 nm), but at 3.0 and 3.6 mm external calcium [Ca2+]m at baseline appeared to be larger than the cytosolic calcium concentration reached during systole. (3) The half time of the mitochondrial calcium release did not increase when the activity of the mNCE was inhibited by CGP‐37157. This suggests that mitochondrial calcium release was not solely determined by the activity of the mNCE.
Rapid mitochondrial calcium uptake and coupling between cytosolic and mitochondrial calcium concentrations
The uptake of Ca2+ by mitochondria in cardiac muscle is considered to take place via the MCU, which is in close proximity to the calcium release units. The activity of the MCU is controlled by two gatekeepers, MICU1 and MICU2 (Finkel et al. 2015). Mitochondrial calcium uptake takes place despite the relatively low calcium affinity of the MCU (K m ≈ 10–20 μm) (Denton & McCormack, 1985; Gunter & Pfeiffer, 1990), because the local calcium concentration in the microdomain near the MCU reaches larger values than the overall cytosolic calcium concentration (Szalai et al. 2000; Bers, 2002; Lu et al. 2013; Kohlhaas & Maack, 2013).
Our measurements indicate that calcium uptake by mitochondria is indeed very fast. The increase in mitochondrial Ca2+ upon electrical stimulation in a quiescent cardiomyocyte took place with a rise time (t 10‐90%) of 46 ± 4 ms and a time to peak of 94 ± 4 ms. During steady‐state stimulation at 4 Hz, which resembles the in vivo situation, Ca2+ uptake is even two times faster. These results are in qualitative agreement with studies using Rhod‐2, Mitycam and Mitycam‐E31Q (Maack et al. 2006; Liu & O'Rourke, 2008; Kettlewell et al. 2009; Haviland et al. 2014; Lu et al. 2016). To allow a more direct comparison, we converted the ratio values in Fig. 4 into calcium concentration on the basis of the calibration shown in Fig. 3 A, and fitted the decay from the maximum values attained with a single exponential. It appeared that the mean rate of decay (±SEM) increased with stimulation frequency from 0.464 ± 0.003 s−1 at 0.1 Hz to 8.0 ± 1.5 s−1 at 4 Hz. The value at 1 Hz (3.13 ± 0.11 s−1) corresponds to a time constant (τ) of 320 ms, which is larger than the time constant determined from uncalibrated Rhod‐2 signals in cardiomyocytes from guinea pig in the presence of 100 nm isoprenaline (τ ≈ 90 ms) (Maack et al. 2006).
It should be noted, however, that the probe, MitoCam, used in this study has distinct advantages in comparison to both Rhod‐2 and Mitycam. Rhod‐2 is mainly used in combination with patch‐clamp and voltage‐clamp techniques because this makes it possible to dialyse Rhod‐2 out of the cytosolic compartment. This dialysis is required to avoid the interference of calcium signals associated with the cytosolic calcium transient, but has the disadvantage that calcium buffering in the cytosolic compartment is altered and the effects of cytosolic factors, such as spermine (Ventura et al. 1994), that influence cytosolic calcium handling are washed out. Mitycam, an inverse pericam, has the disadvantage that it not a ratiometric probe and thus is sensitive to movement. It also has an approximately 10 times smaller apparent K d than MitoCam (Lu et al. 2013), which makes it more sensitive at low free mitochondrial calcium concentrations but less sensitive at the calcium concentrations reached at physiological stimulation frequencies.
It has been proposed that the mitochondrial calcium uptake is species dependent because mitochondrial transients were observed in guinea pig cardiomyocytes but not in rat cardiac myocytes (Griffiths, 1999). Certainly species differences may exist but our measurements indicate that rapid uptake of calcium in the mitochondria also occurs in rat cardiomyocytes.
The rise time of the mitochondrial calcium transient decreased from 46 ms at low stimulation frequency (0.1 Hz) to 20 ms at high stimulation frequency (4 Hz). Interestingly the amount of calcium taken up during this period is also halved (Table 1). Our measurements indicate that these values are larger than the rise times of the overall cytosolic calcium transient (12 ms at 0.1 Hz and 15 ms at 4 Hz) measured under similar experimental conditions. The kinetics of cellular calcium handling are therefore consistent with an ongoing uptake of calcium via the MCU during the decline of the cytosolic calcium transient until a local equilibrium in the free calcium concentration (across the MCU) is established or the uniporter effectively is closed.
Our experiments in which the external calcium concentration was increased showed that [Ca2+]m increased on a relatively slow time scale (∼10 min). Measurements of the cytosolic calcium concentration indicated that the resting diastolic calcium concentrations increased as well. These measurements are in agreement with previous observations of a tight correlation between the cytosolic and mitochondrial calcium levels (Maack et al. 2006). Our estimate of the [Ca2+]m at 1.8 mm [Ca2+]o (79 nm) corresponds well to estimates of the cytosolic free calcium concentration (100 nm) of Bers (2002). At 3.6 mm [Ca2+]o, [Ca2+]m amounted to 0.88 μm, which is well above the peak systolic cytosolic calcium level (∼0.5 μm).
The results of Andrienko et al. (2009) in permeabilized cells indicate that at cytosolic calcium concentration >475 nm, the mitochondrial calcium concentration is larger than the cytosolic calcium concentration. In our experiments free [Ca2+]m at 3.0 mm external [Ca2+] (∼922 nm) was considerably larger than at 2.4 mm external [Ca2+]. Although these results are in qualitative agreement with our findings, it remains to be established whether the quantitative differences between the two studies result from experimental differences (e.g. permeabilized vs. intact cells; room temperature vs. 37°C).
Mitochondrial calcium release is not solely determined by the activity of the mNCE
Our experiments at 0.1 Hz stimulation show the almost complete time course of mitochondrial calcium restitution. This restitution takes place in an exponential fashion and a half time of approximately 1.2 s. These measurements show that mitochondrial calcium release is slow in comparison to mitochondrial calcium uptake. This asymmetry results in an increase in the free calcium concentration inside the mitochondria with an increase in stimulation frequency.
In agreement with previous studies it was found that the baseline of [Ca2+]m increased by adding the specific mNCE inhibitor CGP‐37157 (Liu & O'Rourke, 2008). Our measurements indicated that the increase in baseline depended on the CGP‐37157 concentration used, which is consistent with published EC50 values (Cox et al. 1993), and suggests that the mNCE under our experimental conditions is not completely blocked.
To our surprise, the decay half time of the [Ca2+]m transient during 0.1 Hz stimulation was not increased in the presence of CGP‐37157, but instead was slightly decreased. Wei et al. (2012) observed that CGP‐37157 did not have a substantial effect on the initial slow decay of [Ca2+]m. In contrast, during 3 Hz stimulation in the presence of 0.1 μm isoprenaline, a slowing of the mitochondrial calcium restitution was observed (Maack et al. 2006). However, in the presence of isoprenaline the cytosolic calcium concentration was markedly elevated and the amplitude of the cytosolic calcium transient in the presence of 1 μm CGP‐37157 was smaller than in the absence of CGP‐37157.
Our experiments thus suggest that mitochondrial calcium release is not solely determined by the activity of the mNCE. It remains an intriguing question whether calcium release in cardiac mitochondria under physiological conditions could take place via the opening of the mitochondrial permeability transition pore (MPTP) (Bernardi, 2013). However, a recent study indicated that the transient MPTP openings occurred rather infrequently (1 in 3–83 h) (Lu et al. 2016). Experiments in the presence of the MPTP inhibitor cyclosporine A (0.5 or 1 μm; not shown) were inconclusive because the contractions became irregular.
It can be noted that the increase in the speed of recovery of the mitochondrial calcium transient in the presence of CGP‐37157 was similar to the increase observed when the extracellular calcium concentration was increased from 1.8 to 3.6 mm and that comparable increases in [Ca2+]m at baseline occurred. Therefore we propose that the prevailing effect of mNCE inhibition is an increase in the [Ca2+]m at baseline. The increase in speed rather than the expected decrease could be a side effect of the increase in [Ca2+]m at baseline and reflects an alteration in intracellular ion homeostasis in the presence of CGP‐37157.
To address this issue in more detail we converted the YFP/CFP ratios in Figs 4, 7 and 8 into calcium concentration, using the calibration curve shown in Fig. 3 A, and plotted the rate of decay of the free mitochondrial calcium concentration (d[Ca2+]m/dt) as a function of [Ca2+]m. It appeared that the steady‐state rate of decay at different stimulation frequencies and [Ca2+]m vary in a linear fashion. This suggests that the activity of the transporter involved depends on the calcium gradient between the cytosol and the mitochondrial matrix. A linear dependency was also observed in the 0.1 Hz recordings at 1.8, 2.4 and 3.6 mm external calcium and in the presence of 1 μm CGP‐37157, but marked differences in the intercepts of the relations were found, suggestive of concomitantly occurring alterations in the pH‐ and/or Na+‐gradient between cytosol and mitochondria.
Our experiments performed at 27°C showed that the decay half time was similar to the value observed at 37°C. This suggests that a non‐enzymatic process could be involved in mitochondrial calcium extrusion. It is well established that the [Ca2+]m inside the matrix is buffered by inorganic (poly)phosphate(s) (Wei et al. 2012; Smithen et al. 2013). Therefore it is possible that the speed of mitochondrial Ca2+ extrusion is not only determined by the activity of the mNCE but also by the off‐rate of Ca2+ from the putative mitochondrial calcium buffer(s). The role of phosphate buffering has recently been studied in isolated cardiac mitochondria (Wei et al. 2012). This study identified two dynamic buffering systems: one operating at relatively small [Ca2+]m (0.1–1 μm) and another, at high [Ca2+]m (2–10 μm), consistent with calcium phosphate complex formation. The maximum [Ca2+]m levels observed in our study are approximately 2–3 μm, i.e. [Ca2+]m under physiological conditions would be mainly sensitive to the low calcium buffering system. Accordingly, the very slow phase of recovery after 4 Hz stimulation lasting 10–30 min we observed could be the result of slow release of calcium from calcium phosphate complexes.
Simulation of the mitochondrial calcium concentration
A two‐compartment model was used to simulate the mitochondrial calcium transients as described by Lederer and coworkers (Boyman et al. 2013) in which the model formulations for the mNCE of Dash & Beard (2008) are used. In our calculations, cooperative properties of the MCU (Mallilankaraman et al. 2012) and the kinetics of an intramitochondrial calcium buffer were taken into account. Good agreement between the experimental results and model calculations at stimulation frequencies of 0.1 and 1 Hz (Fig. 5) was obtained using the parameter values shown in Table 2. However, it should be noted that possible changes in mitochondrial [Na+], pH and the mitochondrial membrane potential difference (ΔΨm) are not taken into account and that this model contains parameter values derived from in vitro studies on isolated mitochondria.
Our simulations indicate that the Ca2+ buffer capacity is an influential parameter shaping the time course of the mitochondrial calcium transients (Fig. 6). The optimal value obtained amounted to 2 μm, which is consistent – as discussed above – with observations in isolated mitochondria (Wei et al. 2012). The Ca2+ buffer capacity is very relevant in a discussion on the influence of Ca2+ uptake by the mitochondria on the amplitude of the cytosolic Ca2+ transient (Sedova et al. 2006; Maack et al. 2006; Drago et al. 2012). During 4 Hz stimulation the amplitude of the mitochondrial calcium transient corresponded to an estimated change in free [Ca2+]m of approximately 90 nm (Table 1). Assuming that the capacities of cytosolic and mitochondrial calcium buffers are equal (Lu et al. 2016), this value would correspond to a change in free cytosolic calcium of approximately (30/70) × 90 nm or ∼40 nm, since mitochondrial volume fraction is approximately 30%. The amplitude of the cytosolic Ca2+ transient is approximately 500 nm (Bers, 2002). Therefore our estimates indicate that under normal physiological conditions the fraction of cytosolic calcium taken up by mitochondria would correspond to 8%.
Conclusions and implications
Our experiments in which the external calcium concentration and stimulation frequency were varied and our model calculations indicate that an increase in mitochondrial calcium concentration at baseline as well as rapid mitochondrial calcium uptake on a beat‐to‐beat basis allows for adjustment of cardiac ATP production to increases in demand. Calcium uptake by the mitochondria plays an important role in the regulation of ATP production (Glancy & Balaban, 2012; Williams et al. 2013). This notion is supported by the experiments in which the effects of isoprenaline were studied. It appeared that a rather low dose of isoprenaline (24–34 nm) caused an increase in the free mitochondrial calcium concentration at baseline. The activity of dehydrogenase in the Krebs cycle determines amongst others the supply of substrates for the electron transport system and the activity of ATP synthase (F1F0‐ATPase). This regulation is considered to be very important for matching energy supply and demand, for instance upon changes in heart rate (Cortassa et al. 2006). The activity of several substrate transporters and dehydrogenases in the Krebs cycle is sensitive to changes in mitochondrial calcium concentration (e.g. Jouaville et al. 1999; Cortassa et al. 2009; Glancy & Balaban, 2012). However, further research is warranted to establish whether these processes are fast enough to allow a matching of energy supply and demand by the mitochondria during a single heart beat.
An intriguing observation was the lack of an increase in the decay half time of the free mitochondrial calcium concentration upon inhibition of the mNCE. Our experiments suggest that mitochondrial calcium extrusion via the mNCE is important in determining the free mitochondrial calcium concentration at baseline. Under physiological conditions in vivo the free mitochondrial calcium concentration appeared to be controlled by the low calcium buffering system. Mitochondrial calcium release thus depends on mNCE activity as well as mitochondrial calcium buffering. It is unclear, however, whether the intricate dynamics of the mitochondrial calcium buffering system(s) are sufficient to explain mitochondrial calcium release or additional fast calcium extrusion mechanisms are present.
Our measurements suggest that under physiological conditions the fraction of cytosolic calcium taken up by mitochondria is relatively small. However, an increase in cytosolic calcium concentration caused a marked increase in the mitochondrial calcium concentration at baseline. This indicates that mitochondrial calcium handling may gain importance under pathophysiological conditions such as ischaemia and reperfusion, which result in calcium overload of the cardiomyocyte.
Appendix
Model simulations
The model simulations are based on a simplified model of mitochondrial calcium uptake and release using the model of Lederer and co‐workers as a starting point (Boyman et al. 2013). This model was extended by taking the kinetics of binding to an intramitochondrial calcium buffer (B) and the cooperative regulation of the mitochondrial calcium uniporter (Mallilankaraman et al. 2012) into account (Fig. A1).
The cytosolic calcium transient can be approximated by
| (A1) |
with t 1 = 73 ms and t 2 = 5 ms (cf. Fig. 9). Note that the maximum value of the transient (∼2.5 × 10⁻⁶ m) is increased with respect to the global rise in cytosolic calcium in order to account for the change in local calcium concentration near the MCU (Boyman et al. 2013).
Assuming the mitochondrial calcium concentration is buffered with kinetics k on and k off, a total buffer concentration B tot and a total mitochondrial calcium concentration (bound and unbound; [Ca2+]m,tot), mitochondrial calcium handling can be described by a system of two coupled ordinary differential equations:
| (A2) |
| (A3) |
with:
| (A4) |
and assuming a stoichiometry for the mNCE of 3:1 (Dash & Beard, 2008)
| (A5) |
At t = 0 s, the system is in steady state and eqns (A2) and (A3) both equal 0 and the calcium fluxes via the MCU and mNCE are in equilibrium. Therefore from eqns (A4) and (A5) defines J offset. [Ca2 + ]m, tot(0) can be calculated from eqn (A3). The calculations were performed in MATLAB (The MathWorks Inc.) using the ode23s solver.
Additional information
Competing interests
M.H. is a shareholder in IonOptix LLC (Milton, MA, USA). The other authors have no competing interests.
Author contributions
The experiments were performed in the Department of Physiology, VU University Medical Center, Amsterdam, the Netherlands. G.J.M.S. and R.C.I.W. were involved in the conception and design of the project, analysed data and wrote the manuscript; M.H. and R.J.P.M. were involved in the acquisition of the data and revised the manuscript; J.L.M. was involved in the construction of the mitochondrial calcium probe and revised the manuscript; T.J.T.v.d.W. was involved in model calculations and revised the manuscript; J.v.d.V. was involved in the conception of the project and revised the manuscript. All authors approved the final version of the manuscript and agree to be accountable for all aspects of the work in ensuring that questions related to the accuracy or integrity of any part of the work are appropriately investigated and resolved. All those who qualify for authorship are listed and all persons designated as authors qualify for authorship.
Funding
This study was supported by grants from the Dutch Heart Foundation CVON (Cardiovasculair Onderzoek Nederland) (ARENA) and the European Commission (FP7‐Health‐2010, MEDIA, no. 261409) to J.v.d.V. and G.J.M.S.
Acknowledgements
We would like to thank M. Goebel and J. Kole for technical assistance and K. de Bruin, E. Kooreman and A. van Schelt for their efforts in the initial model calculations.
References
- Andrienko TN, Picht E, Bers DM (2009). Mitochondrial free calcium regulation during sarcoplasmic reticulum calcium release in rat cardiac myocytes. J Mol Cell Cardiol 46, 1027–1036. [DOI] [PMC free article] [PubMed] [Google Scholar]
- Barth E, Stämmler G, Speiser B & Schaper J (1992). Ultrastructural quantitation of mitochondria and myofilaments in cardiac muscle from 10 different animal species including man. J Mol Cell Cardiol 24, 669–681. [DOI] [PubMed] [Google Scholar]
- Bernardi P (2013). The mitochondrial permeability transition pore: a mystery solved? Front Physiol 4, 95. [DOI] [PMC free article] [PubMed] [Google Scholar]
- Bers DM (2002). Cardiac excitation‐contraction coupling. Nature 415, 198–205. [DOI] [PubMed] [Google Scholar]
- Bovo E, Martin JL, Tyryfter J, de Tombe PP & Zima AV (2016). R‐CEPIA1er as a new tool to directly measure sarcoplasmic reticulum [Ca] in ventricular myocytes. Am J Physiol Heart Circ Physiol 311, H268–H275. [DOI] [PMC free article] [PubMed] [Google Scholar]
- Boyman L, Chikando AC, Williams GSB, Khairallah RJ, Kettlewell S, Ward CW, Smith GL, Kao JP & Lederer WJ (2014). Calcium movement in cardiac mitochondria. Biophys J 107, 1289–1301. [DOI] [PMC free article] [PubMed] [Google Scholar]
- Boyman L, Williams GSB, Khananshvili D, Sekler I & Lederer WJ (2013). NCLX: the mitochondrial sodium calcium exchanger. J Mol Cell Cardiol 59, 205–213. [DOI] [PMC free article] [PubMed] [Google Scholar]
- Cortassa S, Aon MA, O'Rourke B, Jacques R, Tseng H‐J, Marbán E & Winslow RL (2006). A computational model integrating electrophysiology contraction and mitochondrial bioenergetics in the ventricular myocyte. Biophys J 91, 1564–1589. [DOI] [PMC free article] [PubMed] [Google Scholar]
- Cortassa S, O'Rourke B, Winslow RL & Aon MA (2009). Control and regulation of mitochondrial energetics in an integrated model of cardiomyocyte function. Biophys J 96, 2466–2478. [DOI] [PMC free article] [PubMed] [Google Scholar]
- Cox DA, Conforti L, Sperelakis N & Matlib MA (1993). Selectivity of inhibition of Na+‐Ca2+ exchange of heart mitochondria by benzothiazepine CGP‐37157. J Cardiovasc Pharmacol 21, 595–599. [DOI] [PubMed] [Google Scholar]
- Dash RK & Beard DA (2008). Analysis of cardiac mitochondrial Na+–Ca2+ exchanger kinetics with a biophysical model of mitochondrial Ca2+ handling suggests a 3:1 stoichiometry. J Physiol 586, 3267–3285. [DOI] [PMC free article] [PubMed] [Google Scholar]
- Denton RM & McCormack JG (1985). Ca2+ transport by mammalian mitochondria and its role in hormone action. Am J Physiol 249, E543–E554. [DOI] [PubMed] [Google Scholar]
- Dorn GW & Maack C (2013). SR and mitochondria: calcium cross‐talk between kissing cousins. J Mol Cell Cardiol 55, 42–49. [DOI] [PubMed] [Google Scholar]
- Drago I, De Stefani D, Rizzuto R & Pozzan T (2012). Mitochondrial Ca2+ uptake contributes to buffering cytoplasmic Ca2+ peaks in cardiomyocytes. Proc Natl Acad Sci USA 109, 12986–12991. [DOI] [PMC free article] [PubMed] [Google Scholar]
- Filippin L, Abad MC, Gastaldello S, Magalhães PJ, Sandonà D & Pozzan T (2005). Improved strategies for the delivery of GFP‐based Ca2+ sensors into the mitochondrial matrix. Cell Calcium 37, 129–136. [DOI] [PubMed] [Google Scholar]
- Finkel T, Menazza S, Holmström KM, Parks RJ, Liu J, Sun J, Liu J, Pan X & Murphy E (2015). The ins and outs of mitochondrial calcium. Circ Res 116, 1810–1819. [DOI] [PMC free article] [PubMed] [Google Scholar]
- Fowler ED, Benoist D, Drinkhill MJ, Stones R, Helmes M, Wüst RCI, Stienen GJM, Steele DS & White E (2015). Decreased creatine kinase is linked to diastolic dysfunction in rats with right heart failure induced by pulmonary artery hypertension. J Mol Cell Cardiol 86, 1–8. [DOI] [PMC free article] [PubMed] [Google Scholar]
- Franzini‐Armstrong C (2007). ER‐mitochondria communication. How privileged? Physiology (Bethesda) 22, 261–268. [DOI] [PubMed] [Google Scholar]
- Glancy B & Balaban RS (2012). Role of mitochondrial Ca2+ in the regulation of cellular energetics. Biochemistry 51, 2959–2973. [DOI] [PMC free article] [PubMed] [Google Scholar]
- Griffiths EJ (1999). Species dependence of mitochondrial calcium transients during excitation‐contraction coupling in isolated cardiomyocytes. Biochem Biophys Res Commun 263, 554–559. [DOI] [PubMed] [Google Scholar]
- Gunter TE & Pfeiffer DR (1990). Mechanisms by which mitochondria transport calcium. Am J Physiol 258, C755–C786. [DOI] [PubMed] [Google Scholar]
- Haviland S, Cleemann L, Kettlewell S, Smith GL & Morad M (2014). Diversity of mitochondrial Ca2+ signaling in rat neonatal cardiomyocytes: evidence from a genetically directed Ca2+ probe mitycam‐E31Q. Cell Calcium 56, 133–146. [DOI] [PMC free article] [PubMed] [Google Scholar]
- Hüser J, Blatter LA & Sheu SS (2000). Mitochondrial calcium in heart cells: beat‐to‐beat oscillations or slow integration of cytosolic transients? J Bioenerg Biomembr 32, 27–33. [DOI] [PubMed] [Google Scholar]
- Jouaville LS, Pinton P, Bastianutto C, Rutter GA & Rizzuto R (1999). Regulation of mitochondrial ATP synthesis by calcium: evidence for a long‐term metabolic priming. Proc Natl Acad Sci USA 96, 13807–13812. [DOI] [PMC free article] [PubMed] [Google Scholar]
- Kaestner L, Scholz A, Hammer K, Vecerdea A, Ruppenthal S & Lipp P (2009). Isolation and genetic manipulation of adult cardiac myocytes for confocal imaging. J Vis Exp; DOI:10.3791/1433. [DOI] [PMC free article] [PubMed] [Google Scholar]
- Kaestner L, Scholz A, Tian Q, Ruppenthal S, Tabellion W, Wiesen K, Katus HA, Müller OJ, Kotlikoff MI & Lipp P (2014). Genetically encoded Ca2+ indicators in cardiac myocytes. Circ Res 114, 1623–1639. [DOI] [PubMed] [Google Scholar]
- Kettlewell S, Cabrero P, Nicklin SA, Dow JAT, Davies S & Smith GL (2009). Changes of intra‐mitochondrial Ca2+ in adult ventricular cardiomyocytes examined using a novel fluorescent Ca2+ indicator targeted to mitochondria. J Mol Cell Cardiol 46, 891–901. [DOI] [PubMed] [Google Scholar]
- Kohlhaas M & Maack C (2013). Calcium release microdomains and mitochondria. Cardiovasc Res 98, 259–268. [DOI] [PubMed] [Google Scholar]
- Liu T & O'Rourke B (2008). Enhancing mitochondrial Ca2+ uptake in myocytes from failing hearts restores energy supply and demand matching. Circ Res 103, 279–288. [DOI] [PMC free article] [PubMed] [Google Scholar]
- Lu X, Ginsburg KS, Kettlewell S, Bossuyt J, Smith GL & Bers DM (2013). Measuring local gradients of intramitochondrial [Ca2+] in cardiac myocytes during sarcoplasmic reticulum Ca2+ release. Circ Res 112, 424–431. [DOI] [PMC free article] [PubMed] [Google Scholar]
- Lu X, Kwong JQ, Molkentin JD & Bers DM (2016). Individual cardiac mitochondria undergo rare transient permeability transition pore openings. Circ Res 118, 834–841. [DOI] [PMC free article] [PubMed] [Google Scholar]
- Maack C, Cortassa S, Aon MA, Ganesan AN, Liu T & O'Rourke B (2006). Elevated cytosolic Na+ decreases mitochondrial Ca2+ uptake during excitation‐contraction coupling and impairs energetic adaptation in cardiac myocytes. Circ Res 99, 172–182. [DOI] [PMC free article] [PubMed] [Google Scholar]
- Maack C & O'Rourke B (2007). Excitation‐contraction coupling and mitochondrial energetics. Basic Res Cardiol 102, 369–392. [DOI] [PMC free article] [PubMed] [Google Scholar]
- Mallilankaraman K, Doonan P, Cárdenas C, Chandramoorthy HC, Müller M, Miller R, Hoffman NE, Gandhirajan RK, Molgó J, Birnbaum MJ, Rothberg BS, Mak D‐OD, Foskett JK & Madesh M (2012). MICU1 is an essential gatekeeper for MCU‐mediated mitochondrial Ca2+ uptake that regulates cell survival. Cell 151, 630–644. [DOI] [PMC free article] [PubMed] [Google Scholar]
- Olivetti G, Quaini F, Lagrasta C, Ricci R, Tiberti G, Capasso JM & Anversa P (1992). Myocyte cellular hypertrophy and hyperplasia contribute to ventricular wall remodeling in anemia‐induced cardiac hypertrophy in rats. Am J Pathol 141, 227–239. [PMC free article] [PubMed] [Google Scholar]
- O'Rourke B & Blatter LA (2009). Mitochondrial Ca2+ uptake: tortoise or hare? J Mol Cell Cardiol 46, 767–774. [DOI] [PMC free article] [PubMed] [Google Scholar]
- Palmer AE, Giacomello M, Kortemme T, Hires SA, Lev‐Ram V, Baker D & Tsien RY (2006). Ca2+ indicators based on computationally redesigned calmodulin‐peptide pairs. Chem Biol 13, 521–530. [DOI] [PubMed] [Google Scholar]
- Palmer AE & Tsien RY (2006). Measuring calcium signaling using genetically targetable fluorescent indicators. Nat Protoc 1, 1057–1065. [DOI] [PubMed] [Google Scholar]
- Papp Z, Szabó A, Barends JP & Stienen GJM (2002). The mechanism of the force enhancement by MgADP under simulated ischaemic conditions in rat cardiac myocytes. J Physiol 543, 177–189. [DOI] [PMC free article] [PubMed] [Google Scholar]
- Scorzeto M, Giacomello M, Toniolo L, Canato M, Blaauw B, Paolini C, Protasi F, Reggiani C & Stienen GJM (2013). Mitochondrial Ca2+‐handling in fast skeletal muscle fibers from wild type and calsequestrin‐null mice. PLoS One 8, e74919. [DOI] [PMC free article] [PubMed] [Google Scholar]
- Sedova M, Dedkova EN & Blatter LA (2006). Integration of rapid cytosolic Ca2+ signals by mitochondria in cat ventricular myocytes. Am J Physiol Cell Physiol 291, C840–C850. [DOI] [PubMed] [Google Scholar]
- Smithen M, Elustondo PA, Winkfein R, Zakharian E, Abramov AY & Pavlov E (2013). Role of polyhydroxybutyrate in mitochondrial calcium uptake. Cell Calcium 54, 86–94. [DOI] [PMC free article] [PubMed] [Google Scholar]
- Szabadkai G & Duchen MR (2008). Mitochondria: the hub of cellular Ca2+ signaling. Physiology (Bethesda) 23, 84–94. [DOI] [PubMed] [Google Scholar]
- Szalai G, Csordás G, Hantash BM, Thomas AP & Hajnóczky G (2000). Calcium signal transmission between ryanodine receptors and mitochondria. J Biol Chem 275, 15305–15313. [DOI] [PubMed] [Google Scholar]
- Tian Q, Pahlavan S, Oleinikow K, Jung J, Ruppenthal S, Scholz A, Schumann C, Kraegeloh A, Oberhofer M, Lipp P & Kaestner L (2012). Functional and morphological preservation of adult ventricular myocytes in culture by sub‐micromolar cytochalasin D supplement. J Mol Cell Cardiol 52, 113–124. [DOI] [PubMed] [Google Scholar]
- Ventura C, Ferroni C, Flamigni F, Stefanelli C & Capogrossi MC (1994). Polyamine effects on [Ca2+]i homeostasis and contractility in isolated rat ventricular cardiomyocytes. Am J Physiol 267, H587–H592. [DOI] [PubMed] [Google Scholar]
- Wei A‐C, Liu T, Winslow RL & O'Rourke B (2012). Dynamics of matrix‐free Ca2+ in cardiac mitochondria: two components of Ca2+ uptake and role of phosphate buffering. J Gen Physiol 139, 465–478. [DOI] [PMC free article] [PubMed] [Google Scholar]
- Williams GSB, Boyman L, Chikando AC, Khairallah RJ & Lederer WJ (2013). Mitochondrial calcium uptake. Proc Natl Acad Sci USA 110, 10479–10486. [DOI] [PMC free article] [PubMed] [Google Scholar]