

Abstract
Introduction
The Forced‐choice Graphics Memory Test (FGMT) is a newly developed measure to assess feigned cognitive impairment. This study investigated the ability and reliability of FGMT for identification of malingering in patients with traumatic brain injury (TBI).
Methods
The FGMT was administered to 40 healthy volunteers instructed to respond validly (Healthy Control, H‐C), 40 healthy volunteers instructed to feign cognitive impairment (Healthy Malingering, H‐M), 40 severe TBI patients who responded validly (TBI control, TBI‐C), and 30 severe TBI patients who evidenced invalid performance (TBI malingering, TBI‐M).
Results
Both malingering groups (H‐M and TBI‐M) performed much more poorly than the nonmalingering groups (H‐C and TBI‐C). The FGMT overall total score, score on easy items, and score on hard items differed significantly across the four groups. The total score showed the highest classification accuracy in differentiating malingering from nonmalingering. A cutoff of less than 18 (total items) successfully identified 95% of TBI‐C and 93.3% of TBI‐M participants. The FGMT also demonstrated high test–retest reliability and internal consistency. FGMT scores were not affected by TBI patients' education, gender, age, or intelligence.
Conclusion
Our results suggest that the FGMT can be used as a fast and reliable tool for identification of feigned cognitive impairment in patients with TBI.
Keywords: malingering, performance validity, response bias
1. Introduction
In the diagnostic and statistical manual of mental disorders, fifth edition, malingering means that people are faking or really embellishing physical or psychological symptoms. People who are malingering do this “consciously” because there is an external incentive to do so (e.g., avoiding military duty or work, obtaining financial compensation, evading criminal prosecution, or obtaining drugs; American Psychiatric Association, 2013). Recently, malingering is one of the main issues presented in neuropsychological literatures (Sweet, King, Malina, Bergman, & Simmons, 2002; Vilar‐Lopez et al., 2007).
Traumatic brain injury (TBI) can result in cognitive impairment (Jennekens, de Casterle, & Dobbels, 2010; Miotto et al., 2010). Typically, neuropsychological evaluation is used to characterize the level and pattern of cognitive impairment for those who have sustained a TBI (Finnanger et al., 2013; Hellawell, Taylor, & Pentland, 1999; Satz et al., 1998). TBI is often the result of accidents that may involve litigation or secondary gain (Sweet, Goldman, & Guidotti Breting, 2013). These factors have been shown to influence the validity of one's performance on neuropsychological tests (Gouse, Thomas, & Solms, 2013). Numerous studies have shown that lower neuropsychological performance in patients with TBI may, in many cases, be accounted for by invalid effort rather than low ability (Flaro, Green, & Robertson, 2007; Green, Iverson, & Allen, 1999). Therefore, it is especially important to assess performance validity in TBI patients. It is estimated that 40%–60% of patients with TBI may malinger cognitive impairments during disability compensation evaluations (Larrabee, 2005; Mittenberg, Patton, Canyock, & Condit, 2002).
A variety of performance validity tests (PVTs) are available to assess poor effort or response bias (Frazier, Youngstrom, Naugle, Haggerty, & Busch, 2007; Hiscock & Hiscock, 1989; Vagnini, Berry, Clark, & Jiang, 2008; Van Dyke, Millis, Axelrod, & Hanks, 2013; Wisdom, Brown, Chen, & Collins, 2012). These PVTs include both formal tests developed specifically for the purpose of detecting poor effort as well as measures that are embedded into other neuropsychological tests. Tests of effort can also be separated into “forced‐choice” versus nonforced‐choice. Forced‐choice effort measures were originally developed with the idea that if a patient performed significantly below chance, they must know the correct answer and intentionally choose the wrong answer, indicating a purposeful attempt to appear more impaired than they actually are. Vickery and Berry conducted a meta‐analysis on PVTs (Vickery, Berry, Inman, Harris, & Orey, 2001). In their analysis, the Hiscock Digit Memory Test (DMT), which is based on a binomial forced‐choice paradigm, had the highest sensitivity to detect poor effort as well as the best overall classification rates. In another meta‐analysis published by Sollman and Berry (2011), Victoria Symptom Validity Test, which is a computerized version of forced‐choice DMT, was employed as “an anchor” to evaluate the utility of the previously reviewed tests by Vickery and Berry.
Forced‐choice tests were first described by Binder and Pankratz (1987). They presented a case of a 53‐year‐old woman who was suspected of invalid responding. They gave her the task of indicating whether a black pen or a yellow pencil had been presented in the prior trial. The patient was accurate for 37 of the 100 trials, which was significantly worse than chance, and consistent with the assertion of her responding invalidly. Based on Pankratz's test, Hiscock and Hiscock (1989) modified the procedure and developed the DMT. In this test, patients are asked to identify which of two five‐digit numbers is identical to a number shown seconds earlier. The test is divided into three segments, each with a different delay length: 5, 10, and 15 s. The patient is informed about the increase in delay time and it is suggested that this will make the task more difficult. Although DMT was developed to appear more difficult than other versions of forced‐choice tests designed to identify feigning of a memory deficit, it is so simple that very few malingerers will perform at below chance levels. Research has been conducted with forced‐choice tests to determine alternate criteria to distinguish malingerers from nonmalingerers such as performance‐level criteria (Loring, Larrabee, Lee, & Meador, 2007). Guilmette, Hart, Giuliano, and Leininger (1994), for example, determined that a score below 90% correct on the DMT is consistent with invalid performance. The Test of Memory Malingering (TOMM; Tombaugh, 1996), a forced‐choice visual recognition memory test, is another commonly used PVT for detection of malingering in forensic setting (Slick, Tan, Strauss, & Hultsch, 2004). The TOMM also yields great classification ability for detecting insufficient effort (Love, Glassmire, Zanolini, & Wolf, 2014; O'Bryant & Lucas, 2006).
There is abundant research evidence that cognitive effort tests are extremely useful, especially in forensic settings (Fox, 2011; Green, 2007; Green, Rohling, Iverson, & Gervais, 2003; Green, Rohling, Lees‐Haley, & Allen, 2001). However, there are still some unresolved issues that need to be addressed, such as the influence of the patient's intellectual level and psychiatric status on PVTs (Avila et al., 2009; Shandera et al., 2010). It has also been noted that patients with TBI may have difficulty with PVTs for a myriad of other reasons, including education level, attention impairments, or receptive language impairments (Schroeder, Twumasi‐Ankrah, Baade, & Marshall, 2012; Woods et al., 2011).
In instances where litigation is involved, lawyers may instruct their clients about PVTs (Lezak, Howieson, Bigler, & Tranel, 2012). Studies have investigated the effect of coaching on various types of malingering tests, such as Computerized Assessment of Response Bias‐97 (CARB‐97) and Word Memory Test (Dunn, Shear, Howe, & Ris, 2003), Rey's 15‐Item Test and Dot Counting Test (Erdal, 2004), Portland Digit Recognition Test (Gunstad & Suhr, 2001), Category Test (DiCarlo, Gfeller, & Oliveri, 2000), Medical Symptom Validity Test and the Amsterdam Short‐Term Memory Test (Merten, Green, Henry, Blaskewitz, & Brockhaus, 2005), and Short‐Term‐Memory Test from the Bremer Symptom‐Validierung (Russeler, Brett, Klaue, Sailer, & Munte, 2008). Coached malingering was difficult to detect using these various tests. Coached malingerers, especially those coached with the symptom plus test information, were more likely to be misclassified as nonmalingerers than uncoached malingerers. The Internet also provides an easy way for patients to gain familiarity with PVTs, making their noncredible performance harder to detect (Castiel, Alderman, Jenkins, Knight, & Burgess, 2012; Frederick & Speed, 2007). Therefore, it is important to develop newer PVTs.
To this end, we developed the Forced‐choice Graphics Memory Test (FGMT). The FGMT utilizes the two‐alternative forced‐choice paradigm and consists of figural stimuli, which are supposed to be more on an intuitive basis than digits and not susceptible to aforementioned factors such as intellectual level and educational experience (Chakrabarti & Banerjee, 2013; Mungkhetklang, Crewther, Bavin, Goharpey, & Parsons, 2016; Paivio, 1971). This study evaluates the usefulness of the FGMT for identifying valid and invalid performances.
2. Methods
2.1. Participants
The study included four groups of right‐handed participants. The first group consisted of 40 college students and staff members who were instructed to give their best effort (Healthy Control, H‐C). The second group consisted of 40 college students and staff members who were instructed to feign invalid responding (Healthy Malingering, H‐M). The participants of both healthy groups were recruited from Tongji Medical College of Huazhong University of Science and Technology via advertisement. Medical records of these healthy participants were collected, excluding those with psychiatric or neurologic disorders. The H‐M participants were instructed to imagine that they sustained a TBI as a result of a motor vehicle accident 6 months ago and were currently involved in litigation to obtain financial compensation for their injury. They were told that an associated neuropsychological evaluation was going to take place and worse performance on the tests would contribute to a greater amount of injury compensation. They were additionally told to feign the TBI symptoms of headache, dizziness, hypomnesia, or unresponsiveness and to get low scores on tasks by reduced engagement in the tasks or by providing incorrect response. All of the TBI participants were recruited from a forensic medicine clinic of Tongji Medical College. They were referred for forensic evaluations (i.e., litigation, compensation seeking, or disability) and met the following inclusion criteria: (1) The TBI was sustained 6–12 months prior to participation in the study with clinical treatment having been completed; (2) Positive brain imaging findings of brain injury; (3) The lowest recorded Glasgow Coma Scale (Teasdale & Jennett, 1976) score in the first 6 hr on first admission without the presence of sedatives and paralytics in the range of 3–8; and (4) A negative preinjury history of psychiatric or neurologic disorders. A participant was specifically placed in the TBI Control (TBI‐C) group if they met these additional criteria: (1) Two forensic psychiatry experts conducting separate evaluations agreed that the person with TBI was presenting validly; and (2) the participant passed a forced‐choice measure, viz., the Binomial Forced‐Choice Digit Memory Test (BFDMT). The TBI‐C group consisted of 40 participants and they were instructed to give their best effort. The fourth group, TBI Malingering (TBI‐M) group, consisted of 30 participants who met the Slick criteria for Malingered Neurocognitive Dysfunction (MND; Slick, Sherman, & Iverson, 1999). The four criteria for the determination of MND are: (A) At least one clearly identifiable and substantial external incentive for exaggeration or fabrication of symptoms is present at the time of examination; (B) Evidence of exaggeration or fabrication of cognitive dysfunction on neuropsychological tests; (C) Significant inconsistencies or discrepancies in the patient's self‐reported symptoms that suggest a deliberate attempt to exaggerate or fabricate cognitive deficits; and (D) Behaviors meeting the necessary B or C criteria not fully accounted for by psychiatric, neuropsychological, or developmental disorders that result in significantly diminished capacity to appreciate laws or mores against malingering, or inability to conform behavior to such standards. On the basis of these four criteria, patients can be classified as: not malingering, definite MND, probable MND, or possible MND. In this study, only those patients who met the criteria of definite MND were recruited. Criterion B for this study was considered satisfied as all the members of the group showed a negative response bias on the BFDMT, that is, they each performed significantly below chance; Criterion C for this study was considered satisfied for each participant in this group as two forensic experts conducting separate evaluations agreed that the person with TBI was feigning due to the inconsistencies or discrepancies in participant's self‐report histories, and symptoms or performance across neuropsychological testing. The study protocol was approved by the Ethics Committee of Huazhong University of Science and Technology.
Informed consent was obtained from the participants after they had been given an explanation of the study. The individuals were informed that they would undergo several neuropsychological tests, and the data may be used for scientific analysis while maintaining their confidentiality.
2.2. Binomial Forced‐choice Digit Memory Test
The BFDMT is a PVT. Each participant completed the BFDMT, a revised version of the DMT developed by Liu, Gao, and Li, (2001). This test has been shown to have an overall accuracy of 95%, false‐positive rate of 1%, and false‐negative rate of 4% when healthy simulators were differentiated from healthy controls (Liu et al., 2001). The BFDMT is a commonly used PVT in China (Liu et al., 2001) and has been validated in different populations such as mental retardation, TBI, schizophrenia, and the elderly with cognitive impairment (Chu et al., 2010; Gao, Liu, Ding, Li, & Sheng, 2002; Gao, Yang, Ding, Li, & Sheng, 2003; Zhang, Liu, Chu, Li, & Chen, 2009). It is largely based on the binomial theorem. The test consists of 24 items, each of which consists of one stimulus card containing a single five‐digit number and a corresponding recognition card containing two five‐digit numbers. Each stimulus card is presented on the computer for 5 s, and is immediately followed by a recognition card. There are 12 easy items and 12 hard items based on the degree of similarity between the two five‐digit numbers presented on the recognition card. The more similar numbers comprised the hard items and the more different numbers comprised the easy items.
2.3. Forced‐choice Graphics Memory Test
The FGMT is a PVT that is modeled after the BFDMT. This task also consists of 24 items, each of which consists of one stimulus card and one corresponding recognition card. Each stimulus card contains one black and white design. Each design is round with a 6.5 cm diameter and 500 × 500 pixels. For each stimulus card, there is a corresponding recognition card containing two designs presented side‐by‐side. One of the designs matches the original design presented on the stimulus card (i.e., the target) and the other one is a distractor. The left‐or‐right side location of the target design was selected randomly. Each stimulus card was presented on a computer screen for 5 s, and was followed by the presentation of the corresponding recognition card after a 5 s retention period. The participants were asked to identify which design he or she had just viewed. According to the degree to which the two designs were similar on the recognition card, cards were classified as easy (i.e., less similar) or hard (i.e., more similar). Three of the authors ranked the similarity of 60 cards separately and classified into easy and hard cards. Then 12 easy cards and 12 hard cards that all of the three authors agreed were selected for the test. Sample items are shown in Figure 1. The order in which the cards were presented was random. Each item resulted in a score of 1 for a correct recognition of the target or 0 for an incorrect answer. Three scores were computed for each participant: total score, easy item score, hard item score. Test administration time was generally 5–10 min.
Figure 1.

The sample cards of Forced‐choice Graphics Memory Test
2.4. Wechsler Adult Intelligence Scale‐III Chinese version (WAIS‐RC)
Intellectual testing was carried out post‐PVT performance using the WAIS‐RC (Yao, Chen, Jiang, & Tam, 2007). The Verbal IQ, Performance IQ, and Full IQ were calculated for each participant.
2.5. Procedure
Demographic information and medical history were gathered for all participants. After completing the consent form, each participant was administered the BFDMT for classification. Then all participants were given instructions that varied by group. The H‐C group was asked to perform optimally during the tests. The H‐M group was given the information of TBI and post‐TBI cognitive impairment. This group was instructed to feign memory impairment during the tests for getting more compensation. After the instructions, other neuropsychological testing that, in part, included the FGMT and WAIS‐RC were administrated. For the TBI participants, an interview with two forensic psychiatrists was performed initially. In order to measure the reliability and consistency of FGMT, 20 TBI‐C and 20 TBI‐M participants completed the FGMT again a week later.
2.6. Statistical analysis
Data are expressed as mean ± SD. Correlation analysis between BFDMT total score and FGMT total score, easy item score, and hard item score were performed using Pearson's analysis. The sensitivity, specificity, predictive power, overall hit rate, and internal consistency for each of the FGMT indices were calculated. Comparisons of differences in FGMT indices were performed using Kruskal–Wallis one‐way ANOVAs followed by post hoc analysis for multiple groups.
3. Results
3.1. Characteristics of the participants
The brain injuries of TBI participants were caused by various events including traffic accidents (74%), falls (17%), assault (6%), and other reasons (3%). The majority of the patients presented with lesions in the frontal and temporal region (frontal lobes, 40%; temporal lobes, 21%; fronto‐temporal lobes, 17%). The remaining 22% presented with lesions in occipital and parietal region. Mann–Whitney test did not reveal significant differences in the duration of loss of consciousness (LOC) or post‐traumatic amnesia (PTA) between TBI‐C and TBI‐M group. The median duration of LOC in patients of TBI‐C and TBI‐M group was 8 days and 9 days, respectively (p = .91), and all the patients have a PTA of 24 hr or more (median 18 days and 15 days in TBI‐C and TBI‐M group, respectively, p = .39). None of the TBI participants in this study had received systematic cognitive rehabilitation following injury.
The demographic information for each group is presented in Table 1. Chi‐square analysis did not reveal significant differences in the proportion of males and females among the groups. Analysis of variance did reveal significant differences in age and education level for the TBI groups compared to the healthy groups. Multiple comparison testing revealed that the healthy subjects were significantly younger, more educated, and had higher IQ than the TBI groups. However, no difference in age, education level, and intelligence was found between TBI‐C and TBI‐M groups.
Table 1.
Demographic characteristics of the participants
| Group | N | Gender (% male) | Age (years) | Education (years) | Intelligence (IQ value) |
|---|---|---|---|---|---|
| H‐C | 40 | 50 | 25.38 ± 3.32 | 15.78 ± 2.11 | 114.53 ± 5.64 |
| H‐M | 40 | 50 | 25.60 ± 4.40 | 15.58 ± 2.24 | 113.13 ± 5.41 |
| TBI‐C | 40 | 55 | 29.28 ± 8.11 | 9.06 ± 3.57 | 75.45 ± 7.35 |
| TBI‐M | 30 | 60 | 30.90 ± 7.03 | 8.27 ± 3.32 | 79.03 ± 10.07 |
H‐C, Healthy Control; H‐M, Healthy Malingering; TBI‐C, traumatic brain injury‐control; TBI‐M, traumatic brain injury‐malingering.
3.2. FGMT results
Between groups Kruskal–Wallis one‐way ANOVA for the easy item score, hard item score, and total score on the FGMT were all significant (each p < .01). Post hoc analysis revealed that the malingering groups performed significantly worse than the control groups. There was no difference in easy item score, hard item score, or total score between the H‐M and TBI‐M groups (p = .20, .08, and .05, respectively) or between the TBI‐C and the H‐C group (p = .44, .63, and .68, respectively). The results for each group on the FGMT are presented in Table 2.
Table 2.
Forced‐choice Graphics Memory Test results in H‐C, H‐M, TBI‐C, TBI‐M
| Group | Mean ± SD | Mean rank | Kruskal–Wallis | p‐Value | |
|---|---|---|---|---|---|
| Easy item score | H‐C | 12.00 ± 0.00 | 113.50 | 109.35 | <.01 |
| H‐M | 8.15 ± 2.65 | 42.00a | |||
| TBI‐C | 11.70 ± 0.56 | 101.83b | |||
| TBI‐M | 7.87 ± 2.21 | 34.40c , d | |||
| Hard item score | H‐C | 11.88 ± 0.34 | 118.69 | 119.99 | <.01 |
| H‐M | 4.00 ± 1.45 | 37.80a | |||
| TBI‐C | 10.83 ± 1.65 | 102.00b | |||
| TBI‐M | 3.70 ± 1.80 | 32.85c , d | |||
| Total score | H‐C | 23.88 ± 0. 34 | 119.81 | 120.69 | <.01 |
| H‐M | 12.15 ± 3.03 | 37.34a | |||
| TBI‐C | 22.53 ± 1.96 | 101.19b | |||
| TBI‐M | 11.57 ± 3.05 | 33.05c , d |
H‐C, Healthy Control; H‐M, Healthy Malingering; TBI‐C, traumatic brain injury‐control; TBI‐M, traumatic brain injury‐malingering.
p < .01, H‐C versus H‐M.
p < .01, H‐M versus TBI‐C.
p < .01, H‐C versus TBI‐M.
p < .01, TBI‐C versus TBI‐M.
3.3. Classification accuracy
Receiver operating characteristic analysis was performed to measure the classification ability of the three FGMT indices (easy item, hard item, and total score). See Figure 2. The area under the curve (AUC) for the total score was the highest (AUC = 0.97, 95% CI = 0.94–1.00), followed by the hard item score (AUC = 0.96, 95% CI = 0.92–0.99), and the easy item score (AUC = 0.95, 95% CI = 0.91–0.99), indicating that the total score has the highest classification ability in differentiating malingering from nonmalingering.
Figure 2.
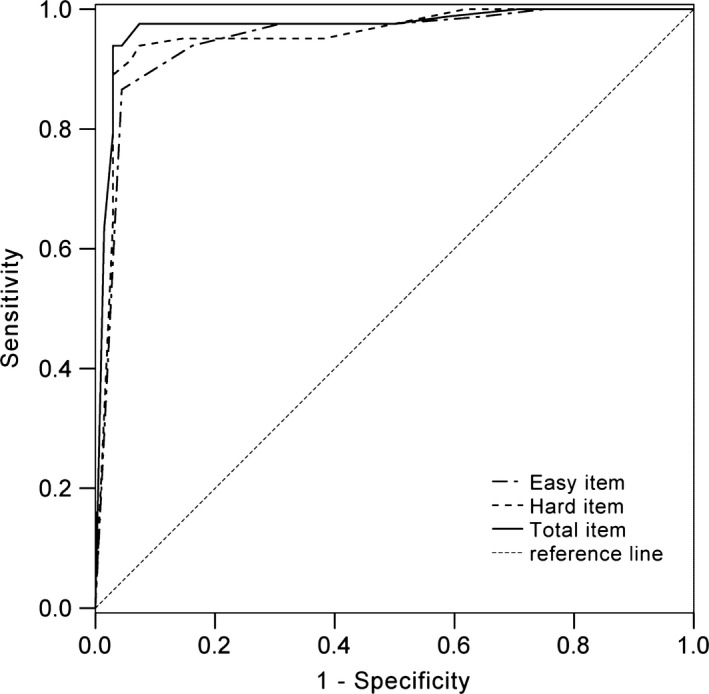
Receiver operating characteristic curve for the Forced‐choice Graphics Memory Test indices
The sensitivity and specificity of various cutoff scores on easy items, hard items, and total score are presented in Table 3. Cutoff scores for each index were calculated by combining effects of sensitivity and specificity for each measure. A total score cutoff of less than 18 correctly categorized 100% of H‐C, 95% of H‐M, 95% of TBI‐C, and 93.3% of TBI‐M participants. A hard item score cutoff of less than 6 identified 95% of H‐C and H‐M, 90% of TBI‐C, and 93.3% of TBI‐M participants. An easy item score cutoff of less than 11 identified 97.5% of H‐C, 90% of H‐M, 95% of TBI‐C, and 83.3% of TBI‐M participants.
Table 3.
The sensitivity and specificity rates in Forced‐choice Graphics Memory Test cutoff scores
| Cutoff | Easy item score | Hard item score | Total score | |||
|---|---|---|---|---|---|---|
| Sens. | Spec. | Sens. | Spec. | Sens. | Spec. | |
| ≤2 | 1.00 | 0.00 | 1.00 | 0.21 | 1.00 | 0.00 |
| 3 | 1.00 | 0.09 | 1.00 | 0.38 | 1.00 | 0.00 |
| 4 | 1.00 | 0.12 | 0.95 | 0.62 | 1.00 | 0.00 |
| 5 | 1.00 | 0.16 | 0.95 | 0.85 | 1.00 | 0.02 |
| 6 | 1.00 | 0.25 | 0.94 | 0.93 | 1.00 | 0.04 |
| 7 | 0.99 | 0.35 | 0.92 | 0.94 | 1.00 | 0.06 |
| 8 | 0.98 | 0.50 | 0.89 | 97 | 1.00 | 0.09 |
| 9 | 0.98 | 0.69 | 0.87 | 0.97 | 1.00 | 0.13 |
| 10 | 0.94 | 0.84 | 0.82 | 0.97 | 1.00 | 0.24 |
| 11 | 0.87 | 0.96 | 0.65 | 0.97 | 1.00 | 0.29 |
| 12 | 0.00 | 1.00 | 0.00 | 1.00 | 0.99 | 0.41 |
| 13 | 0.98 | 0.50 | ||||
| 14 | 0.98 | 0.62 | ||||
| 15 | 0.98 | 0.75 | ||||
| 16 | 0.98 | 0.93 | ||||
| 17 | 0.94 | 0.96 | ||||
| 18 | 0.94 | 0.97 | ||||
| 19 | 0.93 | 0.97 | ||||
| 20 | 0.89 | 0.97 | ||||
| 21 | 0.85 | 0.97 | ||||
| 22 | 0.79 | 0.97 | ||||
| 23 | 0.63 | 0.99 | ||||
| 24 | 0.00 | 1.00 | ||||
Sensitivity is defined as the percentage of participants in the TBI‐M and H‐M groups that were correctly identified as responding invalidly. Specificity is defined as the percentage of participants in the TBI‐C and Healthy Control groups that were correctly identified as responding validly.
The bold values were highlighted to remind readers that these are the values when cutoff score is less than 18 of the total items, less than 6 of the easy hard items, and less than 11 of the easy items, respectively.
Predictive power was calculated using derivations on Bayes' theorem. For various research and clinical use, positive predictive value (PPV) and negative predictive value (NPV) were calculated for a range of base rates of invalid effort spanning 10% to 50%. Depending on the base rate used, PPV and NPV ranged from 0.18 to 0.98 and 0.5 to 1.0, respectively (Table 4).
Table 4.
The predictive power for different base rates in Forced‐choice Graphics Memory Test cutoff scores
| Cutoff | SN | SP | BR = 0.1 | BR = 0.2 | BR = 0.3 | BR = 0.4 | BR = 0.5 | |||||
|---|---|---|---|---|---|---|---|---|---|---|---|---|
| PPV | NPV | PPV | NPV | PPV | NPV | PPV | NPV | PPV | NPV | |||
| 13 | 0.98 | 0.5 | 0.18 | 1.00 | 0.33 | 0.99 | 0.46 | 0.98 | 0.57 | 0.96 | 0.66 | 0.96 |
| 14 | 0.98 | 0.62 | 0.22 | 1.00 | 0.39 | 0.99 | 0.53 | 0.99 | 0.63 | 0.97 | 0.72 | 0.97 |
| 15 | 0.98 | 0.75 | 0.30 | 1.00 | 0.49 | 0.99 | 0.63 | 0.99 | 0.72 | 0.97 | 0.80 | 0.97 |
| 16 | 0.98 | 0.93 | 0.61 | 1.00 | 0.78 | 0.99 | 0.86 | 0.99 | 0.90 | 0.98 | 0.93 | 0.98 |
| 17 | 0.94 | 0.96 | 0.72 | 0.99 | 0.85 | 0.98 | 0.91 | 0.97 | 0.94 | 0.94 | 0.96 | 0.94 |
| 18 | 0.94 | 0.97 | 0.78 | 0.99 | 0.89 | 0.98 | 0.93 | 0.97 | 0.95 | 0.94 | 0.97 | 0.94 |
| 19 | 0.93 | 0.97 | 0.78 | 0.99 | 0.89 | 0.98 | 0.93 | 0.97 | 0.95 | 0.93 | 0.97 | 0.93 |
| 20 | 0.89 | 0.97 | 0.77 | 0.99 | 0.88 | 0.97 | 0.93 | 0.95 | 0.95 | 0.90 | 0.97 | 0.90 |
| 21 | 0.85 | 0.97 | 0.76 | 0.98 | 0.88 | 0.96 | 0.92 | 0.94 | 0.95 | 0.87 | 0.97 | 0.87 |
| 22 | 0.79 | 0.97 | 0.75 | 0.98 | 0.87 | 0.95 | 0.92 | 0.92 | 0.95 | 0.82 | 0.96 | 0.82 |
| 23 | 0.63 | 0.99 | 0.88 | 0.96 | 0.94 | 0.91 | 0.96 | 0.86 | 0.98 | 0.73 | 0.98 | 0.73 |
SN, sensitivity; BR, base rate; SP, specificity; RC, remaining cases = 1‐BR; PPV, positive predictive value, NPV, negative predictive value.
PPV = (SN × BR)/[(SN × BR) + (1 − SP) × RC].
NPV = (SP × RC)/[(SP × RC) + (1 − SN) × BR].
The bold values were highlighted to remind readers that these are the values when cutoff score is less than 18 of the total items, less than 6 of the easy hard items, and less than 11 of the easy items, respectively.
3.4. Test–retest reliability and internal consistency of the FGMT
We next examined the test–retest reliability and internal consistency of the FGMT. Using both TBI groups, we found strong 1 week test–retest reliability on all FGMT scores, including easy item score (r = .95, p < .01), hard item score (r = .98, p < .01), and total score (r = .99, p < .01). It should be noted that test–retest reliability of total score were higher in the TBI‐C (r = .97, p < .01) than in the TBI‐M group (r = .91, p < .01).
Internal consistency was assessed using Cronbach's alpha coefficients. The Cronbach's alpha coefficients were .93, .82, and .91 for the total 24 items, 12 easy items, and 12 hard items, respectively. The reliability of the test was also assessed by Guttman Split‐Half and Spearman‐Brown Split‐Half tests, and the coefficients were .79 and .84, respectively.
3.5. Convergent validity of the FGMT
Correlations were performed to investigate the relationships between the FGMT and the BFDMT. The easy item score (r = .68, p < .01), hard item score (r = .87, p < .01), and total score (r = .92, p < .01) of the FGMT were all positively correlated with the corresponding score of BFDMT.
3.6. Demographic characteristics and the FGMT
The participants of each TBI group were divided into groups based on education (<10 years; ≥10 years), gender, age (≤24 years, 25–34 years, ≥35 years), and intelligence (IQ < 70; IQ ≥ 70). In both the TBI‐C and TBI‐M groups, no significant differences in FGMT scores were found between education, gender, age, or intelligence groups (all p > .05, Table 5, 6, 7), suggesting FGMT scores are not related to these variables.
Table 5.
Forced‐choice Graphics Memory Test scores in different subgroups of TBI‐C
| Demographic variables | N (%) | Easy item score | Hard item score | Total score |
|---|---|---|---|---|
| Gender | ||||
| Male | 22 (55.0) | 11.64 ± 0.66 | 11.05 ± 1.43 | 22.68 ± 1.91 |
| Female | 18 (45.0) | 11.78 ± 0.43 | 10.56 ± 1.89 | 22.33 ± 2.06 |
| Age (years) | ||||
| ≤24 | 15 (37.5) | 11.93 ± 0.26 | 11.00 ± 1.36 | 22.93 ± 1.39 |
| 25–34 | 13 (32.5) | 11.54 ± 0.66 | 10.69 ± 1.80 | 22.23 ± 2.20 |
| ≥35 | 12 (30.0) | 11.58 ± 0.67 | 10.75 ± 1.91 | 22.33 ± 2.35 |
| Education (years) | ||||
| <10 | 18 (45.0) | 11.72 ± 0.58 | 10.89 ± 1.61 | 22.61 ± 1.82 |
| ≥10 | 22 (55.0) | 11.68 ± 0.57 | 10.77 ± 1.72 | 22.45 ± 2.11 |
Table 6.
Forced‐choice Graphics Memory Test scores in different subgroups of TBI‐M
| Demographic variables | N (%) | Easy item score | Hard item score | Total score |
|---|---|---|---|---|
| Gender | ||||
| Male | 18 (60.0) | 8.28 ± 2.42 | 3.72 ± 1.90 | 12.00 ± 3.38 |
| Female | 12 (40.0) | 7.25 ± 1.77 | 3.67 ± 1.72 | 10.92 ± 2.47 |
| Age (years) | ||||
| ≤24 | 7 (23.3) | 9.29 ± 0.95 | 3.57 ± 2.07 | 12.86 ± 2.73 |
| 25–34 | 11 (36.7) | 7.45 ± 1.81 | 4.09 ± 2.12 | 11.55 ± 2.70 |
| ≥35 | 12 (40.0) | 7.42 ± 2.78 | 3.42 ± 1.38 | 10.83 ± 3.49 |
| Education | ||||
| <10 years | 20 (66.7) | 7.75 ± 2.29 | 4.10 ± 1.90 | 11.85 ± 3.25 |
| ≥10 years | 10 (33.3) | 8.10 ± 2.13 | 2.90 ± 1.37 | 11.00 ± 2.11 |
Table 7.
Forced‐choice Graphics Memory Test scores in different intelligence subgroups of traumatic brain injury
| IQ < 70(N = 14) | IQ ≥ 70(N = 56) | |
|---|---|---|
| Easy item score | 10.14 ± 1.79 | 10.04 ± 2.57 |
| Hard item score | 7.79 ± 3.66 | 7.77 ± 4.04 |
| Total item score | 17.93 ± 5.02 | 17.80 ± 6.25 |
4. Discussion
In this study, we developed a new PVT, the FGMT, and determined the ability of the FGMT to assess feigning. We found that FGMT performance accurately differentiated group performance with regard to effort status for both TBI and normal samples. When identifying invalid responses with the cutoff points of less than 11 of the easy items, less than six of the hard items, and less than 18 of the total items, respectively, total score cutoff produced the greatest classification accuracy of differentiating invalid responders from valid responders in both TBI and healthy groups. A total score cutoff of less than 18 was able to correctly categorize 100% of H‐C, 95% of H‐M, 95% of TBI‐C, and 93.3% of TBI‐M participants. Although this study was conducted with a base rate of poor effort of 50% in control participants and 42% in TBI participants, through an examination of PPV and NPV, we were able to demonstrate that the FGMT cutoff of less than 18 performs quite well across a variety of base rates. PPV ranged from 0.78 at a base rate of 10% invalid effort to 0.97 at a base rate of 50% poor effort. NPV remained extremely high across examined base rates, ranging from 0.94 to 0.99. Interestingly, the hard items had better classification accuracy than the easy items, which was inconsistent with what was observed in digital memory test (Liu et al., 2001). Forced‐choice digital memory test has been shown to be quite easy even for individuals with severe TBI and cognitive dysfunction, and therefore TBI patients should not make a large number of mistakes on the easy items (Guilmette, Whelihan, Sparadeo, & Buongiorno, 1994; Iverson & Binder, 2000). Accordingly, the easy digital items usually show higher classification accuracy than hard items (Liu et al., 2001). This discrepancy may due to the different sample capacity, as well as the different stimuli, as graphics are more on an intuitive basis than digits.
Various factors, such as education, intelligence, age and severity of injury, may affect the performance validity and subsequently reduce the value and reliability of PVT. The TOMM showed high reliability when considering the influence of age, education, psychiatric conditions, and cognitive impairment (Ashendorf, Constantinou, & McCaffrey, 2004; Gunner, Miele, Lynch, & McCaffrey, 2012; Iverson, Le Page, Koehler, Shojania, & Badii, 2007; Moser et al., 2007; Rees, Tombaugh, & Boulay, 2001; Teichner & Wagner, 2004). However, the administration time of two learning trials (Trials 1, 2) of TOMM is approximately 15 min (Lynch, 2004), and the retention trial takes 15–20 min. Similarly, the FGMT does not appear to be influenced by education, gender, age, or intelligence. Even people with a low level of education were able to complete the test without any difficulty. Additionally, The FGMT is easy to administer and time‐efficient (it only take 5–10 min to complete).
A potential limitation of this study is the inclusion of only subjects classified as “definite malingering” or “not malingering,” but not the “probable malingering” or “possible malingering,” and only one clinical sample of TBI patients was detected, leading to high sensitivity and specificity. However, the empirical cutoff scores of PVT are developed based on the “purity” of the control and malingering groups (Greve & Bianchini, 2004). Further research is needed to detect the cross‐validation in different types of clinical presentations (stroke, dementia etc.).
Another potential limitation of the study is that we only included the patients with severe brain injury. Future research should address the influence of neurological (e.g., location, severity, or type of lesion) and psychological conditions on FGMT (Bigler, 2012; Larrabee, 2012). Additionally, the PVTs were administered at the beginning of the battery and order of PVTs was not counterbalanced. It is possible that this may have biased the results. Future studies should take care to investigate how the FGMT performs when it is administered in the middle or at the end of a testing battery. Convergent validity using a PVT of very different design (e.g., a nonforced‐choice test) should also be investigated in future.
In conclusion, we developed a reliable, simple measure, the FGMT, based on binomial theorem to identify malingering in patients with TBI and controls. This measure does not appear to be influenced by education, gender, age, or intelligence level. The FGMT has high classification accuracy, test–retest reliability, and internal consistency in a Chinese sample. Future studies are needed to replicate the present results in larger samples and other neurological and ethnic samples.
Conflicts of Interest
The authors report no conflicts of interest.
Acknowledgments
This work was supported in part by the Fundamental Research Funds from the Central Universities of China (Grant no. HUST2012QN001).
Liu, Z. , Dong, J. , Zhao, X. , Chen, X. , Lippa, S. M. , Caroselli, J. S. and Fang, X. (2016), Assessment of feigned cognitive impairment in severe traumatic brain injury patients with the Forced‐choice Graphics Memory Test. Brain and Behavior, 6: 1–10. e00593, doi: 10.1002/brb3.593
References
- American Psychiatric Association (2013). Diagnostic and statistical manual of mental disorders, fifth edition, (DSM‐5) (726 p.). Washington, DC: Author. [Google Scholar]
- Ashendorf, L. , Constantinou, M. , & McCaffrey, R. J. (2004). The effect of depression and anxiety on the TOMM in community‐dwelling older adults. Archives of Clinical Neuropsychology, 19, 125–130. [PubMed] [Google Scholar]
- Avila, R. , Moscoso, M. A. , Ribeiz, S. , Arrais, J. , Jaluul, O. , & Bottino, C. M. (2009). Influence of education and depressive symptoms on cognitive function in the elderly. International Psychogeriatrics, 21, 560–567. [DOI] [PubMed] [Google Scholar]
- Bigler, E. D. (2012). Symptom validity testing, effort, and neuropsychological assessment. Journal of the International Neuropsychological Society, 18, 632–640. [DOI] [PubMed] [Google Scholar]
- Binder, L. M. , & Pankratz, L. (1987). Neuropsychological evidence of a factitious memory complaint. Journal of Clinical and Experimental Neuropsychology, 9, 167–171. [DOI] [PubMed] [Google Scholar]
- Castiel, M. , Alderman, N. , Jenkins, K. , Knight, C. , & Burgess, P. (2012). Use of the Multiple Errands Test‐Simplified Version in the assessment of suboptimal effort. Neuropsychological Rehabilitation, 22, 734–751. [DOI] [PubMed] [Google Scholar]
- Chakrabarti, A. , & Banerjee, M. (2013). Span of attention across stages of intellectual impairment: Does affective stimulation matter? Psychology, 4, 410–419. [Google Scholar]
- Chu, Y. , Zhang, X. , Chen, J. , Li, X. , Liu, J. , & Sang, W. (2010). Comparative study of binomial forced‐choice digit memory test in patients with Schizophrenia. China Journal of Health Psychology, 18, 518–519. [Google Scholar]
- DiCarlo, M. A. , Gfeller, J. D. , & Oliveri, M. V. (2000). Effects of coaching on detecting feigned cognitive impairment with the Category test. Archives of Clinical Neuropsychology, 15, 399–413. [PubMed] [Google Scholar]
- Dunn, T. M. , Shear, P. K. , Howe, S. , & Ris, M. D. (2003). Detecting neuropsychological malingering: Effects of coaching and information. Archives of Clinical Neuropsychology, 18, 121–134. [PubMed] [Google Scholar]
- Erdal, K. (2004). The effects of motivation, coaching, and knowledge of neuropsychology on the simulated malingering of head injury. Archives of Clinical Neuropsychology, 19, 73–88. [PubMed] [Google Scholar]
- Finnanger, T. G. , Skandsen, T. , Andersson, S. , Lydersen, S. , Vik, A. , & Indredavik, M. (2013). Differentiated patterns of cognitive impairment 12 months after severe and moderate traumatic brain injury. Brain Injury, 27, 1606–1616. [DOI] [PubMed] [Google Scholar]
- Flaro, L. , Green, P. , & Robertson, E. (2007). Word Memory Test failure 23 times higher in mild brain injury than in parents seeking custody: The power of external incentives. Brain Injury, 21, 373–383. [DOI] [PubMed] [Google Scholar]
- Fox, D. D. (2011). Symptom validity test failure indicates invalidity of neuropsychological tests. The Clinical Neuropsychologist, 25, 488–495. [DOI] [PubMed] [Google Scholar]
- Frazier, T. W. , Youngstrom, E. A. , Naugle, R. I. , Haggerty, K. A. , & Busch, R. M. (2007). The latent structure of cognitive symptom exaggeration on the Victoria Symptom Validity Test. Archives of Clinical Neuropsychology, 22, 197–211. [DOI] [PubMed] [Google Scholar]
- Frederick, R. I. , & Speed, F. M. (2007). On the interpretation of below‐chance responding in forced‐choice tests. Assessment, 14, 3–11. [DOI] [PubMed] [Google Scholar]
- Gao, B. , Liu, R. , Ding, S. , Li, Y. , & Sheng, L. (2002). Analysis of using binomial forced‐choice digit memory test in patients with financially compensable head trauma. Chinese Journal of Clinical Psychology, 10, 256–259. [Google Scholar]
- Gao, B. , Yang, W. , Ding, S. , Li, Y. , & Sheng, L. (2003). Performance of binomial forced‐choice digit memory test of the elderly with cognitive impairment. Chinese Journal of Clinical Psychology, 11, 99–101. [Google Scholar]
- Gouse, H. , Thomas, K. G. , & Solms, M. (2013). Neuropsychological, functional, and behavioral outcome in South African traumatic brain injury litigants. Archives of Clinical Neuropsychology, 28, 38–51. [DOI] [PubMed] [Google Scholar]
- Green, P. (2007). The pervasive influence of effort on neuropsychological tests. Physical Medicine and Rehabilitation Clinics of North America, 18, 43–68, vi. [DOI] [PubMed] [Google Scholar]
- Green, P. , Iverson, G. L. , & Allen, L. (1999). Detecting malingering in head injury litigation with the Word Memory Test. Brain Injury, 13, 813–819. [DOI] [PubMed] [Google Scholar]
- Green, P. , Rohling, M. L. , Iverson, G. L. , & Gervais, R. O. (2003). Relationships between olfactory discrimination and head injury severity. Brain Injury, 17, 479–496. [DOI] [PubMed] [Google Scholar]
- Green, P. , Rohling, M. L. , Lees‐Haley, P. R. , & Allen III, L. M. (2001). Effort has a greater effect on test scores than severe brain injury in compensation claimants. Brain Injury, 15, 1045–1060. [DOI] [PubMed] [Google Scholar]
- Greve, K. W. , & Bianchini, K. J. (2004). Setting empirical cut‐offs on psychometric indicators of negative response bias: A methodological commentary with recommendations. Archives of Clinical Neuropsychology, 19, 533–541. [DOI] [PubMed] [Google Scholar]
- Guilmette, T. J. , Hart, K. J. , Giuliano, A. J. , & Leininger, B. E. (1994). Detecting simulated memory impairment: Comparison of the Rey Fifteen‐Item Test and the Hiscock Forced‐Choice Procedure. The Clinical Neuropsychologist, 8, 283–294. [Google Scholar]
- Guilmette, T. J. , Whelihan, W. , Sparadeo, F. R. , & Buongiorno, G. (1994). Validity of neuropsychological test results in disability evaluations. Perceptual and Motor Skills, 78, 1179–1186. [DOI] [PubMed] [Google Scholar]
- Gunner, J. H. , Miele, A. S. , Lynch, J. K. , & McCaffrey, R. J. (2012). The Albany consistency index for the test of memory malingering. Archives of Clinical Neuropsychology, 27, 1–9. [DOI] [PubMed] [Google Scholar]
- Gunstad, J. , & Suhr, J. A. (2001). Efficacy of the full and abbreviated forms of the Portland Digit Recognition Test: Vulnerability to coaching. The Clinical Neuropsychologist, 15, 397–404. [DOI] [PubMed] [Google Scholar]
- Hellawell, D. J. , Taylor, R. T. , & Pentland, B. (1999). Cognitive and psychosocial outcome following moderate or severe traumatic brain injury. Brain Injury, 13, 489–504. [DOI] [PubMed] [Google Scholar]
- Hiscock, M. , & Hiscock, C. K. (1989). Refining the forced‐choice method for the detection of malingering. Journal of Clinical and Experimental Neuropsychology, 11, 967–974. [DOI] [PubMed] [Google Scholar]
- Iverson, G. L. , & Binder, L. M. (2000). Detecting exaggeration and malingering in neuropsychological assessment. The Journal of Head Trauma Rehabilitation, 15, 829–858. [DOI] [PubMed] [Google Scholar]
- Iverson, G. L. , Le Page, J. , Koehler, B. E. , Shojania, K. , & Badii, M. (2007). Test of Memory Malingering (TOMM) scores are not affected by chronic pain or depression in patients with fibromyalgia. The Clinical Neuropsychologist, 21, 532–546. [DOI] [PubMed] [Google Scholar]
- Jennekens, N. , de Casterle, B. D. , & Dobbels, F. (2010). A systematic review of care needs of people with traumatic brain injury (TBI) on a cognitive, emotional and behavioural level. Journal of Clinical Nursing, 19, 1198–1206. [DOI] [PubMed] [Google Scholar]
- Larrabee, G. J. (2005). Assessment of malingering In Larrabee G. J. (Ed.), Forensic neuropsychology: A scientific approach (pp. 115–158). New York, NY: Oxford University Press. [Google Scholar]
- Larrabee, G. J. (2012). Performance validity and symptom validity in neuropsychological assessment. Journal of the International Neuropsychological Society, 18, 625–630. [DOI] [PubMed] [Google Scholar]
- Lezak, M. D. , Howieson, D. B. , Bigler, E. D. , & Tranel, D. (2012). Neuropsychological assessment (5th ed., p. 831). New York, NY: Oxford University Press. [Google Scholar]
- Liu, R. , Gao, B. , & Li, Y. (2001). The revise and trial of Hiscock's forced—Choice memory test. Chinese Journal of Clinical Psychology, 9, 173–175. [Google Scholar]
- Loring, D. W. , Larrabee, G. J. , Lee, G. P. , & Meador, K. J. (2007). Victoria Symptom Validity Test performance in a heterogenous clinical sample. The Clinical Neuropsychologist, 21, 522–531. [DOI] [PubMed] [Google Scholar]
- Love, C. M. , Glassmire, D. M. , Zanolini, S. J. , & Wolf, A. (2014). Specificity and false positive rates of the Test of Memory Malingering, Rey 15‐item Test, and Rey Word Recognition Test among forensic inpatients with intellectual disabilities. Assessment, 21, 618–627. [DOI] [PubMed] [Google Scholar]
- Lynch, W. J. (2004). Determination of effort level, exaggeration, and malingering in neurocognitive assessment. The Journal of Head Trauma Rehabilitation, 19, 277–283. [DOI] [PubMed] [Google Scholar]
- Merten, T. , Green, P. , Henry, M. , Blaskewitz, N. , & Brockhaus, R. (2005). Analog validation of German‐language symptom validity tests and the influence of coaching. Archives of Clinical Neuropsychology, 20, 719–726. [DOI] [PubMed] [Google Scholar]
- Miotto, E. C. , Cinalli, F. Z. , Serrao, V. T. , Benute, G. G. , Lucia, M. C. , & Scaff, M. (2010). Cognitive deficits in patients with mild to moderate traumatic brain injury. Arquivos de Neuro‐Psiquiatria, 68, 862–868. [DOI] [PubMed] [Google Scholar]
- Mittenberg, W. , Patton, C. , Canyock, E. M. , & Condit, D. C. (2002). Base rates of malingering and symptom exaggeration. Journal of Clinical and Experimental Neuropsychology, 24, 1094–1102. [DOI] [PubMed] [Google Scholar]
- Moser, R. S. , Iverson, G. L. , Echemendia, R. J. , Lovell, M. R. , Schatz, P. , Webbe, F. M. , & Barth, J. T. (2007). Neuropsychological evaluation in the diagnosis and management of sports‐related concussion. Archives of Clinical Neuropsychology, 22, 909–916. [DOI] [PubMed] [Google Scholar]
- Mungkhetklang, C. , Crewther, S. G. , Bavin, E. L. , Goharpey, N. , & Parsons, C. (2016). Comparison of measures of ability in adolescents with intellectual disability. Frontiers in Psychology, 7, 683. [DOI] [PMC free article] [PubMed] [Google Scholar]
- O'Bryant, S. E. , & Lucas, J. A. (2006). Estimating the predictive value of the Test of Memory Malingering: An illustrative example for clinicians. The Clinical Neuropsychologist, 20, 533–540. [DOI] [PubMed] [Google Scholar]
- Paivio, A. (1971). Imagery and verbal processes. New York, NY: Holt, Rinehart Winston. [Google Scholar]
- Rees, L. M. , Tombaugh, T. N. , & Boulay, L. (2001). Depression and the Test of Memory Malingering. Archives of Clinical Neuropsychology, 16, 501–506. [PubMed] [Google Scholar]
- Russeler, J. , Brett, A. , Klaue, U. , Sailer, M. , & Munte, T. F. (2008). The effect of coaching on the simulated malingering of memory impairment. BMC Neurology, 8, 37. [DOI] [PMC free article] [PubMed] [Google Scholar]
- Satz, P. , Zaucha, K. , Forney, D. L. , McCleary, C. , Asarnow, R. F. , Light, R. , & Becker, D. (1998). Neuropsychological, psychosocial and vocational correlates of the Glasgow Outcome Scale at 6 months post‐injury: A study of moderate to severe traumatic brain injury patients. Brain Injury, 12, 555–567. [DOI] [PubMed] [Google Scholar]
- Schroeder, R. W. , Twumasi‐Ankrah, P. , Baade, L. E. , & Marshall, P. S. (2012). Reliable Digit Span: A systematic review and cross‐validation study. Assessment, 19, 21–30. [DOI] [PubMed] [Google Scholar]
- Shandera, A. L. , Berry, D. T. , Clark, J. A. , Schipper, L. J. , Graue, L. O. , & Harp, J. P. (2010). Detection of malingered mental retardation. Psychological Assessment, 22, 50–56. [DOI] [PubMed] [Google Scholar]
- Slick, D. J. , Sherman, E. M. , & Iverson, G. L. (1999). Diagnostic criteria for malingered neurocognitive dysfunction: Proposed standards for clinical practice and research. The Clinical Neuropsychologist, 13, 545–561. [DOI] [PubMed] [Google Scholar]
- Slick, D. J. , Tan, J. E. , Strauss, E. H. , & Hultsch, D. F. (2004). Detecting malingering: A survey of experts' practices. Archives of Clinical Neuropsychology, 19, 465–473. [DOI] [PubMed] [Google Scholar]
- Sollman, M. J. , & Berry, D. T. (2011). Detection of inadequate effort on neuropsychological testing: A meta‐analytic update and extension. Archives of Clinical Neuropsychology, 26, 774–789. [DOI] [PubMed] [Google Scholar]
- Sweet, J. J. , Goldman, D. J. , & Guidotti Breting, L. M. (2013). Traumatic brain injury: Guidance in a forensic context from outcome, dose‐response, and response bias research. Behavioral Sciences & the law, 31, 756–778. [DOI] [PubMed] [Google Scholar]
- Sweet, J. J. , King, J. H. , Malina, A. C. , Bergman, M. A. , & Simmons, A. (2002). Documenting the prominence of forensic neuropsychology at national meetings and in relevant professional journals from 1990 to 2000. The Clinical Neuropsychologist, 16, 481–494. [DOI] [PubMed] [Google Scholar]
- Teasdale, G. , & Jennett, B. (1976). Assessment and prognosis of coma after head injury. Acta Neurochirurgica (Wien), 34, 45–55. [DOI] [PubMed] [Google Scholar]
- Teichner, G. , & Wagner, M. T. (2004). The Test of Memory Malingering (TOMM): Normative data from cognitively intact, cognitively impaired, and elderly patients with dementia. Archives of Clinical Neuropsychology, 19, 455–464. [DOI] [PubMed] [Google Scholar]
- Tombaugh, T. N. (1996). Test of Memory Malingering (TOMM), North Tonowanda, NY: Multi‐Health Systems. [Google Scholar]
- Vagnini, V. L. , Berry, D. T. , Clark, J. A. , & Jiang, Y. (2008). New measures to detect malingered neurocognitive deficit: Applying reaction time and event‐related potentials. Journal of Clinical and Experimental Neuropsychology, 30, 766–776. [DOI] [PMC free article] [PubMed] [Google Scholar]
- Van Dyke, S. A. , Millis, S. R. , Axelrod, B. N. , & Hanks, R. A. (2013). Assessing effort: Differentiating performance and symptom validity. The Clinical Neuropsychologist, 27, 1234–1246. [DOI] [PubMed] [Google Scholar]
- Vickery, C. D. , Berry, D. T. , Inman, T. H. , Harris, M. J. , & Orey, S. A. (2001). Detection of inadequate effort on neuropsychological testing: A meta‐analytic review of selected procedures. Archives of Clinical Neuropsychology, 16, 45–73. [PubMed] [Google Scholar]
- Vilar‐Lopez, R. , Santiago‐Ramajo, S. , Gomez‐Rio, M. , Verdejo‐Garcia, A. , Llamas, J. M. , & Perez‐Garcia, M. (2007). Detection of malingering in a Spanish population using three specific malingering tests. Archives of Clinical Neuropsychology, 22, 379–388. [DOI] [PubMed] [Google Scholar]
- Wisdom, N. M. , Brown, W. L. , Chen, D. K. , & Collins, R. L. (2012). The use of all three Test of Memory Malingering trials in establishing the level of effort. Archives of Clinical Neuropsychology, 27, 208–212. [DOI] [PubMed] [Google Scholar]
- Woods, D. L. , Herron, T. J. , Yund, E. W. , Hink, R. F. , Kishiyama, M. M. , & Reed, B. (2011). Computerized analysis of error patterns in digit span recall. Journal of Clinical and Experimental Neuropsychology, 33, 721–734. [DOI] [PubMed] [Google Scholar]
- Yao, S. , Chen, H. , Jiang, L. , & Tam, W. C. (2007). Replication of factor structure of Wechsler Adult Intelligence Scale‐III Chinese version in Chinese mainland non‐clinical and schizophrenia samples. Psychiatry and Clinical Neurosciences, 61, 379–384. [DOI] [PubMed] [Google Scholar]
- Zhang, X. , Liu, H. , Chu, Y. , Li, X. , & Chen, J. (2009). Clinical application of binomial forced‐choice digit memory test in the judicatory authenticate with mental retardation. Medical Research and Education, 26, 53–55. [Google Scholar]