

Abstract
Background:
The objective of this meta-analysis was to evaluate the clinical usefulness of Ktrans, Kep, and Ve values in the differential diagnosis of prostate cancer (PCa) and noncancerous tissue in the peripheral zone (PZ) and central gland (CG).
Methods:
A search was conducted of the PubMed, MEDLINE, EMBASE, Cochrane Library, China National Knowledge Infrastructure, and Wanfang databases from January 2000 to October 2015 using the search terms “prostate cancer,” “ dynamic contrast-enhanced (DCE),” “magnetic resonance imaging,” “Ktrans,” “Kep,” and “Ve.” Studies were selected and included according to strict eligibility criteria. Standardized mean differences (SMDs) and 95% confidence intervals (CIs) were used to compare Ktrans, Kep, and Ve values between PCa and noncancerous tissue.
Results:
Fourteen studies representing 484 patients highly suspicious for prostate adenocarcinoma were selected for the meta-analysis. We found that Ktrans values measured by dynamic contrast-enhanced magnetic resonance imaging (DCE-MRI) were significantly higher in PCa tissue than in noncancerous tissue in the PZ (SMD 1.57, 95% CI 0.98–2.16; z = 5.21, P <0.00001) and CG (SMD 1.19, 95% CI 0.46–1.91; z = 3.21, P = 0.001). Kep values measured by DCE-MRI were significantly higher in PCa than in noncancerous tissue in the PZ (SMD 1.41, 95% CI 0.92–1.91; z = 5.59, P < 0.00001) and CG (SMD 1.57, 95% CI 0.69–2.46; z = 3.49, P = 0.0005). Ve values generated by DCE-MRI were slightly higher in PCa than in noncancerous tissue in the PZ (SMD 0.72, 95% CI 0.17–1.27; z = 2.58, P = 0.010), but sensitivity analysis found that the Ve value was unstable for differentiation between PCa and noncancerous PZ tissue. However, there was no significant difference in the Ve value between PCa and noncancerous CG tissue (SMD −0.29, 95% CI −1.18, 0.59; z = 0.65, P = 0.51).
Conclusion:
Our meta-analysis shows that Ktrans and Kep were the most reliable parameters for differentiating PCa from noncancerous tissue and were critical for evaluation of the internal structure of cancer. The Ve value was not helpful for distinguishing PCa from noncancerous CG tissue; its ability to distinguish between PCa and noncancerous PZ tissue remains uncertain.
Keywords: dynamic contrast-enhanced, Kep, Ktrans, magnetic resonance imaging, meta-analysis, prostate cancer, Ve
1. Introduction
Prostate cancer (PCa) is the most frequently diagnosed cancer in men aside from skin cancer, and is a major public health issue worldwide.[1] Early detection and localization of PCa permits appropriate and timely management, which can allow clinicians to treat the cancer effectively, and prognostic factors can help clinicians to make appropriate decisions concerning treatment of individual patients.[2] Because PCa is often accompanied by inflammation, bleeding, calcification, and other features, the signals between cancerous and noncancerous tissue can be mixed, which makes diagnosis of PCa difficult. The signal intensity of a tumor nodule in the central gland (CG) is similar to that of a hyperplastic nodule, and malignant cancers localized in the prostate CG are often missed on conventional magnetic resonance imaging (MRI).[3,4]
This shortcoming has led to new techniques, such as multiparametric MRI, which can be performed concurrently with spatial, anatomic, and functional techniques to improve detection and assessment of PCa. Currently, multiparametric assessment of PCa, which consists of T1-weighted and T2-weighted imaging, diffusion-weighted imaging, dynamic contrast-enhanced MRI (DCE-MRI), and magnetic resonance spectroscopy imaging, is the most widely approved tool for diagnosis of PCa according to the international PI-RADS version 2 guidelines.[5] DCE-MRI has become an important component of the multiparametric strategy and is emerging as a useful clinical technique for the evaluation of the severity, location, and extent of primary and recurrent PCa.[6] Therefore, as a new MRI technology, it is particularly important to evaluate the diagnostic value of quantitative parameters generated by DCE-MRI in PCa. DCE-MRI uses compartmental pharmacokinetic models of tracer kinetics to describe the microscopic processes that distribute molecules of contrast agent between the vascular and extravascular spaces.[7] Ktrans (forward volume transfer constant) represents the transfer volume of the contrast agent migrating from the blood into the tissue space per unit time; the size of the tissue space depends on blood flow, capillary permeability, and surface area. Kep (reverse reflux rate constant between extracellular space and plasma) represents the volume of contrast agent migrating from the tissue space into the blood vessels per unit time. Ve (fractional volume of extracellular space per unit volume of tissue) represents the volume of extravascular and extracellular tissue space per unit volume. Angiogenesis plays a vital role in the growth, progression, and metastasis of PCa.[8,9] If the rate of angiogenesis is too rapid, the gaps between the endothelial cells increase, as does the permeability of these cells. DCE-MRI has been demonstrated to provide information about microvascularity and angiogenesis, which increase the permeability of vessels in PCa tissue, and is considered useful for predicting clinical and pathologic staging, the response to treatment, and the prognosis of cancer.[10–12]
Histopathologic examination of biopsy tissue remains the gold standard for diagnosis of PCa despite its inherent limitations. Malignancies are easily overlooked because of their multifocal and heterogeneous nature, and the high false-negative rate of transrectal ultrasound-guided prostate biopsy (TRUS-Bx) is considered unacceptable.[13] TRUS-Bx is an invasive diagnostic method that can cause hematuria, urinary tract or rectal bleeding, infection, and even septicemia and needle metastasis of PCa. Therefore, DCE-MRI, which is a noninvasive method with high accuracy, is required to diagnose PCa.
At present, the main disagreements have focused on the use of Ktrans and Kep values in the differential diagnosis of PCa and noncancerous CG tissue and whether the Ve value has any clinical diagnostic benefit. Most authors believe that Ktrans and Kep values are higher in PCa than in noncancerous peripheral zone (PZ) tissue, while there is an overlap of values between PCa and noncancerous CG tissue.[14,15] A few studies suggest that the Ve value is higher in PCa than in noncancerous PZ tissue.[14,16,17] However, most studies have reported that the Ve value in PCa and noncancerous tissue is not statistically significant. Currently, there are very few systematic reviews of relevant studies. This paper summarizes, evaluates, and analyzes the relevant data in the literature using meta-analysis, and investigates the clinical usefulness of Ktrans, Kep, and Ve values in the differential diagnosis of PCa and noncancerous tissue using evidence-based guidelines to draw a more objective conclusion.
2. Materials and methods
2.1. Literature search and screening
A comprehensive search of the literature published between January 2000 and October 2015 was undertaken using the PubMed, MEDLINE, EMBASE, Cochrane Library, China National Knowledge Infrastructure, and Wanfang databases. The literature search was limited to studies published in the English or Chinese language. The following medical subject heading terms and keywords were used in the search: “prostate cancer,” “DCE,” “magnetic resonance imaging,” “Ktrans,” “Kep,” and “Ve.” The diagnosis was confirmed by pathologic examination and the statistics for noncancerous PZ and CG tissue. The species was defined as “human.” We restricted our search to articles published in the English or Chinese language, but did not limit our search to publications from specific countries. The inclusion criteria were broad, and included studies with a retrospective or prospective design. Review articles, abstracts, letters, comments, guidelines, case reports, and republished articles were excluded. All the studies identified to be of interest were retrieved, and their references were scrutinized along with other relevant publications in an effort to find further eligible studies.
2.2. Selection of studies
The inclusion criteria were as follows: clinical case-control study using the quantitative parameters of DCE-MRI for differential diagnosis of PCa; sufficient study data available for mean and standard deviation (SD) values in noncancerous tissue and PCa; all study patients had histopathologic results (biopsy or radical prostatectomy) as the reference standard; the study included at least 15 lesions; and 1.5 T and 3.0 T MRI were used. Only the most recent and complete report was extracted if on careful reexamination the same study was found to be published more than once.
The exclusion criteria were as follows: study not related to the research question; incomplete data; publication in a language other than Chinese or English; duplicate publication; study performed in vitro or in an animal model; and publication in the form of a review, abstract, letter, comment, guideline, or case report.
2.3. Data extraction and quality assessment
Two radiologists with 5 years of experience in MRI of the prostate each reviewed all of the included publications to extract information for the meta-analysis. The following descriptive information was collected: first author, publication date, country, ethnicity, language, patient age, study design, reference standard, type of MRI machine used, mean and SD, case number, and number of lesions. We used the revised Quality Assessment of Diagnostic Accuracy Studies (QUADAS-2)[18] checklist to assess the study quality in terms of the risk of bias and applicability of the included studies. Each study was judged as “Yes (low risk of bias),” “No (high risk of bias),” or “Unclear.” The quality of each paper was evaluated by 2 researchers independently. Any discrepancies were resolved by discussion or, if agreement could not be reached, by arbitration on the part of a third reviewer.
2.4. Statistical analysis
All the meta-analyses were performed using Review Manager 5.3 (Cochrane Collaboration, Oxford, UK) and STATA 12.0 (StataCorp LP, College Station, TX), with a significance level set to P <0.05. To calculate the effect size for each study, the summary standard mean difference (SMD) and 95% confidence interval (CI) were used to compare the Ktrans, Kep, and Ve values obtained by DCE-MRI for PCa with those for noncancerous tissue. Pooled standardized mean differences and corresponding 95% CIs were calculated using the inverse variance method. The Q statistic of the χ2 test and the inconsistency index (I2) were used to assess the heterogeneity of the included studies.[19] Forest plots were drawn to show comparisons of the odds ratio and 95% CI between the study groups. A significance level of P <0.05 in combination with an I2 > 50% indicates significant heterogeneity. If marked heterogeneity was observed, the diagnostic performance was summarized using a random-effects model.[20] A fixed-effects model was used when significant heterogeneity was not observed.
When significant heterogeneity was observed, subgroup analyses were used to identify factors that contributed to the heterogeneity and to explore how those factors influenced the diagnostic results. In a subgroup analysis, the studies were stratified according to ethnicity (Asian or White), type of MRI machine used (General Electric, Siemens, Philips), and magnetic field strength (1.5 T or 3.0 T). In addition, a sensitivity analysis was performed to ensure the reliability of the included studies. Egger linear regression test and Begg rank correlation were used to test for publication bias.
3. Results
3.1. Characteristics of eligible studies
Figure 1 is a flow chart of the published studies and the main exclusion criteria applied in this meta-analysis. We initially retrieved 324 studies (72 in Chinese, 252 in English) by searching the electronic databases and manual searching. After evaluation, 14 articles (11 in English, 3 in Chinese) representing 484 enrolled patients in whom there was a high clinical suspicion for PCa were included in the meta-analysis.[14–17,21–30] After reviewing the remaining 55 studies, full-text articles were excluded for the following reasons: publication as letters, reviews, meta-analyses, or animal experiments, or containing data irrelevant to the research topic (n = 31); inclusion of incomplete or inaccurate data (n = 5); postoperative evaluation of radiotherapy and castration (n = 2); comparison between different types of postprocessing software (n = 2); and publication in the French language (n = 1). We contacted the authors of the papers to obtain information about studies with incomplete or inaccurate data, and then excluded articles for which additional information could not be obtained. The final 14 studies evaluated Ktrans, Kep, and Ve values obtained by DCE-MRI for differential diagnosis of PCa and noncancerous tissue in Asian (n = 7) and White (n = 7) study populations. Figures 2 and 3 show graphic depictions of the QUADAS-2 results for the proportion of studies with low, high, or unclear risk of bias.
Figure 1.
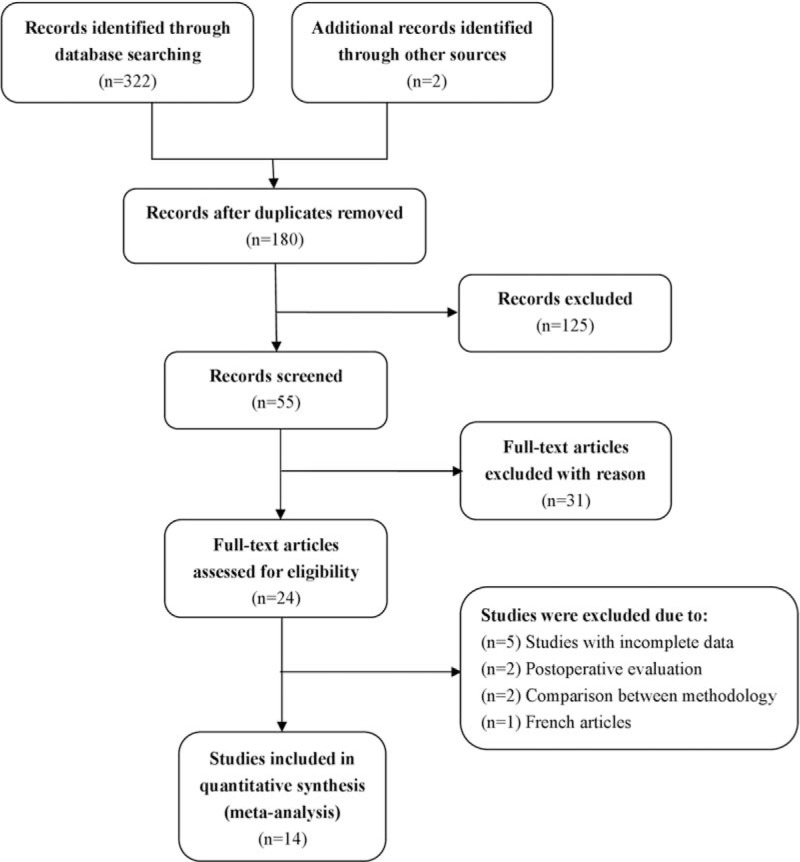
Flow chart shows the study selection procedure. Fourteen studies were included in this meta-analysis.
Figure 2.

Graph showing the risk of bias and applicability concerns: review of authors’ judgements about each domain, presented as percentages across included studies.
Figure 3.

Chart summarizing the risk of bias and applicability concerns: review of authors’ judgements about each domain for each included study. −, high concern; ?, unclear concern; +, low concern.
The final 14 studies were performed in China (n = 6), Canada (n = 4), the USA (n = 1), England (n = 1), Korea (n = 1), or The Netherlands (n = 1). The types of MRI machine used were Siemens, General Electric, and Philips, and all studies provided data suitable for meta-analysis. For studies[23,25] that presented continuous data as the median and range, the mean and SD were calculated using the method described by Hozo et al.[31] The main study and patient characteristics are summarized in Table 1. Methodologic and imaging protocol characteristics regarding the diagnostic testing are shown in Table 2. The quantitative parameters of DCE-MRI are presented for each subset in Table 3.
Table 1.
Study and patient characteristics of included studies.

Table 2.
Methodologic and imaging protocol characteristics regarding the diagnostic testing.

Table 3.
The quantitative parameters of DCE-MRI of the included studies.

3.2. Pooled outcomes of meta-analysis
There was a suggestion of heterogeneity in the studies as follows: the Ktrans value in different tissues (carcinoma tissue vs noncancerous PZ tissue, P < 0.00001, I2 = 94%; carcinoma tissue vs noncancerous CG tissue, P < 0.00001, I2 = 92%); the Kep value in different tissues (carcinoma tissue vs noncancerous PZ tissue, P < 0.00001, I2 = 87%; carcinoma tissue vs noncancerous CG tissue, P <0.00001, I2 = 92%); and the Ve value in carcinoma tissue versus noncancerous PZ tissue, P < 0.00001, I2 = 92%; carcinoma tissue versus noncancerous CG tissue, P < 0.00001, I2 = 95%. Thus, the random-effects model was applied in this meta-analysis.
Pooled data from the studies demonstrated that the Ktrans value from DCE-MRI was significantly higher in PCa than in noncancerous PZ and CG tissue (carcinoma tissue vs noncancerous PZ tissue: SMD 1.57; 95% CI 0.98–2.16; z = 5.21, P < 0.00001; carcinoma tissue vs noncancerous CG tissue: SMD 1.19; 95% CI 0.46–1.91; z = 3.21, P = 0.001; Figs. 4 and 5). The Kep value from DCE-MRI was markedly higher in PCa than in noncancerous PZ and CG tissue, indicating a significant difference between the 2 groups (carcinoma tissue vs noncancerous PZ tissue: SMD 1.41; 95% CI 0.92–1.91; z = 5.59, P <0.00001; carcinoma tissue vs noncancerous CG tissue: SMD 1.57; 95% CI 0.69–2.46; z = 3.49, P = 0.0005; Figs. 4 and 5). The Ve value from DCE-MRI was slightly higher in PCa than in noncancerous PZ tissue, and the difference between the 2 groups was statistically significant (SMD 0.72; 95% CI 0.17–1.27; z = 2.58, P = 0.010; Fig. 4). However, there was no significant difference in the Ve value between PCa and noncancerous CG tissue (SMD −0.29; 95% CI −1.18, 0.59; z = 0.65, P = 0.51; Fig. 5).
Figure 4.

Forest plots showing SMD (with 95% CI) for Ktrans, Kep, and Ve values between PCa and noncancerous PZ tissue in a random-effects model. Kep = reverse reflux rate constant between extracellular space and plasma, Ktrans = forward volume transfer constant, PCa = prostate cancer, PZ = peripheral zone, SMD = standardized mean difference, Ve = the fractional volume of extracellular space per unit volume of tissue.
Figure 5.

Forest plots showing SMD (with 95% CI) for Ktrans, Kep, and Ve values between PCa and noncancerous CG tissue in a random-effects model. CG = central gland, Kep = reverse reflux rate constant between extracellular space and plasma, Ktrans = forward volume transfer constant, PCa = prostate cancer, SMD = standardized mean difference, Ve = the fractional volume of extracellular space per unit volume of tissue.
3.3. Pooled outcomes of subgroup analyses
A subgroup analysis of Ktrans and Kep values according to ethnicity found no statistically significant differences between PCa and noncancerous CG tissue in Whites (Ktrans, P = 0.19; Kep, P = 0.80). Subgroup analysis according to type of MRI machine used showed no significant differences between PCa and noncancerous CG tissue for the Siemens machine (Ktrans, P = 0.37; Kep, P = 0.28). Subgroup analysis based on magnetic field strength revealed no statistically significant differences between PCa and noncancerous CG tissue when 1.5 T was used (Ktrans, P = 0.19; Kep, P = 0.26). The other subgroup analyses all yielded statistically significant differences between PCa and noncancerous PZ tissue (Table 4).
Table 4.
Subgroup analyses for the Ktrans, Kep, and Ve values of DCE-MRI in the differential diagnosis of PCa and noncancerous tissue.

A subgroup analysis according to ethnicity found that the Ve value was remarkably higher in PCa tissue than in noncancerous PZ tissue in Asians (P = 0.001); in Whites, the Ve value tissue was slightly lower in PCa than in noncancerous CG tissue (P = 0.02). Subgroup analysis based on magnetic field strength revealed a slightly higher Ve value in PCa tissue than in noncancerous PZ tissue when 3.0 T MRI was used (P = 0.03). There were no statistically significant differences between PCa tissue and noncancerous PZ tissue in the remaining subgroups (Table 4).
3.4. Sensitivity analysis and publication bias
The results of the sensitivity analysis revealed no change in the significance of any of the outcomes except for Ve values in PCa and noncancerous PZ tissue; when ruling out any 2 of the 4 studies, the significance of the Ve value in differential diagnosis between PCa and noncancerous PZ tissue changed, indicated that the results of the study were unstable.[14,16,17,26] There was no statistically significant difference in the Ve value between PCa and noncancerous PZ tissue (SMD 0.05; 95% CI −0.18, 0.27; z = 0.41, P = 0.68) after the 4 homogeneous studies[14,16,17,26] were excluded, and was not notably heterogeneous (P = 0.19, I2 = 31%).
Figure 6 shows a funnel plot of the studies that reported perioperative complication rates, which were included in this meta-analysis. All studies are essentially in the upper part of the inverted funnel and show a roughly symmetrical distribution, with an even distribution around the vertical (Fig. 6). The Begg and Egger tests revealed no evidence of publication bias (Table 5).
Figure 6.
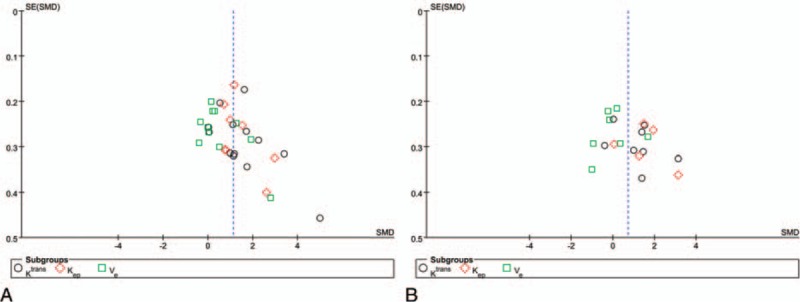
Funnel plot for the Ktrans, Kep, and Ve values of DCE-MRI in the differential diagnosis of PCa from noncancerous PZ tissue (A) and noncancerous CG tissue (B). CG = central gland, DCE-MRI = dynamic contrast-enhanced magnetic resonance imaging, Kep = reverse reflux rate constant between extracellular space and plasma, Ktrans = forward volume transfer constant, PCa = prostate cancer, PZ = peripheral zone, Ve = the fractional volume of extracellular space per unit volume of tissue.
Table 5.
The results of Begg test and Egger of the Ktrans, Kep, and Ve values in the differential diagnosis of PCa and noncancerous tissue.

4. Discussion
In this study, we explored the ability of the quantitative parameters of DCE-MRI to differentiate PCa from noncancerous tissues. The results of the present meta-analysis show statistically significant differences in Ktrans and Kep values between PCa and noncancerous tissues. The Ve value was not significantly different between PCa and noncancerous CG tissue, but was significantly different between PCa and noncancerous PZ tissue; however, the results were considered unstable after sensitivity analysis. Therefore, the ability of Ve to distinguish between PCa and noncancerous PZ tissue remains uncertain.
In the subgroup analysis, Ktrans and Kep were found to be valuable for differential diagnosis of PCa and noncancerous PZ tissue. However, it was interesting that these 2 parameters showed consistent results in the subgroup analyses (i.e., there were no significant differences with regard to White ethnicity, use of 1.5 T MRI machines, or the Siemens subgroup) for differential diagnosis of PCa and noncancerous CG tissue (Table 4). On stratification by ethnicity, Ktrans and Kep values were significant for Asians but not for Whites, which may be related to differences in environment, genetic background, and/or research methods. Subgroup analysis based on type of MRI machine suggested that Ktrans and Kep values were significant for the General Electric and Philips machines but not for the Siemens machine, which correlates with the different parameters and technical characteristics of the different types of MRI machine. In other meta-analyses, differences have been found according to ethnicity and type of MRI machine used.[32] The differentiation ability of Ktrans and Kep was significant for 3.0 T but not for 1.5 T when the effects of these 2 magnetic field strengths were compared in this meta-analysis.
The subgroup analyses showed that ethnicity, type of MRI machine used, and magnetic field strength were not factors leading to heterogeneity. The studies that included Whites were most often carried out in the early days of MRI when 1.5 T magnetic resonance strengths were popular and the research methods and postprocessing software were not mature. In addition, there are certain differences in the research methods used by Eastern and Western researchers. As a result, the outcome is unstable. Theoretically, 3.0 T MRI could have significant diagnostic advantages over imaging using MRI with a lower field strength. A higher field strength allows higher-resolution T2-weighted images and faster dynamic images to be obtained with a higher signal-to-noise ratio and more spatial resolution when compared with 1.5 T MRI.[33] Sosna et al[34] found that the image quality at 3.0 T without an endorectal coil was comparable with that at 1.5 T with an endorectal coil. Therefore, to take full advantage of the benefits of high field strength, improved acquisition techniques are required.
Heterogeneity could also be generated by other related factors, including the technical characteristics of DCE-MRI scanning and the pathologic reference standard. First, the scanning protocols and measurements implemented by different companies vary significantly, and there are as yet no standardized DCE-MRI techniques. Second, some studies were based on TRUS-Bx as the standard of reference rather than whole-mount prostatectomy specimens. The prediction of final histologic grades based on TRUS-Bx has been questioned in some reports.[14] Due to sampling error, the properties of tissue collected by biopsy may not accurately reflect the tissue properties found after radical prostatectomy.[35] Sampling error and misregistration might lead to confusion between cancerous and noncancerous tissues. Small cancer foci may be missed and there is the possibility of a false-negative diagnosis. In addition, it was difficult to correlate the MR images with the histologic results from biopsy in an accurate manner. A study by Kozlowski et al[21] reported that 41 of 177 negative biopsies were identified as false-positive on MRI. Taken together, studies in the present meta-analysis may have adopted different reference standards, used different methodologies and operative techniques, and measured different outcomes; further, other as yet unknown factors might have also contributed to the significant between-study heterogeneity. Pooling of data using the random-effects model might reduce the effect of heterogeneity, but does not eliminate it.
After the sensitivity analyses, we found that the value of Ve in the differential diagnosis of PCa and noncancerous PZ tissue was unstable. Most of the studies included in our meta-analysis showed that the Ve value was not significant in differential diagnosis. Nevertheless, a small number of studies[14,16,17] have suggested that the Ve value can differentiate between PCa and noncancerous PZ tissue, thus influencing the final comprehensive effect value. There are some reasons for these inconsistent findings. The report by Padhani et al[14] was the earliest evaluation of the clinical value of the quantitative parameters of DCE-MRI in PCa. However, application of the scanning sequence parameters, the examination technique used, and the postprocessing software needed improvement, which accounts for why this study and the follow-up studies have had such variable outcomes. Another study by Li et al[16] showed that the Ve value could differentiate between PCa and noncancerous PZ tissue, but this may be attributable to the fact that the PCa group in that study had a Gleason score of ≥7, which indicates a comparatively high grade of malignancy and would result in significantly higher values in PCa. Thus, the difference in the Ve value between PCa and noncancerous PZ tissue was more significant. There are reports in the literature of higher-grade cancers having greater microvessel density,[36,37] and these support the above speculation. Cai et al[17] suggested that the significant Ve value found in their study could be explained by recruitment of a large number of patients with advanced PCa and the fact that their lesions had larger extravascular and extracellular volumes when compared with lesions at any earlier stage. Therefore, further studies including larger samples are needed to confirm the diagnostic value of Ve for PCa and noncancerous PZ tissue.
In our study, the Ktrans and Kep values were significantly higher in PCa than in noncancerous PZ tissue, which is in agreement with most reports in the literature.[14–17,21,22,24,26–29] However, some studies have reported different results. Langer et al[23,25] found no significant difference in the Ktrans value between PCa and noncancerous PZ tissue and mentioned several possible reasons for this inconsistent result. First, the discrepancy may have been partially attributable to calculation of the median rather than the mean; median values avoid bias resulting from rapidly enhancing portions of tumor tissue. Second, the study restricted normal data to voxels within the regions of interest in normal PZ tissue. Further, the radiologist transferred the regions of interest on MRI without consulting the pathologist.
There have been conflicting reports in the literature as to whether the quantitative parameters of DCE-MRI are also able to differentiate PCa from benign prostatic hyperplasia (BPH).[11,12] Our meta-analysis showed that the Ktrans and Kep values were significant in the differential diagnosis of PCa and noncancerous CG tissue, but the Ve value was not significant. Subgroup analyses revealed no significant differences in the ability of Ktrans and Kep values to differentiate PCa and noncancerous CG tissue in Whites, when a magnetic field strength of 1.5 T was used, or when a Siemens machine was used (Table 4). We speculate that the reason for this finding is related to the overlap of cancer foci and angiogenesis of hyperplastic nodules. Angiogenesis is not a constant feature of all cancers, especially small ones, and not all angiogenesis is due to cancer, but can also be caused by BPH and high-grade prostatic intraepithelial neoplasia.[38] An overlap of the microvessel density counts between PCa and noncancerous BPH has also been observed.[14,15,39] Although the usefulness of Ktrans and Kep values for differentiating PCa from noncancerous CG tissue is controversial, this meta-analysis confirms their value in differential diagnosis; the results are highly stable and may have a pathologic basis, given that the vessel density in PCa is twice that in BPH nodules, and the distribution of the vessels is not uniform.[40] Most studies included in our meta-analysis reported that the Ve value was not significant in the differential diagnosis of PCa and noncancerous CG tissue, but a few studies[21,24,30] have reported different results. Xu et al[30] reported that the Ve value was significantly higher in PCa than in hyperplastic tissues; in that study, the increased amount of contrast medium entering the extravascular and extracellular spaces, which leads to an increase in the Ve value, may have been caused by increased permeability of the tumor tissue and the difference in concentration of the contrast medium between that in the blood vessels and that in the extracellular space, which induces the migration of contrast medium through the vascular wall. This conclusion is similar to that of Cornud et al.[41] It is somewhat surprising that Kozlowski et al[21,24] and Chen et al[26] found the Ve value to be significantly lower in PCa than in noncancerous CG tissue. These 3 reports are somewhat difficult to explain based on our knowledge. Therefore, further studies that include large prospective samples are needed to confirm the clinical value of Ve.
The current study, to our knowledge, is the first meta-analysis to evaluate the clinical value of quantitative parameters of DCE-MRI in PCa and noncancerous tissues. First, we evaluated the performance of Ktrans, Kep, and Ve values in the differential diagnosis of PCa. Second, the noncancerous area, according to the anatomy of the prostate, was divided into noncancerous PZ tissue and noncancerous CG tissue, and the diagnostic value of Ktrans, Kep, and Ve was compared between these 2 areas and PCa tissue.
There are a few limitations to this meta-analysis. First, several of the included studies contained relatively few patients, which may have limited the strength of our conclusions. Second, although a comprehensive literature search was performed using several authoritative databases while neglecting gray literature and papers not published in English or Chinese, this approach might have introduced potential publication bias. Finally, the lack of a standard protocol for DCE-MRI and differences between different research centers with regard to postprocessing software, acquisition sequence, contrast injection, and the method used to calculate arterial input function could lead to inconsistent results. However, DCE-MRI is based on compartmental pharmacokinetic models of tracer kinetics, and the present study evaluated differences in the quantitative parameters of DCE-MRI between PCa and noncancerous tissue and did not compare the results obtained using different methodologies. Thus, the influence of the above factors would be relatively limited in the present meta-analysis.
5. Conclusion
This meta-analysis shows that Ktrans and Kep values are reliable parameters for differentiating PCa from noncancerous tissue. The Ve value is not helpful in distinguishing PCa from noncancerous CG tissue, and its ability to differentiate between PCa and noncancerous PZ tissue remains uncertain.
Footnotes
Abbreviations: BPH = benign prostatic hyperplasia, CG = central gland, CI = confidence interval, DCE-MRI = dynamic contrast-enhanced magnetic resonance imaging, Kep = reverse reflux rate constant between extracellular space and plasma, Ktrans = forward volume transfer constant, PCa = prostate cancer, PZ = peripheral zone, QUADAS = quality assessment of diagnostic accuracy studies, SD = standard deviation, SMD = standardized mean difference, TRUS-Bx = transrectal ultrasound-guided prostate biopsy, Ve = the fractional volume of extracellular space per unit volume of tissue.
The authors have no conflicts of interest to disclose.
References
- [1].Siegel R, Ma J, Zou Z, et al. Cancer statistics, 2014. CA Cancer J Clin 2014;64:9–29. [DOI] [PubMed] [Google Scholar]
- [2].Epstein JI, Amin M, Boccon-Gibod L, et al. Prognostic factors and reporting of prostate carcinoma in radical prostatectomy and pelvic lymphadenectomy specimens. Scand J Urol Nephrol Suppl 2005;34–63. [DOI] [PubMed] [Google Scholar]
- [3].Shimizu T, Nishie A, Ro T, et al. Prostate cancer detection: the value of performing an MRI before a biopsy. Acta Radiol 2009;50:1080–8. [DOI] [PubMed] [Google Scholar]
- [4].Zhang X, Wang X, Lu J, et al. MR imaging of incidentally detected prostate carcinoma in the central gland of prostate: preliminary study. Chin J Magn Reson Imaging 2010;1:264–7. [Google Scholar]
- [5].Weinreb JC, Barentsz JO, Choyke PL, et al. PI-RADS prostate imaging—reporting and data system: 2015, Version 2. Eur Urol 2016;69:16–40. [DOI] [PMC free article] [PubMed] [Google Scholar]
- [6].Verma S, Turkbey B, Muradyan N, et al. Overview of dynamic contrast-enhanced MRI in prostate cancer diagnosis and management. AJR Am J Roentgenol 2012;198:1277–88. [DOI] [PMC free article] [PubMed] [Google Scholar]
- [7].Tofts PS, Brix G, Buckley DL, et al. Estimating kinetic parameters from dynamic contrast-enhanced T(1)-weighted MRI of a diffusable tracer: standardized quantities and symbols. J Magn Reson Imaging 1999;10:223–32. [DOI] [PubMed] [Google Scholar]
- [8].Russo G, Mischi M, Scheepens W, et al. Angiogenesis in prostate cancer: onset, progression and imaging. BJU Int 2012;110:E794–808. [DOI] [PubMed] [Google Scholar]
- [9].Bergers G, Benjamin LE. Tumorigenesis and the angiogenic switch. Nat Rev Cancer 2003;3:401–10. [DOI] [PubMed] [Google Scholar]
- [10].van der Sanden BPJ, Rozijn TH, Rijken P, et al. Noninvasive assessment of the functional neovasculature in 9L-glioma growing in rat brain by dynamic H-1 magnetic resonance imaging of gadolinium uptake. J Cerebral Blood Flow Metabolism 2000;20:861–70. [DOI] [PubMed] [Google Scholar]
- [11].Muramoto S, Uematsu H, Kimura H, et al. Differentiation of prostate cancer from benign prostate hypertrophy using dual-echo dynamic contrast MR imaging. Eur J Radiol 2002;44:52–8. [DOI] [PubMed] [Google Scholar]
- [12].Engelbrecht MR, Huisman HJ, Laheij RJF, et al. Discrimination of prostate cancer from normal peripheral zone and central gland tissue by using dynamic contrast-enhanced MR imaging. Radiology 2003;229:248–54. [DOI] [PubMed] [Google Scholar]
- [13].Wade J, Rosario DJ, Macefield RC, et al. Psychological impact of prostate biopsy: physical symptoms, anxiety, and depression. J Clin Oncol 2013;31:4235–40. [DOI] [PubMed] [Google Scholar]
- [14].Padhani AR, Gapinski CJ, Macvicar DA, et al. Dynamic contrast enhanced MRI of prostate cancer: correlation with morphology and tumour stage, histological grade and PSA. Clin Radiol 2000;55:99–109. [DOI] [PubMed] [Google Scholar]
- [15].van Dorsten FA, van der Graaf M, Engelbrecht MR, et al. Combined quantitative dynamic contrast-enhanced MR imaging and (1)H MR spectroscopic imaging of human prostate cancer. J Magn Reson Imaging 2004;20:279–87. [DOI] [PubMed] [Google Scholar]
- [16].Li C, Chen M, Li S, et al. A preliminary study of diagnosing prostate cancer with quantitative analysis of dynamic contrastenhanced MR at 3.0 T. Chin J Radiol 2011;45:50–4. [Google Scholar]
- [17].Cai W, Li F, Wang J, et al. A comparison of arterial spin labeling perfusion MRI and DCE-MRI in human prostate cancer. NMR Biomed 2014;27:817–25. [DOI] [PubMed] [Google Scholar]
- [18].Whiting PF, Rutjes AW, Westwood ME, et al. QUADAS-2: a revised tool for the quality assessment of diagnostic accuracy studies. Ann Intern Med 2011;155:529–36. [DOI] [PubMed] [Google Scholar]
- [19].Jackson D, White IR, Riley RD. Quantifying the impact of between-study heterogeneity in multivariate meta-analyses. Stat Med 2012;31:3805–20. [DOI] [PMC free article] [PubMed] [Google Scholar]
- [20].Zintzaras E, Ioannidis JPA. Heterogeneity testing in meta-analysis of genome searches. Genet Epidemiol 2005;28:123–37. [DOI] [PubMed] [Google Scholar]
- [21].Kozlowski P, Chang SD, Jones EC, et al. Combined diffusion-weighted and dynamic contrast-enhanced MRI for prostate cancer diagnosis—correlation with biopsy and histopathology. J Magn Reson Imaging 2006;24:108–13. [DOI] [PubMed] [Google Scholar]
- [22].Ocak I, Bernardo M, Metzger G, et al. Dynamic contrast-enhanced MRI of prostate cancer at 3 T: a study of pharmacokinetic parameters. AJR Am J Roentgenol 2007;189:849. [DOI] [PubMed] [Google Scholar]
- [23].Langer DL, van der Kwast TH, Evans AJ, et al. Prostate cancer detection with multi-parametric MRI: logistic regression analysis of quantitative T2, diffusion-weighted imaging, and dynamic contrast-enhanced MRI. J Magn Reson Imaging 2009;30:327–34. [DOI] [PubMed] [Google Scholar]
- [24].Kozlowski P, Chang SD, Meng R, et al. Combined prostate diffusion tensor imaging and dynamic contrast enhanced MRI at 3T-quantitative correlation with biopsy. Magn Reson Imaging 2010;28:621–8. [DOI] [PMC free article] [PubMed] [Google Scholar]
- [25].Langer DL, van der Kwast TH, Evans AJ, et al. Prostate tissue composition and MR measurements: investigating the relationships between ADC, T2, K-trans, v(e), and corresponding histologic features. Radiology 2010;255:485–94. [DOI] [PubMed] [Google Scholar]
- [26].Chen Y-J, Chu W-C, Pu Y-S, et al. Washout gradient in dynamic contrast-enhanced MRI is associated with tumor aggressiveness of prostate cancer. J Magn Reson Imaging 2012;36:912–9. [DOI] [PubMed] [Google Scholar]
- [27].Li C, Chen M, Li S, et al. Detection of prostate cancer in peripheral zone: comparison of MR diffusion tensor imaging, quantitative dynamic contrast-enhanced MRI, and the two techniques combined at 3.0 T. Acta Radiol 2014;55:239–47. [DOI] [PubMed] [Google Scholar]
- [28].Liu H, Zhao W, Ren F, et al. Quantitative diagnostic value of DCE-MRI in prostatic cancer. Radiol Pract 2014;29:477–81. [Google Scholar]
- [29].Cho E, Chung DJ, Yeo DM, et al. Optimal cut-off value of perfusion parameters for diagnosing prostate cancer and for assessing aggressiveness associated with Gleason score. Clin Imaging 2015;39:834–40. [DOI] [PubMed] [Google Scholar]
- [30].Xu Y, Leng X, Zheng Y, et al. Quantitative diagnostic value of 3.0 T dynamic contrastenhanced MRI in different diagnosis of prostate cancer and hyperplasia. Chin J Magn Reson Imaging 2015;6:608–12. [Google Scholar]
- [31].Hozo SP, Djulbegovic B, Hozo I. Estimating the mean and variance from the median, range, and the size of a sample. BMC Med Res Methodol 2005;5:13–13. [DOI] [PMC free article] [PubMed] [Google Scholar]
- [32].Qu R-F, Guo D-R, Chang Z-X, et al. Differential diagnosis of benign and malignant breast tumors using apparent diffusion coefficient value measured through diffusion-weighted magnetic resonance imaging. J Comput Assist Tomogr 2015;39:513–22. [DOI] [PubMed] [Google Scholar]
- [33].Futterer JJ, Scheenen TWJ, Huisman HJ, et al. Initial experience of 3 tesla endorectal coil magnetic resonance imaging and H-1-spectroscopic imaging of the prostate. Investig Radiol 2004;39:671–80. [DOI] [PubMed] [Google Scholar]
- [34].Sosna J, Pedrosa I, Dewolf WC, et al. MR imaging of the prostate at 3 Tesla: comparison of an external phased-array coil to imaging with an endorectal coil at 1.5 Tesla. Acad Radiol 2004;11:857–62. [DOI] [PubMed] [Google Scholar]
- [35].Steinberg DM, Sauvageot J, Piantadosi S, et al. Correlation of prostate needle biopsy and radical prostatectomy Gleason grade in academic and community settings. Am J Surg Pathol 1997;21:566–76. [DOI] [PubMed] [Google Scholar]
- [36].Kurhanewicz J, Vigneron D, Carroll P, et al. Multiparametric magnetic resonance imaging in prostate cancer: present and future. Curr Opin Urol 2008;18:71–7. [DOI] [PMC free article] [PubMed] [Google Scholar]
- [37].Erbersdobler A, Isbarn H, Dix K, et al. Prognostic value of microvessel density in prostate cancer: a tissue microarray study. World J Urol 2010;28:687–92. [DOI] [PubMed] [Google Scholar]
- [38].Alonzi R, Padhani AR, Allen C. Dynamic contrast enhanced MRI in prostate cancer. Eur J Radiol 2007;63:335–50. [DOI] [PubMed] [Google Scholar]
- [39].Griebel J, Mayr NA, de Vries A, et al. Assessment of tumor microcirculation: a new role of dynamic contrast MR imaging. J Magn Reson Imaging 1997;7:111–9. [DOI] [PubMed] [Google Scholar]
- [40].Bigler SA, Deering RE, Brawer MK. Comparison of microscopic vascularity in benign and malignant prostate tissue. Hum Pathol 1993;24:220–6. [DOI] [PubMed] [Google Scholar]
- [41].Cornud F, Beuvon F, Thevenin F, et al. Quantitative dynamic MRI and localisation of non-palpable prostate cancer. Prog Urol 2009;19:401–13. [DOI] [PubMed] [Google Scholar]