

Summary
An increasing number of biomolecular structures are solved by electron microscopy (EM). However, the quality of structure models determined from EM maps vary substantially. To understand to what extent structure models are supported by information embedded in EM maps, we used two computational structure refinement methods to examine how much structures can be refined using a dataset of 49 maps with accompanying structure models. The extent of structure modification as well as the disagreement between refinement models produced by the two computational methods scaled inversely with the global and the local map resolutions. A general quantitative estimation of deviations of structures for particular map resolutions are provided. Our results indicate that the observed discrepancy between the deposited map and the refined models is due to the lack of structural information present in EM maps and thus these annotations must be used with caution for further applications.
e-Toc
A dataset of 49 protein structure models determined by electron microscopy were refined with two computational structure modeling methods. The extent of structure modification as well as the disagreement between refinement models by the two methods scaled inversely with the global and the local map resolutions.

Introduction
Electron microscopy, particularly, cryo-electron microscopy (cryo-EM) is an emerging technique in structural biology for determining three dimensional (3D) structures of large biological macromolecules. Its notable advantage of solving large macromolecular assemblies is complementary to conventional structural biology techniques, such as X-ray crystallography and nuclear magnetic resonance (NMR), bridging atomic-detailed structures of molecules with higher level structure information of molecular machinery and interactions in a cell. A recent technical breakthroughs in cryo-EM both in its hardware (Faruqi and Henderson, 2007) and software (Scheres, 2012) have enabled determining 3D structures to nearly atomic-level resolutions (Kuhlbrandt, 2014a, b), which has further attracted biologists to apply this new technology to their biological systems. Cryo-EM, together with other types of EM, has now become a key technique in structural biology. The number of structures solved by EM is increasing rapidly, resulting in over 3,600 EM density maps deposited and stored in the EM Data Bank (EMDB) (Velankar et al., 2016), the primary repository of EM density maps.
Although near-atomic resolution structures have been reported frequently in recent years, about 90% of released maps are solved at a resolution of 5 Å or worse (Lawson et al., 2011). Typically, a structure model is built partly manually with assistance from some computational structure building methods (Esquivel-Rodriguez and Kihara, 2013) and visualization software (Pettersen et al., 2004). Homology models are commonly used in this process if a homologous protein structure is available as a template for modeling (Yang et al., 2012; Zhu et al., 2010). Various types of structure building methods exist, which range from rigid body docking (structure fitting) (Ceulemans and Russell, 2004; Esquivel-Rodriguez and Kihara, 2012; Rossmann, 2000; Woetzel et al., 2012), local structure identification (Dror et al., 2007; Jiang et al., 2001), to flexible fitting (McGreevy et al., 2014; Wang et al., 2015), to meet needs of different situations of modeling.
In EMDB, even EM maps of a low resolution is often accompanied with structure models. Structure models are fit in EM maps determined at a resolution of as low as 40 Å. Even among EM maps of 20 Å or worse, models were built for 6.4 % of the maps. Structure models built from EM maps were used as basis of discussion on mechanisms of biological functions of the macromolecules often without careful consideration about to what extent the modeled structure is supported by the EM maps. However, the quality of structure models would vary substantially depending on the global and local resolution of EM maps as well as methods used for building structure models. Currently, in EMDB, fit of a structure model to an EMDB map are validated through visual inspection and the stereochemistry of a model deposited in PDB are checked in the same way as regular PDB entries; however, standards of validation are still yet to be developed (Lawson et al., 2011). The lack of a standardized method for assessing model quality brings the reliability of some structure models into question.
In this work, to investigate to what extent structure models are supported by the electron density of the EM maps, we used two structure modeling/refinement methods to determine if structure models had an increased fit to their map after refinement. More concretely, for 49 EM maps of a wide range of resolutions, we ran two structure fitting/refinement protocols, Molecular Dynamics Flexible Fitting (MDFF) (McGreevy et al., 2014; McGreevy et al., 2016) and Rosetta (Wang et al., 2015) starting from the deposited structure models and observed changes of cross correlation of the models to the EM maps and the energy of those structures. These two programs were chosen because they are among the most popular structure modeling and refinement tools used for protein structure determination of EM maps. They are capable of refining structures based on sound physical principles. The energy of the structures was tracked throughout the refinement to ensure that the structure was not undergoing undue stress to over-fitting to the density map. In cases where the energy of the structure decreased or stayed the same while the cross correlation increased, the refined structure was considered to be better supported than the original annotation. We observed that for over 60% of the cases tested, structures were further refined from the deposited structures. The extent of structure modification scaled inversely with the global and the local resolutions of the maps that these structures annotate. That is, the refinement protocols did not move structures much if they were derived from high-resolution EM maps, while large movements were observed for the models of low resolution EM maps. More quantitatively, the extent of the structure change in terms of the Cα root-mean square deviation (RMSD) of models after the refinement was roughly about 30% or the map resolution. We also observed that the refined models by the two refinement protocols do not agree for those with low resolution maps. The amount of discrepancy of the models also inversely correlated with the resolution of their maps. These indicate that the reliability of a structure model from an EM map critically depends on the resolution of the map and the reliability substantially decreases as the resolution of a map decreases. We conclude therefore that, unless the models were derived from high resolution maps, it is critical that structure models are used with caution for further analysis and discussion. It has been discussed that EM maps at lower resolutions contain less structure information (Henderson et al., 2012). Different types of computational structure modeling methods have been developed to address the different levels of structure information contained in maps at various resolutions (Esquivel-Rodriguez and Kihara, 2013; Villa and Lasker, 2014; Wriggers and Chacon, 2001). In developing a modeling tool, it is common to test the tool on maps at different resolutions (Jolley et al., 2008; Singharoy et al., 2016). Concerning bias and misinterpretation of densities of EM maps, validation methods have been developed for checking each step of the structure modeling process from maps (Falkner and Schroder, 2013; Rosenthal and Rubinstein, 2015). Egelman discussed problems and potential errors in structure modeling with EM maps, focusing on cases of high-resolution structure fitting to maps (Egelman, 2008). Although the problem of the model reliability from EM maps has been known, each of the earlier works addressed this problem on a small number of particular proteins. In contrast to the earlier recognition of this problem, the current work shows a comprehensive and general view on the reliability of structure models using a dataset of EM maps determined at a wide range of resolutions. Furthermore, the current work provides a general quantitative estimation of deviations of structures for particular map resolutions. Given the current situation where an increasing number of protein structures are being solved by EM and rapidly accumulated and reused, it is crucial that the reliability of structure models in EMDB is well and widely understood.
RESULTS
For a dataset of 49 EMDB entries (Table 1), structure models modified by MDFF or Rosetta are examined relative to the deposited structure models to EMDB along with the EM maps, which were the starting structures of the refinement protocols. The 49 maps were selected from 688 maps available in EMDB that were associated with fitted protein structures in PDB. Maps were removed from the initial pool if the fitted structures did not have sufficient overlap and cross correlation to the map, which indicated that maps have a large empty region or did not contain much structure information and refinement was not expected to work properly. The data selection procedure is detailed in the Method section. First we will discuss overall changes of the models in terms of the energy of the structure and the cross correlation to the EM density map. Subsequently, the amount of structural deviations is discussed relative to the global and local map resolutions. Finally, some illustrative examples are presented. The overall flowchart of the analyses performed in this work is illustrated in Figure S1.
Table 1.
The EM map dataset.
| Map ID |
Complex Name | Resolution | Mass (MDa) |
PDB ID |
Contour | Cross Correlation |
|---|---|---|---|---|---|---|
| 1046 | GroES-ADP7-GroEL-ATP7 from E.coli | 23.5 | 0.678 | 1gru | 0.029 | 0.965 |
| 1047 | GroEL-ATP from E.coli | 14.9 | 0.621 | 2c7e | 0.084 | 0.896 |
| 1149 | Recombinant protein Acr1 From M.Tuberculosis | 16.5 | 0.109 | 2byu | 0.012 | 0.8 |
| 1180 | GroEL-ATP7-GroES | 7.7 | 0.674 | 2c7c | 0.608 | 0.842 |
| 1181 | GroEL-ADP7-GroES | 8.7 | 0.674 | 2c7d | 1.9 | 0.849 |
| 1202 | GroEL-ADP-gp31 | 8.2 | 0.666 | 2cgt | 0.452 | 0.831 |
| 1494 | Saf pilus | 17 | 0.024 | 3cre | 2.95 | 0.768 |
| 1495 | Saf pilus | 17 | 0.024 | 3crf | 1.59 | 0.915 |
| 1505 | DegP dodecamer | 28 | 0.43 | 2zle | 0.013 | 0.755 |
| 1654 | RbcL8-X8 | 17 | 0.488 | 2wvw | 3 | 0.757 |
| 1655 | Rubisco assembly intermediate | 9 | 0.488 | 2wvw | 5.6 | 0.84 |
| 1871 | Needle complex from Salmonella typhimurium | 8.3 | 0.189 | 2y9k | 0.06 | 0.717 |
| 1894 | Human alphaB crystallin | 9.4 | 0.387 | 2ygd | 0.004 | 0.764 |
| 1932 | R. sphaeroides CbbX | 21 | 0.153 | 3zuh | 0.005 | 0.794 |
| 1940 | Nicotiana tabacum Rubisco Activase (R294V) | 20 | 0.144 | 3zw6 | 0.02 | 0.721 |
| 1960 | Bovine TRiC/CCT in the nucleotide-free (apo) state | 10.5 | 0.65 | 4a0o | 1.13 | 0.845 |
| 1961 | bovine TRiC/CCT in the AMP-PNP state | 10.7 | 0.682 | 4a0v | 1.13 | 0.89 |
| 1962 | bovine TRiC/CCT | 13.9 | 0.693 | 4a0w | 1 | 0.921 |
| 1963 | bovine TRiC/CCT in the ADP state | 11.3 | 0.686 | 4a13 | 1.08 | 0.873 |
| 2001 | GroEL-ATP14 Rd1-Rd3 | 8.5 | 0.618 | 4aau | 0.2 | 0.7 |
| 2003 | GroEL-ATP14 Rd5-Rdopen | 8.5 | 0.618 | 4ab3 | 0.2 | 0.77 |
| 2325 | GroEL variant EL43Py capped by GroES | 8.9 | 0.678 | 3zpz | 1.3 | 0.93 |
| 2327 | Non-native RuBisCO substrate protein encapsulated in GroEL cavity | 15.9 | 0.678 | 3zq1 | 1 | 0.91 |
| 2365 | Bacteriophage MS2 bound to its receptor, the E. coli F-pilus | 39 | 1.987 | 4bp7 | 1.45 | 0.815 |
| 2526 | MloK1 with cAMP | 7 | 0.118 | 4chv | 2.3 | 0.964 |
| 2548 | Fv antibody domain bound beta-galactosidase | 13 | 0.45 | 4ckd | 0.13 | 0.946 |
| 2807 | rabbit RyR1 in complex with its modulator FKBP12 | 3.8 | 1.177 | 3j8h | 0.04 | 0.73 |
| 2856 | Dynactin complex from pig brain | 4 | 0.429 | 5adx | 0.088 | 0.808 |
| 2924 | Recombinant human APC/C-Cdh1-Emi1 ternary complex | 3.6 | 0.779 | 4ui9 | 0.07 | 0.867 |
| 2984 | E. coli beta-galactosidase | 2.2 | 0.371 | 5a1a | 0.05 | 0.456 |
| 5169 | E. coli RNA polymerase | 11 | 0.289 | 3lu0 | 11 | 0.845 |
| 5186 | human apoptosome with bound procaspase-9 CARD | 9.5 | 0.798 | 3j2t | 1.3 | 0.869 |
| 5258 | Lidless D386A Mm-cpn variant | 8 | 0.674 | 3j02 | 0.02 | 0.836 |
| 5395 | rATcpn-beta in apo state | 8.3 | 0.794 | 3j1e | 5 | 0.795 |
| 5450 | YiiP from Shewanella oneidensis in DOPG lipids | 13 | 0.052 | 3j 1z | 3.33 | 0.91 |
| 5466 | Enterovirus 71 empty capsid | 9.2 | 3.719 | 3j23 | 1 | 0.834 |
| 5607 | MecA-ClpC(E280A) | 9 | 0.477 | 3j3t | 1.5 | 0.866 |
| 5608 | MecA-ClpC(E618A) | 11 | 0.477 | 3j3s | 1.5 | 0.866 |
| 5609 | MecA-ClpC (E280A,E618A) with ATP | 10 | 0.477 | 3j3u | 1.5 | 0.857 |
| 5610 | MecA-ClpC(E280A,E618A)with ADP | 9.4 | 0.477 | 3j3r | 1.5 | 0.878 |
| 5679 | Aquaporin-0 bound to Calmodulin | 25 | 0.107 | 3j41 | 4.96 | 0.798 |
| 5776 | Rat TRPV1 in complex with DkTx and resiniferatoxin | 3.8 | 0.217 | 3j5q | 7 | 0.678 |
| 5925 | MAVS filament | 3.64 | 0.073 | 3j6j | 0.3 | 0.868 |
| 5995 | Escherichia coli beta-galactosidase | 3.2 | 0.371 | 3j7h | 0.0224 | 0.764 |
| 6272 | 13-fold average of VP6 trimer from full rotavirus reconstruction | 2.6 | 0.108 | 3j9s | 0.0198 | 0.684 |
| 6337 | Vesicular Stomatitis Virus L-Protein | 3.8 | 0.183 | 5a22 | 1.2 | 0.707 |
| 6344 | Zebra fish alpha-1 glycine receptor bound with strychnine | 3.9 | 0.158 | 3jad | 7 | 0.693 |
| 6345 | Zebra fish alpha-1 glycine receptor bound with glycine | 3.9 | 0.158 | 3jae | 6.5 | 0.7 |
| 6346 | Zebra fish alpha-1 glycine receptor bound with glycine/ivermectin | 3.8 | 0.16 | 3jaf | 7 | 0.714 |
The table lists a dataset of 49 EM maps from EMDB and associated protein structure models used in this study.
EMDB ID, name of the complex, map resolution, molecular mass calculated from the PDB file, PDB ID of the structure model that was fit to the map, the author-recommended contour level, and the cross correlation between the maps and their models are provided.
Changes in energy and cross-correlation
Figure 1 shows the change observed in the energy and cross-correlation to their EM maps of structure models before and after the refinement protocols. The energy change of a structure, namely, the CHARMM potential energy for MDFF and the Rosetta free energy for the Rosetta protocol, indicates how well the structure is refined without considering its fit to the EM map. The difference of the CHARMM potential energy for MDFF was computed against the initial structure at the start of the refinement, i.e. after the initial energy minimization is applied, which removes atomic clashes, and the temperature is raised to 300K. On the other hand, cross-correlation of a structure to its EM map indicates how well the electron density of the protein structure model agrees with the EM electron density map. If the cross correlation increases after refinement, it is an indication that the refined structure is globally in better agreement with the map data. For MDFF, results for refinements with for different g-scale values, 0.1, 0.3, 0.5, and 0.7 are shown (Fig. 1a). The g-scale controls how much the fit to the EM map contributes to the overall potential function used in MDFF (see Methods). Refinements with large g-scale values cause their structure to fit more to their map, and the opposite with a small g-scale value.
Figure 1.

Change in the potential energy and cross-correlation to EM maps of the refined protein structure models. The two values were computed after the refinement in comparison with the initial structure. dCC, the difference of the cross-correlation; dE, difference of the energy of structure models. (a), Results using MDFF with four different g-scale values, 0.1 (filled circles), 0.3 (red circles), 0.5 (green triangles), 0.7 (yellow triangles). The energy was evaluated with the CHARMM potential energy used in MDFF, excluding the map fitness term. The figure shows results for 47 EM maps excluding two virus capsids, EMD-2365 and EMD-5466, which showed exceptionally large positive dE (see text). The inset figure includes al 49 maps. (b), results using Rosetta. The Rosetta free energy was used.
MDFF results (Fig. 1a) show that the energy of almost all the models were lowered after the refinement. There were two exceptions, both virus capsid structures, EMD-2365 and EMD-5466, which showed exceptionally large positive energy after running MDFF (Fig. 1a, inset). These two EM maps were solved at a relatively low resolution, 39 Å and 9.2 Å respectively, and the associated crystal structures, which are slightly larger than the EM maps were fit to the maps by rigid body fitting. Therefore, the structures were compressed by the MDFF runs to better fit into the maps, which caused a small positive energy for many atoms in the capsids that accumulated into a large positive energy. The results are summarized in Table S1 by classifying the cases into four categories, cases that the cross-correlation increased by sacrificing potential energy by MDFF (i.e. an increase of cross-correlation, i.e. dCC > 0, with an increase of the energy, dE > 0), cases that both energy and cross correlation became worse (i.e. dE > 0 and dCC < 0), an energy decrease was accompanied with an increase of cross-correlation (i.e. dE < 0 and dCC > 0), and an energy decrease occurred by reducing the global fit to the EM map (i.e. dE < 0 and dCC < 0). When cross-correlation is concerned, for all the g-scale values used, an increase is seen for more than 60% of the proteins after their refinement. Naturally, in general an increase of cross-correlation is observed when a large g-scale value is used. When g-scale was set to 0.1, cross-correlation increased for 32 cases, while such cases increased to 42 and 37 with for g-scales of both 0.5 and 0.7. Turning our attention to the change of potential energy of structures, lowering of energy (dE < 0) was observed for all of the cases except for the two cases, EMD-2365 and EMD-5466. Lowering of energy was accompanied by the decrease cross-correlation for 17 cases with a g-scale of 0.1, which decreased as a larger g-scale was used. Finally, both lowering energy (dE < 0) and increase of cross-correlation (dCC > 0) was observed for more than 60% of the cases, 61.2% (30/49) with a g-scale of 0.1, and largest at 81.6% (40/49) with a g-scale of 0.5. The results are essentially the same with the Rosetta refinement protocol; improvement in both Rosetta free energy and cross-correlation was observed for 69.4% (34/49) of the cases (Fig. 1b). In both Figure 1a and 1b, dCC did not show clear correlation to the change of the structure energy mainly because each data point in the plots is from different protein structure. Models that underwent the MDFF protocol were cross-evaluated with the Rosetta free energy in Table S2 and vice versa in Table S3. As shown in Table S2, for the majority of the cases the MDFF protocol also lowered their Rosetta energy. Similarly, for almost all of the cases, the Rosetta protocol lowered the CHARMM energy, too (Table S3).
In addition to the CHARMM potential energy and the Rosetta free energy, we further examined structural change by the refinements with the MolProbity Score (MPScore) (Chen et al., 2010) (Fig. 2, Table 2). MPScore is a structure validation score used to evaluate the quality of a protein structure solved by experiments typically before submission to public databases. MPScore considers atom clashes, outliers of rotamers, and main-chain dihedral angles and exhibits a high value if a structure has many unfavorable such features. Thus, if the local quality of a structure was improved by a refinement protocol, its MPScore decreases. We used MPScore as an additional independent structure evaluation, which was not the target of optimization by the two refinement methods. When MDFF was used, the MPScore improved (i.e. decreased) almost all the models except for a couple of cases regardless of the g-scale value used (Fig. 2a, Table 2). 61.2 % (30/49 with 0.1 g-scale) to 81.6 % (40/49 with a 0.5 g-scale) of the structures showed improvement in both MPScore and cross-correlation. In the case of Rosetta, a MPScore improvement was observed for 36 structures, among which 25 were associated with increase of cross-correlation (Fig. 2b). With the Rosetta protocol, more models (13 models) deteriorated their MPScores than with MDFF.
Figure 2.
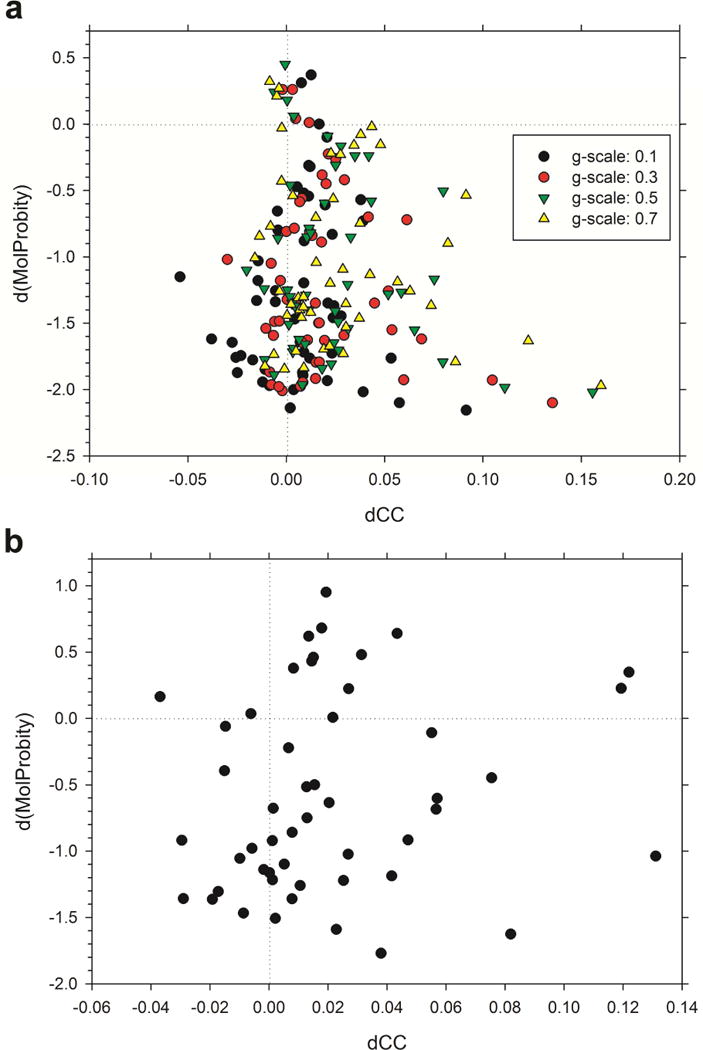
Change in MolProbity score (MPScore) and cross correlation between initial models and final refined models. (a), MDFF refinement results; (b), models refined with Rosetta.
Table 2.
Classification of refined structure models using the MolProbity score.
| Method | dM>0 & dCC>0 | dM>0 & dCC<0 | dM<0 & dCC>0 | dM<0 & dCC<0 |
|---|---|---|---|---|
| MDFF (0.1) | 2 | 0 | 30 | 17 |
| MDFF (0.3) | 3 | 1 | 35 | 10 |
| MDFF (0.5) | 2 | 2 | 40 | 5 |
| MDFF (0.7) | 0 | 3 | 37 | 9 |
| Rosetta | 13 | 0 | 25 | 11 |
49 structure models are classified in terms of the direction of the change in term of MolProbity score and cross-correlation to its EM maps.
dM, the difference of the MolProbity score of a structure model after the refinement relative to the initial structure; dCC, the difference of cross-correlation of a structure model to its EM map after the refinement relative to the initial structure. The numbers in the parentheses for MDFF are the g-scale value used.
To summarize this section, the majority of atomic-detailed structures deposited to EMDB can have better fit to their EM maps, and almost all among such cases also showed better structural energy. These results are consistent for three scores/energies: CHARMM, Rosetta energy, and MPScore. Particularly, it is worth mentioning that the consistent trend was observed with an independent scoring function, MPScore.
Structure change relative to global map resolution
Next, we examined how much structures were changed by the refinement protocols in consideration with their associated EM map resolution. Fig. 3a shows Cα RMSD between structures before and after the refinement using MDFF with different g-scale values relative to the EM map resolution. Fig 3b shows results when Rosetta was used. In all of the plots, an inverse correlation was observed between map resolution and model-refinement RMSD. Structures tend to move more by MDFF when a larger g-scale value is used. It is apparent that the extent of the structure modification became larger as the map resolution decreases (i.e. larger resolution values on the x-axis). Results for MDFF with a g-scale of 0.5 fit to a weighted linear regression of RMSD = 0.528 + 0.247*(map resolution) with an r2 of 0.541. Since the distribution shows heteroscedasticity (i.e. a fan-like distribution where the variance of RMSD becomes larger as the map resolution values increases), the reciprocal predicted RMSD value was used as weights. According to this regression line, estimated structural deviation (RMSD) for a model is about 26–31% (e.g. for a resolution of 8.0 Å, estimated RMSD is 2.50 Å, which is 31.3% of 8.0 Å) of the map’s resolution. For the Rosetta refinement (Fig. 3b), a consistent relationship between the map resolution and the extent of model modification was observed. Compared with the MDFF refinement, Rosetta tended to make a larger modification than MDFF with a 0.5 g-scale. The RMSD relative to the map resolution fits to a weighted regression of −0.046 + 0.343 * (map resolution) with r2 of 0.504. The regression line is shown in Fig. 3b. According to this regression, the modification (RMSD) by Rosetta is roughly 33% of the map resolution.
Figure 3.
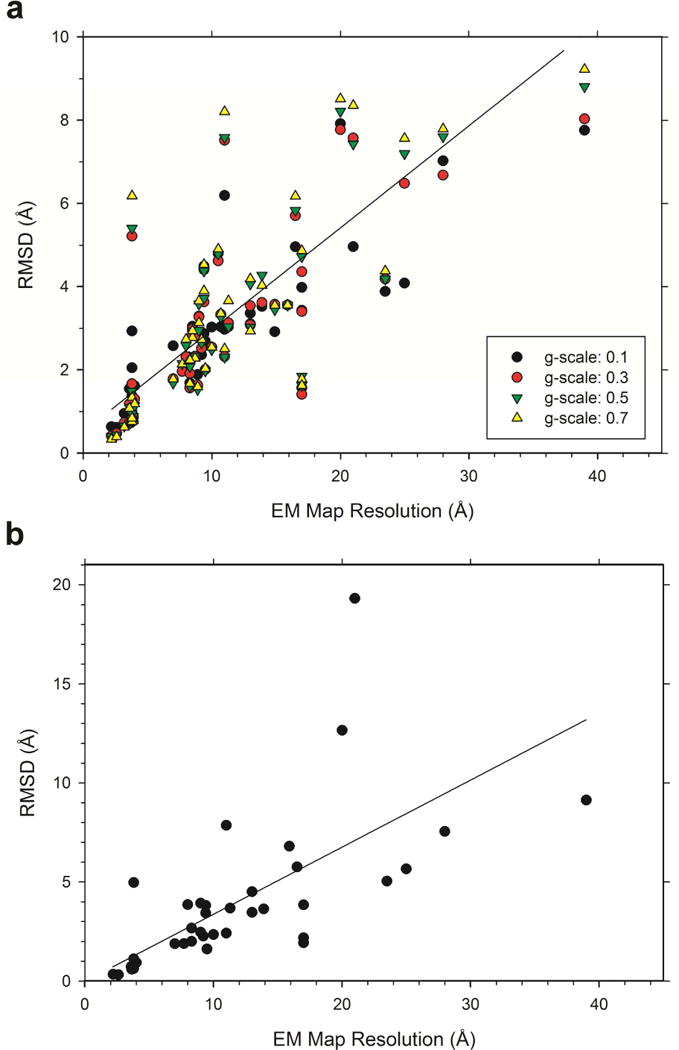
RMSD between the initial fitted protein model and the final structure after refinement against the resolution of their respective maps. (a), Results for MDFF with four different g-scale values, 0.1 (filled circles), 0.3 (red circles), 0.5 (green triangles), 0.7 (yellow triangles). The line shown is a weighted regression line for a g-scale of 0.5: RMSD = 0.528 + 0.247 *(map resolution). The reciprocal predicted value was used for weights. r2 is 0.541. (b), results for Rosetta. A weighted regression line using the reciprocal predicted value is shown: RMSD = −0.046 + 0.343*(map resolution). r2 is 0.504. To compute the regression lines, redundant entries of the same proteins with a similar map resolution and RMSD values were excluded. Those excluded were (GroEL: 2c7d, 2cgt, 4aau, 4ab3, 3zpz; α-1 glycine receptor: 3jad, 3jae; MacA-ClpC complex: 3j3r, 3j3s, 3j3u; β-galactosidase: 3j7h; TriC: 4a0v).
We further compared refined structures by MDFF and Rosetta to determine the discrepancy between the end results of these refinement protocols. Figure 4a shows RMSD between the refined structures produced by these two protocols. It shows that the discrepancy (i.e. RMSD) scaled inversely with map resolution, providing a similar picture as Figure 4. Four different symbols indicate comparison against MDFF results with the four different g-scale values. The overall trend does not change by using different g-scale values, but when examined closely, the discrepancy of MDFF-refined models against Rosetta-refined models are largest when a g-scale of 0.1 was used and smallest when 0.7 was used for the g-scale (Fig. 4b, Table S4 in Supplemental Information). This is reasonable because a larger g-scale makes the model refinement by MDFF more biased to the EM map, and influence of the different potential functions for Rosetta and MDFF is minimized. To summarize Figure 3 and Figure 4a, as a map resolution lowers, the two structure refinement protocols modify an initial structure with a larger extent, but the deviation of the resulting models by the two methods also increases. This result clearly indicates that maps with a low resolution do not have sufficient structure information to lead to a single model solution.
Figure 4.

RMSD between the refined models using MDFF and Rosetta. (a), RMSD between Rosetta and MDFF refined models relative to the map resolutions. For MDFF, the four different g-scales were used. The color code is the same as Figs. 1 and 3. (b), RMSD between refined models by Rosetta and refined models by MDFF with a g-scale of 0.5 relative to the cases when a g-scale of 0.1 was used for MDFF.
Comparison with other crystal structures
In Figure 5, we compared refined models with other crystal structures of the same protein. Two contrasting examples of EM maps and their associated structure models were used. The first example shown in Figure 5a and 5b is an EM map of beta-galactosidase, EMD-5955 (PDB ID: 3j7h) in comparison with five other crystal structures (see the figure caption). This structure was solved at a high resolution, 3.2 Å. In this case, the energy difference of the refined model relative to the initial structure in terms of the CHARMM (Fig. 5a) and Rosetta (Fig. 5b) (the empty circle) energies was in the same range as the other crystal structures. The RMSD of the refined model from the initial structure (3j7h) was 0.65 Å for MDFF and 0.53 for Rosetta, slightly smaller than the RMSD of other crystal structures to 3j7h, which ranged from 0.69 to 0.75 Å. In the next example is a GroE structure, 1gru, associated with an EM map determined at a low resolution, 23.5 Å (EMD-1046). This structure, 1gru, was a result of a rigid-body fitting of a crystal structure, 1aon, to the EM map. Since the map was determined at a low resolution, there was relatively more room for the refinement protocols to move the structure, which resulted in a larger RMSD of 4.19 Å for MDFF (Fig. 5c) and 5.04 Å for Rosetta (Fig. 5d) to the initial structure than the other five crystal structures, whose RMSD values ranged from 2.68 to 2.79 Å. This is consistent with the other EM maps in our analysis (Fig. 3). In terms of energy, the absolute energy values of the refined models by MDFF and Rosetta were in the same range as the other crystal structures (Fig. 5c and 5d).
Figure 5.
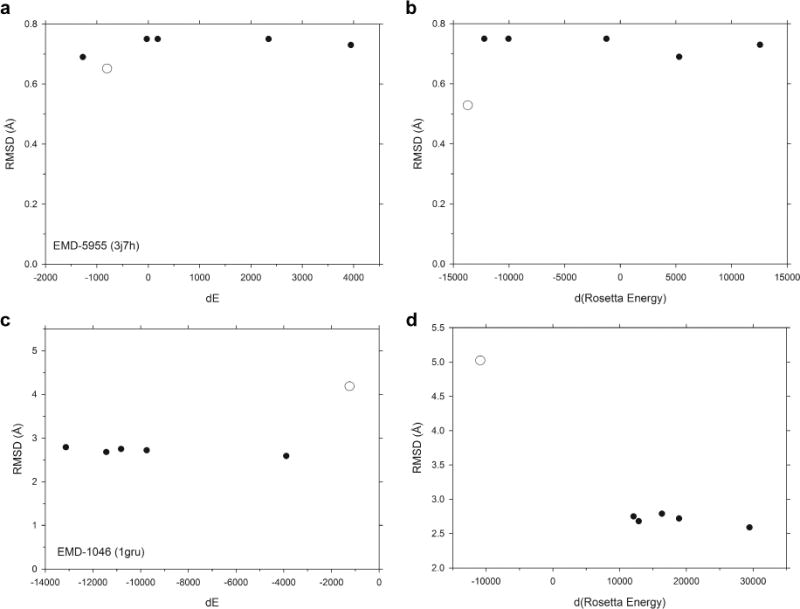
Comparison with other crystal structures. For two examples of EM maps with associated PDB entry, RMSD and the energy difference with other crystal structures were computed. (a), (b), beta-galactosidase, EMD-5955 (PDB ID: 3j7h), solved at 3.2 Å. (a) shows the CHARMM energy difference; and (b) shows the difference in term of the Rosetta energy with RMSD between 3j7h and five other crystal structures of the same protein, 1f4h, 1hn1, 1jz2, 3iaq, and 3t2o (solid circles). The open circle is the refined structure by (a) MDFF (g-scale 0.5) and (b) Rosetta, compared with 3j7h. For the CHARMM energy, structures were evaluated at the start of the refinement, after the initial energy minimization was applied and the temperature is raised to 300K, in the same way as the earlier figures. (c), (d), GroEL, EMD-1046 (PDB ID: 1gru), solved at 23.5 Å. Crystal structures used were 1aon, 1pcq, 1pf9, 1svt, and 1sx4 (solid circles).
Residue displacement relative to local map resolution
We have also examined the extent of displacement of each residue by the refinement protocols relative to the local map resolution (Fig. 6). Local map resolution was computed using the Resmap program (Kucukelbir et al., 2014), which provides a local resolution to each grid point in a map. In this analysis, the Cα atom of each residue in the initial structure was assigned to the nearest grid point in the EM map, and the displacement of the Cα atom by the refinement protocols was recorded. Then, the displacements of Cα atoms for grid positions were averaged over all grid points with the same local resolution in the map. Data for a resolution was discarded if fewer than 10 Cα atoms belonged to the resolution in the map.
Figure 6.
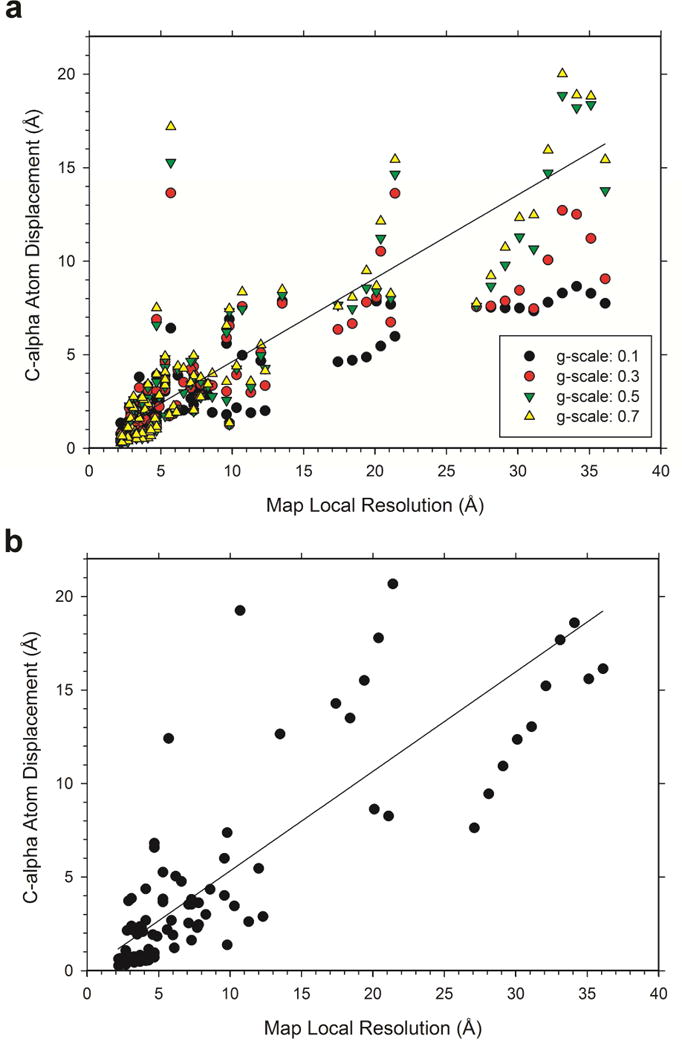
Distances of Cα atoms moved by the refinement relative to the local resolution maps. Local map resolution was computed with ResMap. For an EM map, the displacements of Cα atoms for grid positions with the same local resolution were averaged. Data for a resolution was discarded if less than 10 Cα atoms belonged to the resolution. (a), Results for MDFF with four different g-scale values, 0.1 (filled circles), 0.3 (red circles), 0.5 (green triangles), 0.7 (yellow triangles). The line shown is a weighted regression line for a g-scale of 0.5: Cα displacement = 0.124 + 0.446 *(local map resolution). The reciprocal predicted value was used for weights. r2 is 0.597. (b), results for Rosetta. A weighted regression line using the reciprocal predicted value is shown: RMSD = −0.03 + 0.533*(map resolution). r2 is 0.567.
Results in Figure 6 show a similar trend as we observed for the correlation between the global RMSD and the overall map resolution in Figure 3. Fig. 6a is for the MDFF protocol with the four g-scale values while the Rosetta results are shown in Fig. 6b. The extent of the residue displacements inversely correlated with the local map resolution (Fig. 6a and 6b) and a larger displacement was observed with a larger g-scale value for MDFF (Fig. 6a). The Cα displacement relative to the local map resolution fits to a weighted regression of 0.124 + 0.446 * (local map resolution) with r2 of 0.597 for MDFF with a g-scale of 0.5 (Fig. 6a) while the results for Rosetta fit to −0.03 + 0.533*(map resolution) with r2 of 0.567 (Fig. 6b). The slopes observed in the regression lines for the local resolution were larger than those for the global map resolution in Figure 3. Consistent with the global RMSD analysis in Figure 3, Rosetta moved residues in models more than MDFF. Following the regression lines, the estimated deviation of a residue in a model is roughly 46% and 53% of the map’s local resolution for MDFF with a g-scale of 0.4 and Rosetta, respectively.
Examples of refined models
We discuss examples of refined structures by MDFF and Rosetta for models constructed for maps of four different resolutions. The first example (Fig. 7a) is L-protein of vesicular stomatitis virus determined from an EM map of 3.8 Å (EMDB ID: 6337, PDB ID: 5a22) (Liang et al., 2015). This model was manually constructed using programs O (Jones et al., 1991) and Coot (Emsley et al., 2010) by tracing the main-chain and placing helix segments guided by known homologous structures and secondary structure prediction, which is finally followed by loop and side-chain refinement. For this model, MDFF with g-scale 0.5 and Rosetta modified the structure to the extent of 0.944 Å and 0.762 Å RMSD from the deposited model, respectively. Slight deviation at loop regions was observed but no substantial structural changes occurred by the refinement.
Figure 7.
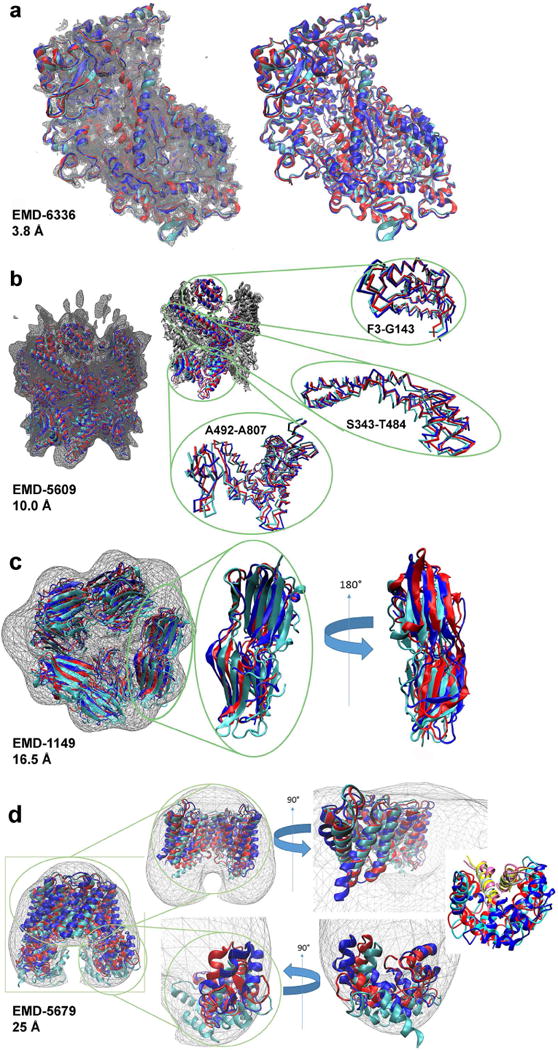
Example of structure refinements. The overlay of selected initial and refined structures produced by MDFF (using a g-scale of 0.5) and Rosetta are colored cyan, blue, and red respectively. Density maps for these structures are shown as gray wire frames. (a), The 3.8 Å resolution map of L-protein of vesicular stomatitis virus (EMDB ID: 6337) and its atomic model (PDB ID: 5a22) (left), as well as the atomic model shown without the wire frame map for visual clarity (right). (b), The 10.0 Å resolution map, EMD-5609, and its structure model (PDB ID: 3j3u) of MecA-ClpC complex (left). The structures with the A chain shown in color, while the rest of the complex is shown in white (center). Selected domains are isolated and magnified for visual clarity (right). The residue range of these domains are included as insets near each image. (c), The 16.5 Å resolution map (EMDB: 1149) and its structure model (PDB ID: 2byu) of small heat shock protein Arc 1 (left). An isolated subunit of the structure magnified for visual clarity (center). A 180-degree rotated view of the isolated subunit (right). (d), A 25 Å resolution map (EMDB: 5649) and its structure model (PDB ID: 3j41) of aquaporin-O/calmodulin complex (left). Map and structure of the core region of the complex with lobe domains and front half of core removed for ease of viewing (top center). A rotated view of the core domain (top right). Magnification of a single lobe calmodulin domain with core domain removed (bottom center) and a rotated view of the calmodulin domain (bottom right). Interaction with the calmodulin domain with two helices (chain C, D: 225–241) (shown in yellow, light blue, and pink for the original structure model, the model from MDFF, and the Rosetta model, respectively) are highlighted in far right.
In the next example, a structure model of MecA-ClpC complex solved from an EM map of 10.0 Å resolution is shown (EMDB ID: 5609; PDB ID: 3j3u) (Liu et al., 2013). The model is based on a crystal structure of this complex, where some loops were built using Modeller (Sali and Blundell, 1993). The model was subsequently fit to the map with MDFF. By our refinement, MDFF with g-scale 0.5 produced a refined model of an RMSD of 2.484 Å from the initial structure, similarly Rosetta produced the model that deviated by 2.196 Å RMSD. As shown in Figure 7b, in addition to larger deviation of loop regions, modification of helical (e.g. residue 343 to 484) and β-sheet regions (e.g. residue 738 to 807) are clearly observed.
In the third example, a model of a dodecameric structure of the small heat shock protein Arc 1 determined with an EM map of a 16.5 Å resolution is shown (EMDB ID: 1149; PDB ID: 2byu) (Kennaway et al., 2005). The map was solved by negative staining. This model was built by rigid body fitting taking symmetry into account. MDFF with g-scale 0.5 and Rosetta moved the overall structure by 5.835 Å and 4.349 Å, respectively. As evident from the figure (Fig. 7c), the whole subunits shifted relative to the map, indicating that the initial model only contain approximate subunit arrangement information of the complex.
When the map resolution is even lower, as illustrated in the final example, a model for aquaporin-O/calmodulin complex (EMDB ID: 5679; PDB ID: 3j41) solved from a 25 Å negative stain EM map (Reichow et al., 2013), the refinement caused large domain modification. The deposited model was constructed using a crystal structure of the transmembrane domain as a base, on which the rest of the structure was added through several steps of manual building of helices and loops. The lobe calmodulin domain saw compression of secondary structure elements into the density map and the transmembrane domain showed substantial rearrangement of orientation of helices even at the core of the complex. In both MDFF and Rosetta refined models, the calmodulin domains maintained its interaction with two helices from aquaporin-O as shown in the far right panel in Fig. 7d. The RMSD between the refined model and the initial model was 7.197 Å and 7.625 Å by MDFF and Rosetta, respectively.
Discussion
Here we used two popular EM structure fitting methods, MDFF and Rosetta, to investigate how well structure models derived from EM maps are supported by those maps. We refined structure models deposited in EMDB further using the two methods independently, and RMSD between structures before and after the refinement as well as discrepancy between resulting structures by the two methods were examined. It turned out that for both methods more than 60% of the cases structures can be refined to have a higher cross-correlation to associated EM maps, almost all of which were with a decrease of the energy of the structures. The extent of the observed structural change by the structural refinement increased as map resolution declines, indeed it scaled inversely to map resolutions. According to the weighted regression lines that correlate structural change (RMSD) and map resolutions, model structures changed up to an RMSD of roughly 30% of the map resolution. A similar trend of structural change was observed relative to local map resolution, too. As the discrepancy of refined models by MDFF and Rosetta also scaled inversely to map resolution, it is suggested that the observed structural change by the refinement methods is due to the lack of structural information in EM maps but not because the deposited structures missed the optimal solution.
Recently, the Schulten group has proposed two structure modeling protocols for a high resolution EM map using MDFF (Singharoy et al., 2016). The main idea behind the protocols is to start running MDFF with a blurred EM map so that the structure can explore a large conformation space avoiding local energy minima and then to gradually change the resolution of the map higher back to its original (high) resolution. The new procedures were tested on two actual high-resolution EM maps determined at 3.2 Å and 3.4 Å, one for beta galactosidase and another one for TRPV1 respectively. The new protocols would change the results for high resolution maps slightly if used in this study, but the overall trend would not change because the new protocols are designed for high resolution maps of higher than 4–5 Å and our dataset contains maps determined at wide range of resolutions. Actually, our results using the standard MDFF and Rosetta on the 3.2 Å map of beta galactosidase (EMD-5955) are consistent with their results. RMSD values of our results were 0.65 Å and 0.53 Å with the standard MDFF and Rosetta, respectively, while the two new protocols obtained 0.7 Å and 0.9 Å (Table 1 in their paper). It is also interesting that their analysis on the root mean square fluctuation of MDFF-refined models relative to the local resolution of a map (Figure 4 in their paper) shows a similar trend to the residue displacement relative to the local map resolution, which we showed in Figure 6.
A structure model is built for an EM map not only from the electron density information in the map but also in consideration of other biological information of the proteins, such as known structures of homologous proteins and results of biochemical assays. Thus, a deposited structure models for an EM map would be the result of best effort in considering various sources of information of the protein with the EM maps as a piece of information. Nevertheless, it is advised that map resolution be critically considered when one uses EM-derived structures for further analysis; be that validation of a structure prediction or refinement methodology, the structure based design of a drug-like molecule, or the analysis of the biochemical or energetic character of these structures. Considering that an increasing number of structures are solved by EM and that EMDB is becoming a valuable source of biomolecular structural analysis, it is important that users of structures determined by EM are made well aware of the limitations of structure models. One possible solution would be for the EMDB to include the local resolution information of the map in the structure analysis report called Visual Analysis, which is associated with each EM map entry in EMDB. It is also important that the local resolution information is linked to the associated PDB entry of the map, either in the wwPDB EM Map/Model Validation Report, which is provided for each entry in PDB, or even in the PDB file itself in an explicit way, for example, by providing resolution information for each atom in a structure model analogous to the B-factor of X-ray crystallography.
STAR METHODS
CONTACT FOR REAGENT AND RESOURCE SHARING
Further information and requests for reagents can be directed to the leading author
Daisuke Kihara, dkihara@purdue.edu
MEHOD DETAILS
Selection of the EM map dataset
First, 688 EM maps were selected from the EMDB of October 2015 that are associated with fitted structures in PDB. A biological assembly was reconstructed for a PDB entry if it only contained subunits that are a part of the assembly. Subsequently, maps were further removed if the fitted structure only overlaps with a small portion of the maps, because the structure refinement programs will drag the structure into an empty region of the map in such cases. Two criteria were used to ensure the sufficient structure-to-map overlap, the cross correlation and the map overlap. The map overlap was defined as the ratio of the volume of the map that overlaps with the structure model relative to the union of the map and model volumes, i.e. volume(map ∩ model)/volume(map U model). The volume of a map was defined by applying the recommended contour level for the map provided by EMDB. The volume a structure model was calculated by pdb2vol (Wriggers and He, 2015). Two different Cross correlation and map overlap cutoff values were used depending on the resolution of the EM map. For resolutions worse than 4.0 Å, map-model pairs with a cross correlation less than 0.7 and a map overlap of less than 60% were discarded, while for resolutions 4.0 Å or better, map-model pairs with a cross correlation less than 0.6 and a map overlap of less than 50% were discarded. The more permissive cutoff values were used for higher resolution maps because cross correlation values are sensitive and can show lower value when resolution is high. After cross correlation and map overlap filtering, the number of map-PDB pairs reduced 96 entries. Of these 96 entries, fitted structures containing nucleic acids, filament structures, which elongate beyond the map boundary, or backbone-only structures were removed, because the standard refinement protocols could not be applied. EMD-3096 was also removed from the dataset because the deposited structure in its associated PDB entry has entanglement between chains. This procedure finally resulted in the data set to 49 entries.
Using Molecular Dynamics Flexible Fitting
Two computational methods were used to investigate modifications of model protein structures fitted to EM maps, Molecular Dynamics Flexible Fitting (MDFF) (McGreevy et al., 2014; McGreevy et al., 2016) and Rosetta (Wang et al., 2015). MDFF runs a molecular dynamics simulation with a modified potential that considers fit of the structure to the target EM map. This is done by calculating a potential UEM from the map, which is used as an additional energetic term to a regular molecular mechanics force field (CHARMM).
| (Eq. 1) |
| (Eq. 2) |
Where UEM is the potential calculated from the EM map, wj is a scale factor which is set to the atomic mass of the j-th atom. ξ is called the g-scale, which is a scale factor for the map derived potential. The g-scale plays a key role in how strongly a protein model will be fitted to a map. ϕ(r) represents the density value of the map at the point r. ϕthr is a threshold value used to reduce the signal from solvent, which is set to 0 as per the default. ϕmax is the largest value in the map data. UEM guides a structure to fit into the EM map, and the g-scale controls the contribution of UEM to the overall molecular mechanics force field. If the g-scale is set to a small value, dynamics of the molecule will be dominated by the regular molecular mechanics force field. On the other hand, with a larger g-scale value, the structure will be more biased to fit more to the density map. We used four g-scale values, 0.1, 0.3, 0.5, and 0.7, and compared the results. To start the simulation, a structure is first minimized by Langevin dynamics with the CHARMM force fields (without the UEM term). The simulation was considered to be converged if the structure did not vary more than 0.5 Å over a 100 picoseconds. All the cases, simulations are converged within 1 nano seconds.
Using Rosetta
Rosetta is a molecular modeling software package, which includes a density guided all-atom energy optimization protocol. The conformation sampling and energy evaluation are carried out at two levels, a low-resolution level and a high-resolution, all-atom level using Monte Carlo sampling (DiMaio et al., 2009). In the low-resolution level, a protein structure is represented by backbone heavy atoms and a single centroid at each side-chain position. The energy of a protein conformation in the low-resolution level is a linear combination of terms including residue-residue interactions, secondary structure packing, chain density, and excluded volume. The all-atom energy used in the high-resolution level refinement includes terms for a Lennard-Jones van der Waals potential, an implicit solvent term, an orientation-dependent hydrogen bonding term, pair atom interaction terms, and side-chain torsional potential, and a backbone torsional potential (Bradley et al., 2005). For structure modeling with an EM map, Rosetta assesses the agreement of a model structure to density in the following equation for computing cross correlation (CC) and combines it with the Rosetta’s energy terms (DiMaio et al., 2009):
| (Eq. 3) |
where ρo(y) and ρc(y) are the observed density and the computed density from the structure model at position y in the map, so and sc are the standard deviations, and are the average, of the observed and computed densities, respectively. ε(y) is a mask function that limit the computation to points that are close to the protein model. This cross correlation is converted to a scoring function that computes the probability that a correlation value is generated by random chance, which is added as an additional term to the Rosetta energy. The contribution of the CC term to the total energy for a residue would be roughly around 25%. In the low-resolution modeling stage, conformations of regions in a model that have poor agreement to the map are resampled by switching fragment conformations that are taken from known structures of the similar sequence and by loop modeling. Subsequently, the structure is refined by side-chain optimization and atomic-detailed refinement. We employed the all atom energy optimization of Rosetta v3.5 (2015.19 revision 57819), called fast-relax protocol, with the density scoring term “elect_dens_fast”. The weight of the density scoring term was set to 20.0 (the default setting). The maximum cycle (default_max_cycles) was set to 20000000.
MolProbity Score
MolProbity is a structure validation tool used to evaluate the quality of a protein structure solved by experiments, mainly X-ray crystallography (Kucukelbir et al., 2014). Recently it is also used for validating computationally modelled protein structures (Modi and Dunbrack, 2016). MolProbity evaluates stereochemical properties of a structure model, including atom clashes, bond angles, outliers of dihedral angles of the main-chain, and outliers of rotamers of side-chains by comparing with statistics taken from high-resolution protein structures. The MolProbility Score (MPScore) summarizes the evaluation of each category. A lower MPScore indicates that the model has better agreement of the stereochemistry to the statistics than models with higher scores.
Cross correlation
Cross correlation is an indicator of how well two electron density distributions match one another. It is given by
| (Eq. 4) |
where F(r1) is the value of the electron density distribution F of an EM map at the position r1, <F> is the average value of the function F. Similarly, G(r1) is the value of the simulated electron density distribution G of a protein structure model at the position r1 and <G> is the average value of the function G. Cross correlation was computed using VMD (Humphrey et al., 1996). The values σF and σG are the standard deviations of the functions F and G, respectively. The higher the CC, the better the quality of the fit.
Supplementary Material
Highlights.
Protein structures solved by EM were further refined.
The extent of the refinement inversely correlates to the map resolution.
RMSD of modification to a structure is roughly 1/3 of its map resolution.
Disagreement of refinement by different methods also shows the inverse correlation.
Acknowledgments
The authors are grateful to Adhi Singaroy for his assistance with MDFF and Thomas Klose for his help in finding literature relevant to this study. Lenna X. Peterson is acknowledged for proofreading the manuscript. This work was partly supported by the National Institute of General Medical Sciences of the National Institutes of Health (R01GM097528) and the National Science Foundation (IIS1319551, DBI1262189, IOS1127027, DMS1614777).
Footnotes
Publisher's Disclaimer: This is a PDF file of an unedited manuscript that has been accepted for publication. As a service to our customers we are providing this early version of the manuscript. The manuscript will undergo copyediting, typesetting, and review of the resulting proof before it is published in its final citable form. Please note that during the production process errors may be discovered which could affect the content, and all legal disclaimers that apply to the journal pertain.
Supplemental Information
Supplemental information includes one figure and four tables and can be found with this article online at http://dx.doi/org/XXXXXXXXXXXXXXX.
Authors’ contributions
L.M. participated in designing the research, conducted the experiments of structure refinement using MDFF, and wrote the paper. G.K. conducted the experiments of structure refinement using Rosetta and performed the analysis with local map resolution. D.K. conceived the study, participated in its design and coordination, analyzed data, and wrote the paper. All authors read and approved the manuscript.
References
- Bradley P, Misura KM, Baker D. Toward high-resolution de novo structure prediction for small proteins. Science. 2005;309:1868. doi: 10.1126/science.1113801. [DOI] [PubMed] [Google Scholar]
- Ceulemans H, Russell RB. Fast fitting of atomic structures to low-resolution electron density maps by surface overlap maximization. Journal of molecular biology. 2004;338:783–793. doi: 10.1016/j.jmb.2004.02.066. [DOI] [PubMed] [Google Scholar]
- Chen VB, Arendall WB, 3rd, Headd JJ, Keedy DA, Immormino RM, Kapral GJ, Murray LW, Richardson JS, Richardson DC. MolProbity: all-atom structure validation for macromolecular crystallography. Acta crystallographica Section D, Biological crystallography. 2010;66:12–21. doi: 10.1107/S0907444909042073. [DOI] [PMC free article] [PubMed] [Google Scholar]
- DiMaio F, Tyka MD, Baker ML, Chiu W, Baker D. Refinement of protein structures into low-resolution density maps using rosetta. Journal of molecular biology. 2009;392:181–190. doi: 10.1016/j.jmb.2009.07.008. [DOI] [PMC free article] [PubMed] [Google Scholar]
- Dror O, Lasker K, Nussinov R, Wolfson H. EMatch: an efficient method for aligning atomic resolution subunits into intermediate-resolution cryo-EM maps of large macromolecular assemblies. Acta crystallographica Section D, Biological crystallography. 2007;63:42–49. doi: 10.1107/S0907444906041059. [DOI] [PMC free article] [PubMed] [Google Scholar]
- Egelman EH. Problems in fitting high resolution structures into electron microscopic reconstructions. HFSP journal. 2008;2:324–331. doi: 10.2976/1.2992221. [DOI] [PMC free article] [PubMed] [Google Scholar]
- Emsley P, Lohkamp B, Scott WG, Cowtan K. Features and development of Coot. Acta crystallographica Section D, Biological crystallography. 2010;66:486–501. doi: 10.1107/S0907444910007493. [DOI] [PMC free article] [PubMed] [Google Scholar]
- Esquivel-Rodriguez J, Kihara D. Fitting Multimeric Protein Complexes into Electron Microscopy Maps Using 3D Zernike Descriptors. The journal of physical chemistry B. 2012;116:6854–6861. doi: 10.1021/jp212612t. [DOI] [PMC free article] [PubMed] [Google Scholar]
- Esquivel-Rodriguez J, Kihara D. Computational methods for constructing protein structure models from 3D electron microscopy maps. Journal of structural biology. 2013;184:93–102. doi: 10.1016/j.jsb.2013.06.008. [DOI] [PMC free article] [PubMed] [Google Scholar]
- Falkner B, Schroder GF. Cross-validation in cryo-EM-based structural modeling. Proceedings of the National Academy of Sciences of the United States of America. 2013;110:8930–8935. doi: 10.1073/pnas.1119041110. [DOI] [PMC free article] [PubMed] [Google Scholar]
- Faruqi AR, Henderson R. Electronic detectors for electron microscopy. Current opinion in structural biology. 2007;17:549–555. doi: 10.1016/j.sbi.2007.08.014. [DOI] [PubMed] [Google Scholar]
- Henderson R, Sali A, Baker ML, Carragher B, Devkota B, Downing KH, Egelman EH, Feng Z, Frank J, Grigorieff N, et al. Outcome of the first electron microscopy validation task force meeting. Structure. 2012;20:205–214. doi: 10.1016/j.str.2011.12.014. [DOI] [PMC free article] [PubMed] [Google Scholar]
- Humphrey W, Dalke A, Schulten K. VMD: visual molecular dynamics. JMolGraph. 1996;14:33. doi: 10.1016/0263-7855(96)00018-5. [DOI] [PubMed] [Google Scholar]
- Jiang W, Baker ML, Ludtke SJ, Chiu W. Bridging the information gap: computational tools for intermediate resolution structure interpretation. Journal of molecular biology. 2001;308:1033–1044. doi: 10.1006/jmbi.2001.4633. [DOI] [PubMed] [Google Scholar]
- Jolley CC, Wells SA, Fromme P, Thorpe MF. Fitting low-resolution cryo-EM maps of proteins using constrained geometric simulations. Biophysical journal. 2008;94:1613–1621. doi: 10.1529/biophysj.107.115949. [DOI] [PMC free article] [PubMed] [Google Scholar]
- Jones TA, Zou JY, Cowan SW, Kjeldgaard M. Improved methods for building protein models in electron density maps and the location of errors in these models. Acta crystallographica Section A, Foundations of crystallography. 1991;47(Pt 2):110–119. doi: 10.1107/s0108767390010224. [DOI] [PubMed] [Google Scholar]
- Kennaway CK, Benesch JL, Gohlke U, Wang L, Robinson CV, Orlova EV, Saibil HR, Keep NH. Dodecameric structure of the small heat shock protein Acr1 from Mycobacterium tuberculosis. The Journal of biological chemistry. 2005;280:33419–33425. doi: 10.1074/jbc.M504263200. [DOI] [PubMed] [Google Scholar]
- Kucukelbir A, Sigworth FJ, Tagare HD. Quantifying the local resolution of cryo-EM density maps. Nature methods. 2014;11:63–65. doi: 10.1038/nmeth.2727. [DOI] [PMC free article] [PubMed] [Google Scholar]
- Kuhlbrandt W. Biochemistry. The resolution revolution. Science. 2014a;343:1443–1444. doi: 10.1126/science.1251652. [DOI] [PubMed] [Google Scholar]
- Kuhlbrandt W. Cryo-EM enters a new era. eLife. 2014b;3:e03678. doi: 10.7554/eLife.03678. [DOI] [PMC free article] [PubMed] [Google Scholar]
- Lawson CL, Baker ML, Best C, Bi C, Dougherty M, Feng P, van Ginkel G, Devkota B, Lagerstedt I, Ludtke SJ, et al. EMDataBank.org: unified data resource for CryoEM. Nucleic acids research. 2011;39:D456–464. doi: 10.1093/nar/gkq880. [DOI] [PMC free article] [PubMed] [Google Scholar]
- Liang B, Li Z, Jenni S, Rahmeh AA, Morin BM, Grant T, Grigorieff N, Harrison SC, Whelan SP. Structure of the L Protein of Vesicular Stomatitis Virus from Electron Cryomicroscopy. Cell. 2015;162:314–327. doi: 10.1016/j.cell.2015.06.018. [DOI] [PMC free article] [PubMed] [Google Scholar]
- Liu J, Mei Z, Li N, Qi Y, Xu Y, Shi Y, Wang F, Lei J, Gao N. Structural dynamics of the MecA-ClpC complex: a type II AAA+ protein unfolding machine. The Journal of biological chemistry. 2013;288:17597–17608. doi: 10.1074/jbc.M113.458752. [DOI] [PMC free article] [PubMed] [Google Scholar]
- McGreevy R, Singharoy A, Li Q, Zhang J, Xu D, Perozo E, Schulten K. xMDFF: molecular dynamics flexible fitting of low-resolution X-ray structures. Acta crystallographica Section D, Biological crystallography. 2014;70:2344–2355. doi: 10.1107/S1399004714013856. [DOI] [PMC free article] [PubMed] [Google Scholar]
- McGreevy R, Teo I, Singharoy A, Schulten K. Advances in the molecular dynamics flexible fitting method for cryo-EM modeling. Methods. 2016;100:50–60. doi: 10.1016/j.ymeth.2016.01.009. [DOI] [PMC free article] [PubMed] [Google Scholar]
- Modi V, Dunbrack RL., Jr Assessment of refinement of template-based models in CASP11. Proteins. 2016;84(Suppl 1):260–281. doi: 10.1002/prot.25048. [DOI] [PMC free article] [PubMed] [Google Scholar]
- Pettersen EF, Goddard TD, Huang CC, Couch GS, Greenblatt DM, Meng EC, Ferrin TE. UCSF Chimera–a visualization system for exploratory research and analysis. J Comput Chem. 2004;25:1605–1612. doi: 10.1002/jcc.20084. [DOI] [PubMed] [Google Scholar]
- Reichow SL, Clemens DM, Freites JA, Nemeth-Cahalan KL, Heyden M, Tobias DJ, Hall JE, Gonen T. Allosteric mechanism of water-channel gating by Ca2+-calmodulin. Nature structural & molecular biology. 2013;20:1085–1092. doi: 10.1038/nsmb.2630. [DOI] [PMC free article] [PubMed] [Google Scholar]
- Rosenthal PB, Rubinstein JL. Validating maps from single particle electron cryomicroscopy. Current opinion in structural biology. 2015;34:135–144. doi: 10.1016/j.sbi.2015.07.002. [DOI] [PubMed] [Google Scholar]
- Rossmann MG. Fitting atomic models into electron-microscopy maps. Acta crystallographica Section D, Biological crystallography. 2000;56:1341–1349. doi: 10.1107/s0907444900009562. [DOI] [PubMed] [Google Scholar]
- Sali A, Blundell TL. Comparative protein modelling by satisfaction of spatial restraints. Journal of molecular biology. 1993;234:779. doi: 10.1006/jmbi.1993.1626. [DOI] [PubMed] [Google Scholar]
- Scheres SH. RELION: implementation of a Bayesian approach to cryo-EM structure determination. Journal of structural biology. 2012;180:519–530. doi: 10.1016/j.jsb.2012.09.006. [DOI] [PMC free article] [PubMed] [Google Scholar]
- Singharoy A, Teo I, McGreevy R, Stone JE, Zhao J, Schulten K. Molecular dynamics-based refinement and validation for sub-5 A cryo-electron microscopy maps. eLife. 2016;5 doi: 10.7554/eLife.16105. [DOI] [PMC free article] [PubMed] [Google Scholar]
- Velankar S, van Ginkel G, Alhroub Y, Battle GM, Berrisford JM, Conroy MJ, Dana JM, Gore SP, Gutmanas A, Haslam P, et al. PDBe: improved accessibility of macromolecular structure data from PDB and EMDB. Nucleic acids research. 2016;44:D385–395. doi: 10.1093/nar/gkv1047. [DOI] [PMC free article] [PubMed] [Google Scholar]
- Villa E, Lasker K. Finding the right fit: chiseling structures out of cryo-electron microscopy maps. Current opinion in structural biology. 2014;25:118–125. doi: 10.1016/j.sbi.2014.04.001. [DOI] [PubMed] [Google Scholar]
- Wang RY, Kudryashev M, Li X, Egelman EH, Basler M, Cheng Y, Baker D, DiMaio F. De novo protein structure determination from near-atomic-resolution cryo-EM maps. Nature methods. 2015;12:335–338. doi: 10.1038/nmeth.3287. [DOI] [PMC free article] [PubMed] [Google Scholar]
- Woetzel N, Karakas M, Staritzbichler R, Muller R, Weiner BE, Meiler J. BCL::Score–knowledge based energy potentials for ranking protein models represented by idealized secondary structure elements. PloS one. 2012;7:e49242. doi: 10.1371/journal.pone.0049242. [DOI] [PMC free article] [PubMed] [Google Scholar]
- Wriggers W, Chacon P. Modeling tricks and fitting techniques for multiresolution structures. Structure. 2001;9:779–788. doi: 10.1016/s0969-2126(01)00648-7. [DOI] [PubMed] [Google Scholar]
- Wriggers W, He J. Numerical geometry of map and model assessment. Journal of structural biology. 2015;192:255–261. doi: 10.1016/j.jsb.2015.09.011. [DOI] [PMC free article] [PubMed] [Google Scholar]
- Yang Z, Lasker K, Schneidman-Duhovny D, Webb B, Huang CC, Pettersen EF, Goddard TD, Meng EC, Sali A, Ferrin TE. UCSF Chimera, MODELLER, and IMP: an integrated modeling system. Journal of structural biology. 2012;179:269–278. doi: 10.1016/j.jsb.2011.09.006. [DOI] [PMC free article] [PubMed] [Google Scholar]
- Zhu J, Cheng L, Fang Q, Zhou ZH, Honig B. Building and refining protein models within cryo-electron microscopy density maps based on homology modeling and multiscale structure refinement. Journal of molecular biology. 2010;397:835–851. doi: 10.1016/j.jmb.2010.01.041. [DOI] [PMC free article] [PubMed] [Google Scholar]
Associated Data
This section collects any data citations, data availability statements, or supplementary materials included in this article.