

Abstract
Objectives
Neuroticism is a common yet understudied condition in older adults. We hypothesized that presence of high Negativity Affectivity (NA), a key feature of neuroticism, would be associated with different prefrontal cortex (PFC) activity and connectivity patterns in depressed and never-depressed older adults.
Design
Baseline cross-sectional analysis of a cohort study.
Participants
Fifty-two depressed and 36 never-depressed older adults.
Measurements
Assessments included Negative Affectivity scores from the Type D Scale-14 (DS-14) and Montgomery-Ǻsberg Depression Rating Scale scores. All subjects had a 3T brain functional magnetic resonance imaging resting scan, neuronal activity was determined by Amplitude of Low-Frequency Fluctuations (ALFF) were obtained, and resting state functional connectivity (FC) analyses were performed. ANCOVA analyses were conducted on ALFF and FC to examine significant differences between groups.
Results
In the analyses on ALFF, there were clearly different patterns between depressed and comparison groups in the correlation of ALFF and NA. The correlation differences between the two groups were significant in the dorsomedial PFC, insula, amygdala and posterior cingulate cortex (PCC). FC analyses revealed different between-group connectivity patterns. Significantly higher ventromedial PFC-amygdala FC with NA correlation was found in the depressed group than that in the never-depressed group.
Conclusion
This study confirms differential activity of the dorsal and ventral regions of the medial prefrontal cortex in individuals with high neuroticism. Our findings suggest increased rostral medial PFC activity may be a marker of resilience to depression in the elderly and decreased anterior ventromedial PFC/PCC/amygdala activity may be a result of successful emotion regulation in never-depressed higher NA individuals.
Keywords: Depression, Neuroticism, Elderly, Neuroimaging
Objective
Neuroticism, characterized by high levels of negative affect in response to minor stressors, is a complex, clinically significant construct, and its study may benefit from a neuroscience approach. While the term “neurotic” is used loosely by clinicians and the lay public, personality theorists define neuroticism as the absence of emotional stability [1, 2]. Individuals high in neuroticism are predisposed to experience psychological distress and negative mood states and are generally described as anxious, apprehensive, and prone to experience worry, sadness, loneliness, and dejection [2]. Neuroticism thus increases the vulnerability to develop clinical anxiety and major depressive disorders [3, 4], and the presence of neuroticism perpetuates major depression in older adults and is detrimental to the cognitive functioning of this cohort [5, 6]. Neuroticism is also associated with both an increased risk of cognitive decline in both depressed and non-depressed older adults and an increased likelihood of Alzheimer’s disease [7, 8]. This body of evidence is especially concerning, as neuroticism may increase in the oldest old [9]. Therefore, studying neuroticism in older adults clearly has public health importance, although there has been scant neuroimaging research examining neuroticism in the elderly.
Not all people with neuroticism will develop depression or anxiety. Never-depressed individuals with high neuroticism might have developed some protective strategies and neural activities/pathways that are different from those who had depression [10]. When viewing emotional stimuli, young adults at risk for depression who remain depression free two years later show decreased activation in the thalamus, insula, and anterior cingulate when contrasted with young adults who develop major depression after two years despite equivalent levels of neuroticism [11]. This finding in younger subjects may also apply to older adults. Therefore, it is essential to examine the common and distinct intrinsic neural activity/connectivity between older individuals with and without depression in order to better understand the underlying neural mechanisms related to neuroticism that contribute to depression vulnerability and resilience.
Neuroticism is associated with structural and functional abnormalities in brain regions related to emotional processing and emotional regulation in younger and middle aged adults. Higher neuroticism scores correlate with lower structural volume in the amygdala and medial prefrontal cortex (mPFC) [12–14] and with hyperactivation among the amygdala-mPFC and other limbic regions [15, 16]. The mPFC, including the ventromedial and dorsomedial aspects (vmPFC and dmPFC, respectively) is a brain region critical to social cognition, self-reference, emotional decision making, and emotion regulation, and has been implicated in development of anxiety and depression [17–19]. The functions of mPFC are tied to its structural and/or functional connections to numerous key areas such as the posterior cingulate cortex (PCC), precuneus and hippocampus (key nodes of default-mode network and memory retrieval), as well as the amygdala, insula (salience network), caudate and putamen (reward system), superior temporal sulcus (STS) and middle temporal cortex (key nodes of theory of mind), and the dorsal anterior cingulate cortex (dACC) and ventrolateral prefrontal cortex (vlPFC) involved with attention and inhibition. Although there are many studies that focus on confirming the role of dmPFC and vmPFC in emotion regulation, there is a dearth of evidence of whether neuroticism might relate differently to emotional regulation processing in these areas. Controversy remains as to whether the dmPFC is an “affective” region and the vmPFC is an “emotion regulation region” or vice versa. Aghajani et al. considered the vmPFC as an emotional assessment/processing region and dmPFC as an emotion regulation region and hypothesized that elevated neuroticism would result in higher resting state functional connectivity (rsFC) between the amygdala and vmPFC regions (reflecting higher sensitivity to emotional stimuli) and lower connectivity between the amygdala and dmPFC regions (reflecting lower emotional regulation) [20]. Unexpectedly, there was a positive correlation between neuroticism and rsFC of the amygdala-precuneus, but no other associations between neuroticism, the amygdala, and prominent regions of the vmPFC and dmPFC. The authors acknowledged a significant limitation may have influenced their findings, namely that all participants were without psychopathology and neuroticism scores were in the normal range and not clinically significant. Neuroimaging studies of neuroticism in major depression are limited to volumetric analyses, in which high neuroticism is correlated with lower amygdala volume [21] and lower white matter integrity of the uncinate fasciculus [22]. To our knowledge, there has been no functional neuroimaging study of neuroticism in older adults with major depression.
We posit that neuroticism as a personality trait would modulate intrinsic neural network and neural autonomic oscillations during resting state. There are only a few studies that have examined the impact of neuroticism trait on neural autonomic oscillations during resting state. Therefore, we sought to examine relationships between neuroticism and resting state functional activity and connectivity (rsFC) among older adults with and without major depression who were enrolled in the Neurobiology of Late-life Depression study (NBOLD). Based on our preliminary studies, we hypothesized that higher NA in never-depressed older adults would show different dmPFC and vmPFC activity and connectivity patterns from depressed adults.
Methods
Subjects
All subjects were enrolled in NBOLD, an NIMH funded R01 grant entitled “Neurobiology and Adverse Outcomes of Neuroticism in Late-life Depression” (MH096725) at the University of Connecticut Health Center (UCHC) and the Olin Neuropsychiatry Research Center at the Institute of Living of Hartford Hospital. The study was approved by the Institutional Review Boards of UCHC and Hartford Hospital. All subjects were provided information about the study, including a review of the consent form, and then provided written, informed consent to participate.
Depressed subjects were recruited from clinic referrals, newspaper advertisements and community presentations. Never-depressed comparison subjects were recruited from a volunteer registry list housed in the Center on Aging at UCHC as well as newspaper advertisements and community presentations. Our recruitment strategy included monitoring for sufficient numbers of depressed and never-depressed subjects likely to score high in neuroticism; details are provided below.
Inclusion criteria for all subjects were age 60 or above, ability to read and write English, Mini-Mental State Examination (MMSE, [23]) score 25 or greater. In addition, depressed subjects met criteria for major depression, single episode or recurrent.
Exclusion criteria for the study were: current or recent alcohol or drug dependence; conditions associated with MRI abnormalities such as hydrocephalus, brain tumors, epilepsy, Parkinson’s disease, Huntington’s chorea, dementia, and demyelinating diseases; endocrine disorder other than diabetes mellitus; any physical or intellectual disability that may affect completion of self-rating instruments; established clinical diagnosis of dementia; other DSM Axis 1 psychiatric disorders; and any metal or pacemaker in the body or claustrophobia that might preclude MRI. In addition, current treatment with fluoxetine was an exclusion for the depressed group given its long wash-out period.
All participants were screened for depression using the Center for Epidemiologic Studies-Depression (CES-D) scale, using a score of 16 or greater as a cut-off for depression [24]. To screen for neuroticism, we used the DS-14, a measure of tendency toward Negative Affectivity (NA, 7 items) and social inhibition (7 items) [25]. When compared with the NEO-PI, NA has been shown to correlate positively with neuroticism (r = 0.68), and has construct validity confirmed by scale-level factor analysis [25]. Based on our preliminary analyses, a cutoff of 10 or greater identified individuals high in NA. For the present study, we used the 7-item NA subscale of the DS-14 planning to oversample for those with the ≥10 cutoff among both depressed and never-depressed in order to ensure adequate numbers of individuals likely to score high in neuroticism. Oversampling has proven to be unnecessary among the depressed group, so we are currently only oversampling among the never-depressed group. Our preliminary data showed that we likely would need to screen 500 comparison group subjects in order to identify 25 never-depressed older individuals meeting our criterion for neuroticism.
Upon enrollment and completion of baseline assessments, each participant was paid $100 for their time completing the MRI, cognitive test battery and experimental computerized measures. The clinical assessment procedures have been reported previously [26], and are summarized below.
Baseline Assessments
Trained clinical research assistants administered the Duke Depression Evaluation Schedule (DDES, [27]) to each participant via computer-assisted data entry. The DDES contains items covering demographic data, life events, social support and coping, activities of daily living, self-rated depression severity, age of depression onset, and the Diagnostic Interview Schedule (DIS) sections for depression, mania, generalized anxiety disorder, somatization symptoms, and alcohol use [28]. A study psychiatrist then interviewed each subject to establish a clinical diagnosis of major depression (for depressed subjects) or rule out history of mental illness (for comparison subjects). During the visit, the following assessments are completed: Montgomery-Ǻsberg Depression Rating Scale (MADRS) [29], 17-item Hamilton Depression Rating Scale [30], the Clinical Global Impression severity scale, the Antidepressant Treatment History Form [31, 32], and the Cumulative Illness Rating Scale (CIRS) [33], as modified for geriatric patients [34]. Each subject completed several self-report measures, including the NEO-PI [35] as a measure of neuroticism. Finally, subjects were administered a standardized cognitive assessment that is comprised of the Consortium to Establish a Registry in Alzheimer’s Disease (CERAD) neuropsychological battery [36], a collection of neuropsychological measures with normative standards for the elderly and established utility in longitudinal studies of cognitive impairment [37]. We supplemented the CERAD battery with other common neuropsychological measures used in clinical practice for assessing immediate and delayed verbal memory, visual immediate memory, verbal initiation, lexical fluency, attentional and executive functions, and premorbid verbal ability.
Neuroimaging
Following baseline clinical assessment, subjects were transported to the Olin Neuropsychiatry Research Center (ONRC) at the Institute of Living at Hartford Hospital for a brain magnetic resonance imaging scan.
MRI data acquisition
Five minute, eyes-open resting state fMRI were acquired at the ONRC using a simultaneous multislice EPI sequence with factor of 8 from a Siemens Skyra 3T scanner with 32 surface coils. Both functional MRI and structural MRI were acquired axially paralleled with the AC-PC line with a whole-brain coverage. Functional MRI parameters were: FOV=240mm, flip angle = 60°; TR/TE = 475/30 ms; 49 slices; image matrix= 560× 560 × 49, voxel size = 3 × 3 ×3mm3. Twenty dummy volumes were discarded. Five MPRAGE images were also acquired axially paralleled with the AC-PC line with TE=2.88ms, flip angle = 13°, matrix size of 220 × 320 ×208, voxel size =0.8×0.8×0.8mm3. Subjects were asked to fixate on a cross sign in the center of the screen. They were instructed not to think of anything in particular and not to fall asleep.
MRI preprocessing
We conducted standard preprocessing procedures including realignment, co-registration, normalization, smoothness with a 6mm kernel, and bandpass filtering (0.01~0.1Hz) using DPABI V2.3 package DPASFA V4 (http://rfmri.org/dpabi)[38]. For realignment, the time series of images for each subject were realigned using a six-parameter (rigid body) linear transformation with a two-pass procedure (registered to the first image and then registered to the mean of the images after the first realignment). Individual structural images (T1-weighted MPRAGE) were co-registered to the mean functional image after realignment. The transformed structural images were then segmented into GM, WM and CSF. The DARTEL tool [39] was used to compute transformations from individual native space to MNI space. To remove the nuisance signals, the Friston 24-parameter model [40] was utilized to regress out 18 head motion effects from the realigned data. The signals from WM and CSF were regressed out to reduce respiratory and cardiac effects. In addition, linear and quadratic trends were also included as regressors since the BOLD signal exhibits low-frequency drifts. Temporal filtering (0.01 – 0.1 Hz) was then performed on the time series.
Amplitude of Low-Frequency Fluctuation (ALFF) and Functional Connectivity analysis. Amplitude of Low-Frequency Fluctuation (ALFF), a measure of brain activity, was computed for each subject using the DPABI V2.3 package (http://rfmri.org/dpabi) [38]. Slow fluctuations in activity are a basic feature of the resting brain, and for research purposes, their occurrence is key to defining resting state networks and determining correlated activity between brain regions. ALFF is a measure that quantifies the amplitude of these low frequency oscillations [41]. Differences in ALFF in key brain regions have been noted in a variety of neuropsychiatric disorders, including major depression [42], Attention Deficit Hyperactivity Disorder [41], mild cognitive impairment [43] and psychosis [44]. We conducted seed-to-voxel rsFC analyses using 116 regions of interests (ROIs) based on the Automated Anatomical Labeling (AAL) template as seeds. However, to reduce multiple comparisons, we focused a priori on the vmPFC and dmPFC. The vmPFC seed is from AAL region 26 and 28 (Frontal_Med_Orb_R, Rectus_R) and the dmPFC corresponding to AAL region 24 (Frontal_Sup_Medial_R). The decision to use these structures as vmPFC and dmPFC seeds was based on the significant voxels of vmPFC and dmPFC in the ANCOVA analysis described below fallen in these structures.
Statistical analyses
ANCOVA analyses were conducted on ALFF and FC using SPM8 to examine significant differences between patients and the comparison group as well as the interaction effect with neuroticism measured by negative affect (NA), with age and gender as covariates. We conducted a post-hoc test using pairwise two group t tests. Given there was a significant correlation between depression severity and NA, in order to investigate how NA contributed to depression vulnerability, we conducted a multiple regression analysis to investigate the association of ALFF with depression severity measured by MADRS, with age and gender as covariates. We set a significance level for all imaging analyses at p < 0.05 with a False Discovery Rate (FDR) cluster correction for multiple comparisons. Given that there were two seeds (vmPFC and dmPFC), we set the significance threshold for rsFC analyses at p < 0.025 with a FDR cluster correction in the final analyses.
Given the recent concerns regarding multiple comparison correction using cluster correction [45], we also conducted a more conservative “Permutation Analysis for the General Linear Model” test [46] using statistical non-parametric mapping (SnPM), with 5000 iterations. The significance level was set at p<0.05.
Results
Characteristics of the sample are shown in Table 1. The two groups were similar in age (mean age of never-depressed subjects =74.3 years versus 71.3 years in the depressed cohort), percent female (75% for the never-depressed versus 73% for the depressed group), and educational attainment (15.0 years among never-depressed subjects versus 16.1. years in the depressed group). As expected, MADRS and NA scores were higher in the depressed than the never-depressed group, although the range of NA scores was similar in the two groups, consistent with our sampling strategy (3–26 in the depressed group and 0–19 in the never-depressed group). MADRS score was significantly correlated with NA in the depressed group (rdf=51 = 0.40, p=0.0033) and in the non-depressed group (rdf=35 = 0.57, p=0.00028)
Table 1.
Demographic and Clinical Characteristics of the Sample
| Variable | Depression group (N=52) | Non-depressed comparison group (N=36) | Test statistic, degrees of freedom (df), and p value |
|---|---|---|---|
| Age, years, mean (SD), [range] | 71.35 (7.58), [60–89] | 74.33 (7.05) [62–86] | T = 1.66, df = 80, p =0.06 |
| Female Gender, N (%) | 38 (73.1%) | 27 (75.0%) | χ2 =0.041, df =1, p = 0.84 |
| Race, | |||
| White, N (%) | 48 (92.3%) | 33 (91.7%) | χ2 = 0.012, df = 1, |
| African-American, N (%) | 4 (7.7%) | 3 (8.3%) | p = 0.92 |
| Education, years, mean, SD, [range] | 16.06 (2.64) [11–20] | 14.97 (2.82) [11–20] | T = 1.54, df = 75, p = 0.06 |
| MADRS score, mean (SD), [range] | 18.28 (6.70) [3–30] | 1.14 (2.33) [0–11] | T = 13.48, df = 83, p < 0.00001 |
| Negative Affectivity score, mean (SD), [range] | 16.21 (6.12) [3–26] | 6.39 (5.01) [0–19] | T = 8.04, df = 81, p < 0.00001 |
MADRS = Montgomery-Ǻsberg Depression Rating Scale
Amplitude of Low-Frequency Fluctuation (ALFF) findings
Group Effect
Whole-brain ANCOVA analysis revealed a significant group effect in the middle temporal cortex (MTC), insula, fusiform gyrus, supplementary motor cortex, inferior parietal cortex, mid cingulate cortex (MCC), and posterior cingulate (PCC). We subsequently conducted post-hoc analysis using the Tukey-Kramer correction to compare ALFF in depressed and comparison groups. As shown in Figure 1 and Table 2, compared with never-depressed individuals, older depressed patients showed significantly increased ALFF in the middle temporal cortex (MTC), insula, fusiform gyrus, and cerebellum and significantly reduced ALFF in the supplementary motor cortex, inferior parietal cortex, mid cingulate and PCC/precuneus compared with the never-depressed group. These changes were independent of DS-14 Negative Affectivity (NA) and depression severity (measured by MADRS).
Figure 1.

Brain regions showing comparative Low-Frequency Fluctuation (ALFF) activity in depressed and never-depressed groups
Table 2.
Brain regions and coordinates of peak voxels in post-hoc tests of ANCOVA analysis that showed a significant difference in group effects and group-by-Negative Affect effects on ALFF, as well as regional with significant correlation between ALFF and MADRS (P< 0.05 with FDR cluster correction). Common regions found in both group and correlation analyses are marked in bold. Sub-clusters are marked in italics.
| Contrast | Brain Regions | Cluster Size | Peak Z Value | Peak voxel coordinates | ||
|---|---|---|---|---|---|---|
| Group Effect, df = [1,78] | X | Y | Z | |||
| Depressed < Comparison | R supplementary motor cortex | 1031 | 4.28 | 6 | −27 | 63 |
| R precuneus | 150 | 3.54 | 9 | −57 | 63 | |
| L inferior parietal cortex | 137 | 3.36 | −49 | −47 | 48 | |
| R mid cingulate | 51 | 2.16 | 4 | −18 | 42 | |
| Depressed > Comparison | R middle temporal cortex | 133 | 3.93 | 45 | −27 | −12 |
| R insula | 20 | 3.16 | 35 | 9 | −8 | |
| L middle temporal cortex | ||||||
| R middle occipital gyrus | 205 | 3.57 | 33 | −75 | 6 | |
| L fusiform gyrus | 894 | 4.64 | −45 | −39 | −18 | |
| L cerebellum crus 2 | 1517 | 4.57 | −33 | −81 | −36 | |
| Interaction effect of Group x NA, df = [1,78] | ||||||
| Depressed < Comparison | L dorsomedial prefrontal cortex | 196 | 3.92 | −12 | 63 | 6 |
| R dorsomedial prefrontal cortex | 208 | 3.46 | 9 | 57 | 3 | |
| R fusiform gyrus | 982 | 5.31 | 36 | −72 | −15 | |
| L lingual gyrus | 172 | 4.87 | −15 | −78 | −12 | |
| L middle temporal cortex | 97 | 3.95 | −54 | −36 | −10 | |
| L parahippocampus | 37 | 3.98 | −32 | 12 | 26 | |
| R cerebellum posterior | 814 | 4.27 | 39 | −39 | −30 | |
| L cerebellar tonsil | 718 | 4.13 | −15 | −54 | −48 | |
| Depressed > Comparison | R insula | 105 | 3.5 | 32 | 20 | 9 |
| R lenticular nucleus | 36 | 3.2 | 23 | 5 | −6 | |
| R uncus/amygdala | 34 | 2.74 | 14 | −6 | −23 | |
| R Precuneus | 265 | 3.4 | 18 | −45 | 12 | |
| R supplementary motor cortex | 221 | 3.4 | 12 | −30 | 57 | |
| ALFF positive correlation with NA, df = [1,78] | ||||||
| Comparison group | Dorsal anterior cingulate cortex | 152 | 3.81 | 0 | 27 | 21 |
| R dorsomedial prefrontal cortex | 150 | 3.52 | 18 | 57 | 27 | |
| R dorsomedial prefrontal cortex | 67 | 3.31 | 9 | 57 | 3 | |
| L STS and middle temporal cortex | 174 | 5.04 | −45 | −21 | −12 | |
| R cerebellum posterior | 165 | 3.75 | 3 | −84 | −33 | |
| R cerebellar crus 2 | 44 | 3.59 | −6 | −90 | −33 | |
| R cerebellar pyramis | 13 | 3.52 | 8 | −87 | −32 | |
| Depressed group | L posterior cingulate cortex | 197 | 3.19 | −3 | −60 | 21 |
| L cerebellum anterior | 465 | 4.27 | −12 | −60 | −36 | |
| R cerebellar pyramis | 51 | 3.0 | 22 | −76 | 39 | |
| ALFF negative correlation with NA, df = [1,78] | ||||||
| Comparison group | L ventromedial prefrontal cortex | 99 | 3.49 | −12 | 43 | −12 |
| R ventromedial prefrontal cortex | 30 | 3.33 | 3 | 45 | −22 | |
| R ventrolateral prefrontal cortex | 42 | 3.45 | 42 | 42 | −3 | |
| R insula | 16 | 2.20 | 33 | 18 | 3 | |
| R amygdala | 34 | 3.43 | 15 | 3 | −30 | |
| Depressed group | L ventromedial prefrontal cortex | 74 | 3.23 | −4 | 52 | 0 |
| L fusiform gyrus | 310 | 4.53 | −30 | −60 | −12 | |
| R cerebellum posterior | 814 | 4.27 | 39 | −39 | −30 | |
| MADRS correlation with ALFF, df = [1,84] | ||||||
| Positive correlation | L dorsomedial prefrontal cortex | 769 | 4.15 | −6 | 45 | 42 |
| L medial prefrontal cortex | 62 | 4.17 | −2 | 51 | 1 | |
| R precuneus | 241 | 3.93 | 9 | −57 | 63 | |
| L inferior parietal cortex | 228 | 4.54 | −30 | −57 | 57 | |
| Negative correlation | R insula | 440 | 3.14 | 35 | 6 | −6 |
| R caudate | 110 | 3.92 | 15 | 9 | 7 | |
| Middle temporal gyrus | 240 | 2.70 | −51 | −30 | 17 | |
| L fusiform gyrus | 2434 | 4.59 | −45 | −39 | −18 | |
| R cerebellar crus 2 | 1381 | 4.54 | 27 | −69 | −42 | |
| L cerebellar crus 2 | 215 | 3.48 | −32 | −72 | −40 | |
| R cerebellar tonsil | 232 | 3.27 | 9 | −60 | −42 | |
L = left, R = right, STS = superior temporal sulcus, MADRS = Montgomery-Ǻsberg Depression Rating Scale
Group × NA Effect
The whole-brain ANCOVA analyses also showed a significant interaction effect of group × NA (Table 2, also see Figure 2a). Compared with non-depressed subjects, the correlation between ALFF and NA in depressed subjects was lower in the dmPFC and temporal regions and higher in the insula, amygdala, basal ganglia, and precuneus. Different patterns of correlations between ALFF and NA were observed in depressed and non-depressed subjects (Figure 2b). Specifically, higher NA in non-depressed subjects was significantly correlated with greater ALFF in the dmPFC, superior temporal sulcus (STS) and cerebellum, and with lower ALFF in the vmPFC, ventrolateral prefrontal cortex (vlPFC), insula and amygdala (Figure 2b, left). Higher NA in depressed subjects was correlated with greater posterior cingulate (PCC) and anterior cerebellar ALFF and lower vmPFC and posterior cerebellar ALFF (Figure 2b, right).
Figure 2.
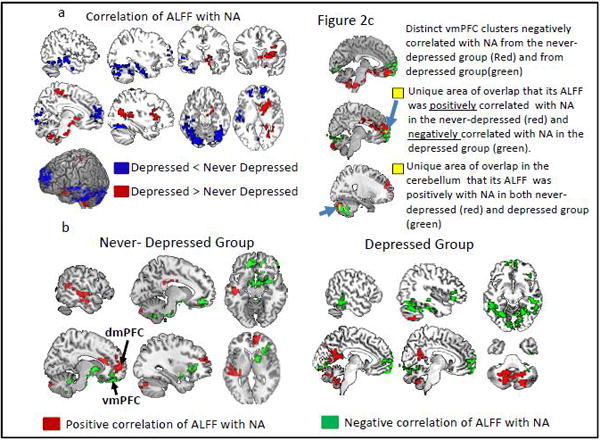
Correlation of ALFF with Negative Affectivity (NA) in depressed and never-depressed groups from ANCOVA. Figure 2a shows brain areas of significant correlation differences between the two groups. Red= depressed > never-depressed; Blue= depressed <never-depressed; Figure 2b shows brain areas that their ALFF showed significant positive (red) and negative (green) correlations with NA in never-depressed (left) and depressed (right) groups. Figure 2b conjunctions analyses showing overlapping areas of correlations between the two groups.
The vmPFC and dmPFC
Although both never-depressed and depressed subjects showed lower vmPFC ALFF in higher NA subjects, there was no overlap between groups in the vmPFC (Figure 2c). The vmPFC cluster in the never-depressed group was more anterior and ventral compared with the vmPFC cluster in the depressed group (Figure 2c, top). Importantly, we found that there was a small region in the rostral mPFC in which its ALFF showed positive correlation with NA in never-depressed group but negative correlation with NA in the depressed group (Figure 2c, middle). This rostral mPFC is also part of the dmPFC cluster that showed significant difference between the two groups, shown in Figure 2a in blue color. We found a positive correlation between NA and ALFF in a small region in the cerebellar vermis in both groups.
Correlation between ALFF and MADRS
As shown in Table 2, several areas of the brain showed a significant correlation between ALFF and MADRS among all subjects including the dmPFC, precuneus, and inferior parietal cortex. To better understand how NA may be related to vulnerability to depression, we also compared brain regions where ALFF values were associated with both NA among the never-depressed group and severity of depressive symptoms across all subjects. In the never-depressed group, there was a small degree of overlap in correlations between ALFF and NA and ALFF and MADRS in the rostral mPFC, suggesting the significance of this region in high NA and depression.
Resting state functional connectivity (rsFC) analyses
In rsFC using a vmPFC seed and a dmPFC seed we found group effect and group x NA effect. The post hoc testing results on group differences in rsFC are shown in Tables 3 and 4. Below we report results from analyses focusing on interaction of group × NA.
Table 3.
Brain regions with post-hoc tests of ANCOVA analysis that showed significant group effects and significant group × negative affect (NA) effects on dorsomedial prefrontal cortex (dmPFC) seed-based functional connectivity, as well regions that showed significant correlation between dmPFC connectivity and MADRS (p<0.05 with FDR cluster correction). Sub-clusters are marked in italics.
| Contrast | Brain Regions | Cluster Size | Peak Z Value | Peak voxel coordinates | ||
|---|---|---|---|---|---|---|
| Group effect, df=[1,78] | ||||||
| Comparison > Depressed | R posterior cingulate cortex | 118 | 3.59 | 12 | −63 | 39 |
| Depressed > Comparison | --- | |||||
| Positive correlation of NA, df=[1,78] | ||||||
| Comparison group | --- | |||||
| Depressed group | L middle temporal cortex | 273 | 4.26 | −42 | 9 | −30 |
| R middle temporal cortex | 108 | 3.6 | 57 | 9 | −27 | |
| R amygdala | 34 | 3.15 | 23 | −5 | −24 | |
| R inferior occipital cortex | 72 | 3.33 | 27 | −84 | −12 | |
| Negative correlation of NA, df=[1,78] | ||||||
| Comparison group | L insula | 116 | 4.08 | −30 | 21 | 21 |
| L dorsolateral prefrontal cortex | 3.33 | −39 | 24 | 27 | ||
| Depressed group | L dorsomedial prefrontal cortex | 165 | 3.77 | −9 | 15 | 60 |
| L caudate | 395 | 4.22 | −12 | 18 | 3 | |
| R caudate | 57 | 3.03 | 18 | 24 | −1 | |
| R posterior cingulate cortex | 73 | 3.46 | 18 | −47 | 32 | |
| R cerebellar cortex | 63 | 4.53 | 9 | −58 | −39 | |
| Correlation of MADRS, df=[1,84] | ||||||
| Positive correlation | L dorsomedial prefrontal cortex | 225 | 3.62 | −12 | 39 | 45 |
| R dorsomedial prefrontal cortex | 17 | 3.43 | 12 | 42 | 45 | |
| Negative correlation | L posterior cingulate cortex | 106 | 3.79 | −12 | 54 | 39 |
| L dorsolateral prefrontal cortex | 116 | 4.08 | −39 | 24 | 27 | |
L = left, R = right, MADRS = Montgomery-Ǻsberg Depression Rating Scale
Table 4.
Brain regions with post-hoc tests of ANCOVA analysis that showed significant group effects and significant group × negative affect (NA) effects on dorsomedial prefrontal cortex (dmPFC) seed-based functional connectivity, as well regions that showed significant correlation between dmPFC connectivity and MADRS (p<0.05 with FDR cluster correction). Sub-clusters are marked in italics.
| Contrast/groups | Brain Regions | Cluster Size | Peak Z Value | Peak voxel coordinates | ||
|---|---|---|---|---|---|---|
| Group effect, df=[1,78] | ||||||
| Depressed < Comparison | L inferior temporal cortex | 69 | 4.29 | −51 | −48 | −8 |
| R inferior temporal cortex | 225 | 3.79 | 54 | −6 | −33 | |
| L middle temporal cortex | 144 | 4.22 | −52 | −24 | −9 | |
| L temporo-parietal conjunction | 84 | 3.31 | −48 | −75 | −12 | |
| R lateral parietal | 65 | 3.85 | 60 | −57 | 24 | |
| R visual cortex | 54 | 4.01 | 6 | −87 | −9 | |
| L motor cortex | 136 | 3.69 | −9 | −42 | 75 | |
| Depressed > Comparison | --- | |||||
| Group differences in correlation of NA, df=[1,78] | ||||||
| Depressed < Comparison | --- | |||||
| Depressed > Comparison | L extrastriate cortex | 67 | 3.86 | −9 | −102 | −12 |
| L temporal pole | 91 | 3.57 | −42 | 9 | −30 | |
| R amygdala | 108 | 3.45 | 57 | 9 | −27 | |
| Positive correlation of NA, df=[1,78] | ||||||
| Comparison group | --- | |||||
| Depressed group | R middle temporal cortex | 273 | 4.03 | 57 | −21 | −18 |
| L middle temporal cortex | 136 | 4 | −60 | −9 | −15 | |
| L inferior temporal cortex | 71 | 3.87 | −42 | −63 | 24 | |
| L posterior cingulate cortex | 56 | 3.66 | −3 | −33 | 42 | |
| R lateral parietal cortex | 99 | 3.41 | 54 | −54 | 30 | |
| L fusiform gyrus | 51 | 3.37 | −33 | −45 | −12 | |
| R hippocampus | 78 | 3.37 | 25 | −6 | −22 | |
| R amygdala | 27 | 3.15 | 31 | −1 | −17 | |
| R cerebellar cortex | 50 | 4.21 | 12 | −84 | −45 | |
| Negative correlation of NA, df=[1,78] | ||||||
| Comparison group | --- | |||||
| Depressed group | R Caudate | 136 | 3.70 | 15 | 21 | 3 |
| L Caudate | 38 | 3.46 | −6 | 15 | 3 | |
| Correlation of MADRS, df=[1,78] | ||||||
| Positive correlation | L dorsomedial prefrontal cortex | 75 | 3.32 | −9 | 57 | 18 |
| Negative correlation | Motor cortex | 128 | 3.89 | 24 | −12 | 39 |
L = left, R = right, MADRS = Montgomery-Ǻsberg Depression Rating Scale
Group × NA Effect
There were no significant interaction group x NA effects on dmPFC seed-based connectivity (see Tables 3 and 4). However, regression analysis by group revealed that there was a negative correlation between NA and dmPFC-insula and dmPFC-DLFPC connectivity in non-depressed subjects (Table 3). There were no positive associations between NA and dmPFC connectivity in non-depressed subjects. In contrast, in the depressed group, there were many regions where connectivity with the dmPFC seed correlated (both positively and negatively) with NA (see Table 3 and Figure 3). Regarding group x NA interaction effect on the vmPFC seed-based rsFC, post-hoc tests revealed that older adults with depression demonstrated a greater correlation between NA and vmPFC-amygdala and vmPFC-temporal pole rsFC compared with the never-depressed subjects. However, there were no significant correlations of any kind between vmPFC-based rsFC and NA in non-depressed subjects. However, there were many regions in the depressed group where connectivity with the vmPFC seed were correlated (both positively and negatively) with NA (see Table 4 and Figure 4). There were also several regions in depressed subjects where the correlations of rsFC with NA were similar between the vmPFC seed and the dmPFC seed (Figure 4). Specifically, both the dmPFC and vmPFC seeds showed greater correlation of FC in the amygdala and MTC and lower correlation of FC in the caudate with NA (Figure 4). We did not observe such an overlap in the vmPFC and dmPFC regions among never-depressed individuals.
Figure 3.

Brain regions showing significant correlation of functional connectivity with Negative Affectivity (NA) in the depressed group. Left, dorsomedial prefrontal cortex (dmPFC) connectivity; Right, ventromedial prefrontal cortex. Red= positive correlation; Green=negative correlation
Figure 4.

Upper panel. Maps showing vmPFC (red), dmPFC (green), and regions of overlap (yellow) in connectivity with Negative Affectivity (NA) in the depressed group. Lower panel. The plot of the vmPFC-amygdala rsFC correlation with NA. The vmPFC-amygdala rsFC was extracted from the significant cluster in the whole-brain voxel wise ANCOVA analysis with the vmPFC seed-based rsFC maps. This plot only serves to illustrate the difference in the correlation between never-depressed and depressed group rather than a statistical calculation.
Correlation of MADRS with dmPFC and vmPFC seed-based connectivity. Similar to the negative correlation between higher NA with lower dmPFC-dlPFC connectivity in the never depressed group, there was also a significantly negative correlation between severe depression severity (MADRS) and lower dmPFC-dlPFC connectivity (Table 3). In addition, similar to negative correlation between higher NA with lower dmPFC-PCC connectivity in the depressed group, there was a significantly negative correlation between severe MADRS with lower dmPFC-PCC connectivity (Table 4). Furthermore, unlike negative correlation of higher NA with dmPFC-dmPFC connectivity in the depressed group, there was a positive correlation between severe MADRS with higher dmPFC-dmPFC connectivity.
All the significant results reported above were below the threshold of p<0.05 using a FDR cluster correction. We also applied a more conservative correction using the SnPM permutation test, and these permutation test analyses did not result in any significant findings.
Conclusions
We aimed to identify neural substrates of Negative Affectivity (NA) that are related to the development of depression and might be associated with adaptation to high NA or resilience to depression in older adults. As we expected, with FDR cluster correction, we indeed found that NA was associated with neuronal activity in different brain regions between never-depressed and depressed older adults during resting state, particularly in the dorsomedial prefrontal cortex (dmPFC) and ventromedial prefrontal cortex (vmPFC), and their functional connectivity with the amygdala and posterior cingulate cortex (PCC). In the never-depressed group, higher NA was associated with increased resting activity (as measured by ALFF) in the dmPFC and decreased resting activity in the anterior vmPFC and amygdala, as well as decreased dmPFC-insula and dmPFC-dlPFC connectivity. By contrast, higher NA in the depressed group was associated with increased resting activity in the posterior cingulate (PCC)/precuneus, and increased dmPFC/vmPFC-amygdala, dmPFC/vmPFC-MTC, and vmPFC-PCC connectivity, as well as decreased posterior vmPFC activity and decreased dmPFC/vmPFC-caudate connectivity. The current findings provide confirmatory evidence of the segregated function between dmPFC and vmPFC in emotion regulation. Moreover, to our knowledge this is the first study to identify different neural activation associations with NA, a key component of neuroticism, between depressed and never-depressed older adults.
It is interesting that higher NA appears to be related to neuronal activity of different brain structures among older adults with and without depression. It may be that the construct of NA is different in depressed and non-depressed groups. One might posit that older adults who have never been depressed but endorse high NA (i.e., often have a bad mood, experience irritability or worry) are clinically and neurobiologically different from a group of currently depressed patients who endorse similar experiences. Indeed, we found little common resting activity or dmPFC/vmPFC connectivity patterns between the two groups. Although higher NA in both never-depressed and depressed subjects was significantly correlated with lower vmPFC resting activity, there were no overlapping voxels between the two groups. The significant vmPFC cluster in the depressed group was dorsal and posterior relative to the significant vmPFC cluster of the never-depressed group. We speculate that the anterior vmPFC cluster in the never-depressed group should have a different role from the posterior vmPFC cluster in the depressed group. The anterior vmPFC, which is in close proximity to the subgenual cingulate, might have similar functions as this region in promoting emotional processing and visceral responses, i.e., serving as an “affective” region, whereas the posterior vmPFC (including the rostral dmPFC cluster) may be primarily involved in emotion regulation. In support of this theory, depressed subjects showed decreased vmPFC activity as well as increased vmPFC-amygdala and vmPFC-insula connectivity, suggesting a possible failure of the posterior vmPFC cluster in regulating increased emotional salience and reactivity. In contrast, the decreased anterior vmPFC ALFF in the never-depressed group was not associated with increased amygdala or insula activity and there was also decreased amygdala activity in the comparison group with higher NA. These findings might represent resilience to the development of a mood disorder and explain why non-depressed individuals with higher NA had no history of major depression. Decreased resting activity in the ventral anterior vmPFC region and in the amygdala might be an outcome of increased dmPFC activity and subsequent emotional inhibition/regulation function in the never-depressed subjects with higher NA. That the dmPFC may exert emotional regulation could also explain significantly decreased dmPFC ALFF in the depressed than non-depressed group. In fact, this dmPFC cluster included the voxels of the rostral mPFC that showed significantly increased ALFF in never-depressed group but decreased activity in the depressed group (i.e., rostral mPFC). Our results are consistent with Koeging and colleagues who found vmPFC lesions reduced depression symptoms (reflecting the vmPFC’s role in promoting emotional processing) and therefore conferred “resistance to depression,” whereas dmPFC lesions generated depression symptoms (reflecting emotion regulation/inhibition) and conferred “vulnerability” [47]. We did not find any common features that could be related to higher NA in both never-depressed and depressed groups except for a small cluster in the cerebellum which is worth further investigation. That high NA superimposed on major depression is associated with decreased dmPFC activity (and poor emotional regulation) might help explain why neuroticism is associated with worse treatment response in older adults with major depression [5, 6]. While NA is viewed as an inherent trait, increasing evidence suggests interventions could decrease NA by assisting in emotional regulation training. For example, emotional reappraisal of negative pictures in healthy young adults both reduced the experience of NA and was associated with increased dmPFC activity and decreased activity in the amygdala and VMPFC [48]. Future research should investigate the effect of treatment on NA in older adults with major depression.
In addition to focusing on neuroticism in older adults because of its potential effects on treatment outcomes, research on neuroticism and depression in older adults is important because of their likely contributions to cognitive decline. While numerous studies have provided evidence for depression being a risk factor for cognitive decline, more recent work has implicated neuroticism as a risk factor for cognitive decline among older depressed patients [5]. Thus, research on functional brain changes related to neuroticism in late-life depression may not only inform the field on the complex relationship between personality factors and depression in the elderly, it also may help shed light on brain networks and connectivity patterns associated with the development of cognitive decline and dementia.
Findings revealed an anterior/posterior dissociative pattern of activity in the depressed and never-depressed participants. Unlike the depressed group, the never-depressed comparison group with higher NA showed increased resting activity in dmPFC, dACC, supplementary motor cortex, superior temporal sulcus, middle temporal cortex, and cerebellum. Higher NA in the depressed group was also associated with increased precuneus/PCC activity as well as cerebellum activation. This pattern of activity is consistent with the report of Andreescu et al. [49], who found that older depressed subjects with high anxiety, when compared to non-anxious depressed older adults, exhibited increased functional connectivity in the precuneus and other default mode network regions and lower activation in the mPFC and rostral anterior cingulate. Findings from our study also revealed that higher NA in the depressed group was also associated with lower dmPFC-PCC connectivity. This is consistent with evidence of disruption in posterior-to-anterior connectivity subsequent to early life stress [50, 51] suggesting the association of reduced PCC-dmPFC connectivity with higher NA could also be due to accumulated damage related to chronically high NA. Finally, in addition to reduced dmPFC-PCC connectivity, we also found increased vmPFC-PCC in association with higher NA in depressed patients, previously found to be associated with depression severity in major depression [52]. We speculate that increased vmPFC-PCC connectivity potentially represents high emotional arousing and rumination in the presence of anxiety and/or negative affectivity in depressed subjects with higher NA.
Despite several strengths, this study also has limitations that should be noted. First, none of the results passed the more conservative permutation test. Given recent concerns on cluster correction for multiple comparisons raised by Eklund and colleagues [45], we cannot exclude the possibility of false positives in our study. That our findings did not pass the more stringent statistical test might be related to our sample size. Consistent with that of other reports, the small number of non-depressed adults with high NA may limit our power to differentiate effects of negative affectivity and depression among older adults. We analyzed functional connectivity only using vmPFC and dmPFC seeds given our prior hypotheses. Future studies on functional connectivity using more seeds or whole-brain voxels would better characterize resilient and vulnerable changes to depression. In addition, our use of the seven-item NA component of the DS-14 might be seen as a limitation. Whereas early evidence demonstrated that the DS-14 highly correlated with neuroticism and other measures of negative affect [25], a more recent factor analysis suggests the measure considerably overlaps with symptoms of major depression [53]. This may explain why there was little overlap in the distribution of the DS-14 between our depressed and non-depressed subjects. We aimed to mitigate potential differences in distribution of NA between groups through our strategy of oversampling for higher NA scores among the comparison group during the screening process. Future studies should include broader neuroticism measures such as the NEO Personality Inventory [2] that extend beyond negative affectivity in order to better understand the clinical and neurobiological intersection of neuroticism and depression in older adults.
In sum, the current study revealed unique patterns of neuronal activity and functional connectivity among never depressed and currently depressed individuals scoring high in NA, although all these results require future confirmation with a larger study sample size. Our findings suggest that increased rostral mPFC activity may be a marker of resilience to depression in the elderly and that decreased anterior vmPFC/PCC/amygdala activity may result from successful emotion regulation in never-depressed higher NA individuals. We failed to identify NA trait-specific resting activity and connectivity patterns except increased cerebellar activity. Future studies using larger sample sizes and whole-brain functional connectivity analysis to compare never-depressed high NA individuals and first-episode depressed high NA would better capture resilience and vulnerability of high NA to depression.
Acknowledgments
Supported by NIH grant R01 MH096725
Footnotes
Publisher's Disclaimer: This is a PDF file of an unedited manuscript that has been accepted for publication. As a service to our customers we are providing this early version of the manuscript. The manuscript will undergo copyediting, typesetting, and review of the resulting proof before it is published in its final citable form. Please note that during the production process errors may be discovered which could affect the content, and all legal disclaimers that apply to the journal pertain.
References
- 1.Eysenck HJ, Eysenck SBG. Manual of the Eysenck Personality Questionnaire. London: Hodder and Stoughton; 1975. [Google Scholar]
- 2.Costa PT, McCrae RR. Revised NEO Personality Inventory (NEO-PI-R) and NEO Five-Factor Inventory (NEO-FFI) Professional Manual. Odessa, FL: Psychological Assessment Resources; 1992. [Google Scholar]
- 3.Hirschfeld RM, Klerman GL, Lavori P, et al. Premorbid personality assessments of first onset of major depression. Arch Gen Psychiatry. 1989;46:345–350. doi: 10.1001/archpsyc.1989.01810040051008. [DOI] [PubMed] [Google Scholar]
- 4.Kendler KS, Kuhn J, Prescott CA. The interrelationship of neuroticism, sex, and stressful life events in the prediction of episodes of major depression. Am J Psychiatry. 2004;161:631–636. doi: 10.1176/appi.ajp.161.4.631. [DOI] [PubMed] [Google Scholar]
- 5.Steffens DC, McQuoid DR, Smoski MJ, et al. Clinical outcomes of older depressed patients with and without comorbid neuroticism. Int Psychogeriatr. 2013;25:1985–1990. doi: 10.1017/S1041610213001324. [DOI] [PMC free article] [PubMed] [Google Scholar]
- 6.Manning KJ, Chan G, Steffens DC. Neuroticism traits selectively impact long-term illness course and cognitive decline in late-life depression. Am J Geriatr Psychiatry. doi: 10.1016/j.jagp.2016.10.006. in press. [DOI] [PMC free article] [PubMed] [Google Scholar]
- 7.Luchetti M, Cutti AG, Verni G, et al. Personality and cognitive decline in older adults: Data from a longitudinal sample and meta-analysis. J Gerontol B Psychol Sci Soc Sci. 2016;71:591–601. doi: 10.1093/geronb/gbu184. [DOI] [PMC free article] [PubMed] [Google Scholar]
- 8.Terracciano A, Iacono D, O’Brien RJ, et al. Personality and resilience to Alzheimer’s disease neuropathology: a prospective autopsy study. Neurobiol Aging. 2013;34:1045–1050. doi: 10.1016/j.neurobiolaging.2012.08.008. [DOI] [PMC free article] [PubMed] [Google Scholar]
- 9.Terracciano A, McCrae RR, Brant LJ, et al. Hierarchical linear modeling analyses of the NEO-PI-R scales in the Baltimore Longitudinal Study of Aging. Psychol Aging. 2005;20:493–506. doi: 10.1037/0882-7974.20.3.493. [DOI] [PMC free article] [PubMed] [Google Scholar]
- 10.Chan SW, Harmer CJ, Norbury R, et al. Hippocampal volume in vulnerability and resilience to depression. J Affect Disord. 2016;189:199–202. doi: 10.1016/j.jad.2015.09.021. [DOI] [PubMed] [Google Scholar]
- 11.Whalley HC, Sussmann JE, Romaniuk L, et al. Dysfunction of emotional brain systems in individuals at high risk of mood disorder with depression and predictive features prior to illness. Psychol Med. 2015;45:1207–1218. doi: 10.1017/S0033291714002256. [DOI] [PubMed] [Google Scholar]
- 12.DeYoung CG, Hirsh JB, Shane MS, et al. Testing predictions from personality neuroscience. Brain structure and the big five. Psychol Sci. 2010;21:820–828. doi: 10.1177/0956797610370159. [DOI] [PMC free article] [PubMed] [Google Scholar]
- 13.Omura K, Todd Constable R, Canli T. Amygdala gray matter concentration is associated with extraversion and neuroticism. Neuroreport. 2005;16:1905–1908. doi: 10.1097/01.wnr.0000186596.64458.76. [DOI] [PubMed] [Google Scholar]
- 14.Wright CI, Williams D, Feczko E, et al. Neuroanatomical correlates of extraversion and neuroticism. Cereb Cortex. 2006;16:1809–1819. doi: 10.1093/cercor/bhj118. [DOI] [PubMed] [Google Scholar]
- 15.Haas BW, Constable RT, Canli T. Stop the sadness: Neuroticism is associated with sustained medial prefrontal cortex response to emotional facial expressions. Neuroimage. 2008;42:385–392. doi: 10.1016/j.neuroimage.2008.04.027. [DOI] [PMC free article] [PubMed] [Google Scholar]
- 16.Cunningham WA, Arbuckle NL, Jahn A, et al. Aspects of neuroticism and the amygdala: chronic tuning from motivational styles. Neuropsychologia. 2010;48:3399–3404. doi: 10.1016/j.neuropsychologia.2010.06.026. [DOI] [PubMed] [Google Scholar]
- 17.Eickhoff SB, Laird AR, Fox PT, et al. Functional Segregation of the Human Dorsomedial Prefrontal Cortex. Cereb Cortex. 2016;26:304–321. doi: 10.1093/cercor/bhu250. [DOI] [PMC free article] [PubMed] [Google Scholar]
- 18.Ongur D, Price JL. The organization of networks within the orbital and medial prefrontal cortex of rats, monkeys and humans. Cereb Cortex. 2000;10:206–219. doi: 10.1093/cercor/10.3.206. [DOI] [PubMed] [Google Scholar]
- 19.Bzdok D, Langner R, Schilbach L, et al. Segregation of the human medial prefrontal cortex in social cognition. Front Hum Neurosci. 2013;7:232. doi: 10.3389/fnhum.2013.00232. [DOI] [PMC free article] [PubMed] [Google Scholar]
- 20.Aghajani M, Veer IM, van Tol MG, et al. Neuroticism and extraversion are associated with amygdala resting-state functional connectivity. Cogn Affect Behav Neurosci. 2014;14:836–848. doi: 10.3758/s13415-013-0224-0. [DOI] [PubMed] [Google Scholar]
- 21.Weber K, Giannakopoulos P, Delaloye C, et al. Volumetric MRI changes, cognition and personality traits in old age depression. J Affect Disord. 2010;124:275–282. doi: 10.1016/j.jad.2009.11.016. [DOI] [PubMed] [Google Scholar]
- 22.McIntosh AM, Bastin ME, Luciano M, et al. Neuroticism, depressive symptoms and white-matter integrity in the Lothian Birth Cohort 1936. Psychol Med. 2013;43:1197–1206. doi: 10.1017/S003329171200150X. [DOI] [PubMed] [Google Scholar]
- 23.Folstein MF, Folstein SE, McHugh PR. Mini-Mental state. A practical method for grading the cognitive state of patients for the clinician. J Psychiatr Res. 1975;12:189–198. doi: 10.1016/0022-3956(75)90026-6. [DOI] [PubMed] [Google Scholar]
- 24.Weissman MM, Sholomskas D, Pottenger M, et al. Assessing depressive symptoms in five psychiatric populations: a validation study. Am J Epidemiol. 1977;106:203–214. doi: 10.1093/oxfordjournals.aje.a112455. [DOI] [PubMed] [Google Scholar]
- 25.Denollet J. DS14: standard assessment of negative affectivity, social inhibition, and Type D personality. Psychosom Med. 2005;67:89–97. doi: 10.1097/01.psy.0000149256.81953.49. [DOI] [PubMed] [Google Scholar]
- 26.Steffens DC, Manning KJ, Wu R, et al. Methodology and preliminary results from the neurobiology of late-life depression study. Int Psychogeriatr. 2015;27:1987–1997. doi: 10.1017/S1041610215001386. [DOI] [PMC free article] [PubMed] [Google Scholar]
- 27.Landerman R, George LK, Campbell RT, et al. Alternative models of the stress buffering hypothesis. Am J Comm Psychol. 1989;17:626–642. doi: 10.1007/BF00922639. [DOI] [PubMed] [Google Scholar]
- 28.Robins N, Helzer JE, Croughan J, et al. National Institute of Mental Health diagnostic interview schedule. Arch Gen Psychiatry. 1981;38:381–389. doi: 10.1001/archpsyc.1981.01780290015001. [DOI] [PubMed] [Google Scholar]
- 29.Montgomery SA, Asberg M. A new depression scale designed to be sensitive to change. Br J Psychiatry. 1979;134:382–389. doi: 10.1192/bjp.134.4.382. [DOI] [PubMed] [Google Scholar]
- 30.Hamilton M. A rating scale for depression. J Neurol Neurosurg Psychiatry. 1960;23:55–61. doi: 10.1136/jnnp.23.1.56. [DOI] [PMC free article] [PubMed] [Google Scholar]
- 31.Keller MB, Lavori PW, Friedman B, et al. The Longitudinal Interval Follow-up Evaluation. A comprehensive method for assessing outcome in prospective longitudinal studies. Arch Gen Psychiatry. 1987;44:540–548. doi: 10.1001/archpsyc.1987.01800180050009. [DOI] [PubMed] [Google Scholar]
- 32.Sackeim HA, Prudic J, Devanand DP, et al. The impact of medication resistance and continuation pharmacotherapy on relapse following response to electroconvulsive therapy in major depression. J Clin Psychopharmacol. 1990;10:96–104. doi: 10.1097/00004714-199004000-00004. [DOI] [PubMed] [Google Scholar]
- 33.Linn BS, Linn MW, Gurel L. Cumulative Illness Rating Scale. J Am Geriatr Soc. 1988;16:622–626. doi: 10.1111/j.1532-5415.1968.tb02103.x. [DOI] [PubMed] [Google Scholar]
- 34.Miller MD, Paradis CF, Houck PR, et al. Rating chronic medical illness burden in geropsychiatric practice and research: application of the Cumulative Illness Rating Scale. Psychiatry Research. 1992;41:237–248. doi: 10.1016/0165-1781(92)90005-n. [DOI] [PubMed] [Google Scholar]
- 35.Costa PT, McCrae RR. The NEO personality inventory manual. Odessa, FL: Psychological Assessment Resources; 1985. [Google Scholar]
- 36.Morris JC, Heyman A, Mohs RC, et al. The Consortium to Establish a Registry for Alzheimer’s Disease (CERAD). Part I Clinical and neuropsychological assessment of Alzheimer’s disease. Neurol. 1989;39:1159–1165. doi: 10.1212/wnl.39.9.1159. [DOI] [PubMed] [Google Scholar]
- 37.Welsh KA, Butters N, Mohs RC, et al. The Consortium to Establish a Registry of Alzheimer’s Disease (CERAD) Part V: A normative study of the neuropsychological battery. Neurol. 1994;44:609–614. doi: 10.1212/wnl.44.4.609. [DOI] [PubMed] [Google Scholar]
- 38.Yan CG, Wang XD, Zuo XN, et al. DPABI: Data Processing & Analysis for (Resting-State) Brain Imaging. Neuroinformatics. 2016;14:339–351. doi: 10.1007/s12021-016-9299-4. [DOI] [PubMed] [Google Scholar]
- 39.Ashburner K. A fast diffeomorphic image registration algorithm. Neuroimage. 2007;38:95–113. doi: 10.1016/j.neuroimage.2007.07.007. [DOI] [PubMed] [Google Scholar]
- 40.Friston KJ, Williams S, Howard R, et al. MOvement-related effects in fMRI time-series. Magn Reson Med. 1996;35:346–355. doi: 10.1002/mrm.1910350312. [DOI] [PubMed] [Google Scholar]
- 41.Zang YF, He Y, Zhu CZ, et al. Altered baseline brain activity in children with ADHD revealed by resting-state functional MRI. Brain Dev. 2007;29:83–91. doi: 10.1016/j.braindev.2006.07.002. [DOI] [PubMed] [Google Scholar]
- 42.Wang L, Dai W, Su Y, et al. treatment-naive patients with major depressive disorder: a resting-state functional MRI study. PLoS ONE. 2012;7:e48658. doi: 10.1371/journal.pone.0048658. [DOI] [PMC free article] [PubMed] [Google Scholar]
- 43.Cai S, Chong T, Peng Y, et al. Altered functional brain networks in amnestic mild cognitive impairment: a resting-state fMRI study. Brain Imaging Behav. doi: 10.1007/s11682-016-9539-0. in press. [DOI] [PubMed] [Google Scholar]
- 44.Khadka S, Meda SA, Stevens MC, et al. Is aberrant functional connectivity a psychosis endophenotype? A resting state functional magnetic resonance imaging study. Biol Psychiatry. 2013;74:458–466. doi: 10.1016/j.biopsych.2013.04.024. [DOI] [PMC free article] [PubMed] [Google Scholar]
- 45.Eklund A, Nichols TE, Knutson H. Cluster failure: Why fMRI inferences for spatial extent have inflated false-positive rates. Proc Natl Acad Sci USA. 2016;113:7900–7905. doi: 10.1073/pnas.1602413113. [DOI] [PMC free article] [PubMed] [Google Scholar]
- 46.Winkler AM, Ridgway GR, Webster MA, et al. Permutation inference for the general linear model. Neuroimage. 2014;92:381–397. doi: 10.1016/j.neuroimage.2014.01.060. [DOI] [PMC free article] [PubMed] [Google Scholar]
- 47.Koenigs M, Huey ED, Calamia M, et al. Distinct regions of prefrontal cortex mediate resistance and vulnerability to depression. J Neurosci. 2008;28:12341–12348. doi: 10.1523/JNEUROSCI.2324-08.2008. [DOI] [PMC free article] [PubMed] [Google Scholar]
- 48.Ochsner KN, Bunge SA, Gross GG, et al. Rethinking feelings: an FMRI study of the cognitive regulation of emotion. J Cogn Neurosci. 2002;14:1215–1229. doi: 10.1162/089892902760807212. [DOI] [PubMed] [Google Scholar]
- 49.Andreescu C, Gross JJ, Lenze, et al. Altered cerebral blood flow patterns associated with pathologic worry in the elderly. Depress Anxiety. 2011;28:202–209. doi: 10.1002/da.20799. [DOI] [PMC free article] [PubMed] [Google Scholar]
- 50.Fransson P, Aden U, Blennow M, et al. The functional architecture of the infant brain as revealed by resting-state fMRI. Cereb Cortex. 2011;21:145–154. doi: 10.1093/cercor/bhq071. [DOI] [PubMed] [Google Scholar]
- 51.Smyser CD, Snyder AZ, Neil JJ. Functional connectivity MRI in infants: exploration of the functional organization of the developing brain. Neuroimage. 2011;56:1437–1452. doi: 10.1016/j.neuroimage.2011.02.073. [DOI] [PMC free article] [PubMed] [Google Scholar]
- 52.Greicius MD, Flores BH, Menon V, et al. Resting-state functional connectivity in major depression: abnormally increased contributions from subgenual cingulate cortex and thalamus. Biol Psychiatry. 2007;62:429–437. doi: 10.1016/j.biopsych.2006.09.020. [DOI] [PMC free article] [PubMed] [Google Scholar]
- 53.Ossola P, De Panfilis C, Tonna M, et al. DS14 is more likely to measure depression rather than a personality disposition in patients with acute coronary syndrome. Scan J Psychology. 2015;56:685–692. doi: 10.1111/sjop.12244. [DOI] [PubMed] [Google Scholar]