

Abstract
Particulate matter emissions from agricultural livestock operations contain both chemical and biological constituents that represent a potential human health hazard. The size and composition of these dusts, however, have not been well described. We evaluated the full size distribution (from 0 to 100 μm in aerodynamic diameter) and chemical/biological composition of inhalable dusts inside several Colorado dairy parlors. Four aerodynamic size fractions (<3, 3–10, 10–30, and >30 μm) were collected and analyzed using a combination of physiochemical techniques to understand the structure of bacterial communities and chemical constituents. Airborne particulate mass followed a bimodal size distribution (one mode at 3 μm and a second above 30 μm), which also correlated with the relative concentrations of the following microbiological markers: bacterial endotoxin, 3-hydroxy fatty acids, and muramic acid. Sequencing of the 16S-rRNA components of this aerosol revealed a microbiome derived predominantly from animal sources. Bacterial genera included Staphlyococcus, Pseudomonas, and Streptococcus, all of which have proinflammatory and pathogenic capacity. Our results suggest that the size distribution of bioaerosols emitted by dairy operations extends well above 10 μm in diameter and contains a diverse mixture of potentially hazardous constituents and opportunistic pathogens. These findings should inform the development of more effective emissions control strategies.
Introduction
Livestock operations have changed dramatically over the past century following trends of consolidation, mechanization, and increased productivity.(1, 2) This modernization has intensified the generation of pollutants from these operations.(3–6) In Colorado (and elsewhere), the recent expansion of residential development in proximity to animal production facilities has caused concern regarding potential public health risks posed by these operations.(6–8) Fugitive emissions (e.g., ammonia, hydrogen sulfide, and particulate matter [PM]) from livestock operations have been detected in residential areas up to five kilometers away,(9–13) and health effects associated primarily with the bioaerosol fraction of these emissions have been linked to residential proximity to feedlot operations.(5–8, 13–16) Agricultural bioaerosols, which contain bacteria from sources such as bedding material, feed, and livestock (i.e., manure, skin, allergens, and dander), provoke inflammatory responses that reduce lung function, which may result in a wide range of acute and chronic airway diseases.(17, 18) Dairy workers are also at risk of exposure to these emissions, which are highest during specific tasks such as rebedding stalls, feeding, and milking cows.(19) Occupational exposure to dairy-generated aerosols has been linked to higher rates of respiratory disorders (e.g., asthma and interstitial lung disease) among some dairy farmers;(19) however, knowledge gaps remain in the etiology of lung diseases in the dairy environment.(19–22) This occupational disease burden is a major concern to the dairy industry as the workforce (>164,000 in the United States and >1,000,000 worldwide) continues to expand to meet increased demand for dairy products.(23, 24)
A key step to reducing the health burden posed by aerosol emissions from livestock operations is the identification of causal risk factors for disease. Dairy-related aerosols contain particles of varying shape, size, and organic/inorganic composition, which can also vary by geography, land use, operation, and practice.(20, 22, 25–37) While health effects from exposure to fine (PM2.5)(38) and coarse (PM2.5–10)(39) fractions of dairy PM have been reported, characterization of particles larger than 10 μm and their relative contribution to health effects has been limited. These larger particles (10 to 100 μm) are known to deposit in the upper respiratory system (and may cause conditions such as rhinitis and sinusitis(40–42)), yet their presence and composition remain largely unstudied. These particles also translocate into the digestive system following nasopharyngeal deposition; the effects of which are also unstudied. Yet, very few instruments can size-segregate aerosols across the entire inhalable range (spanning 0 to 100 μm in aerodynamic diameter); most aerosol sampling techniques have an upper measurement limit of 20 μm.
Dairy microenvironments foster rich and abundant microbial communities. Dairy PM can contain a wide range of biological constituents, including opportunistic pathogens and related inflammagens.(20, 37) Previous research has focused largely on respiratory effects following exposure to Gram-negative bacterial endotoxin.(19, 29, 33, 43) However, the endotoxin content of these aerosols does not fully explain observed respiratory health outcomes.(19, 20, 22, 44–48) As such, more in-depth study of other etiologic agents, such as Gram-positive bacteria, is needed. The goal of this work was to characterize the full size distribution and bacterial composition of inhalable particulate matter generated by modern dairy operations. We hypothesized that a significant fraction of the airborne microbiome was present in nonstandard aerosol size fractions (i.e., within particles larger than 10 μm). To test this hypothesis, we deployed a specialized high-volume cascade impactor (IESL v2)(49) capable of sampling PM sizes up to 100 μm. We focused primarily on milking parlors, the chief production area among dairies.
Materials and Methods
Sample Collection
Study Sites
Three Colorado dairies representative of large-herd operations (i.e., at least 1,000 lactating cows) were recruited to participate. Two operations employed a parallel milking parlor design, while the third operation used a rotary configuration (Figure 1). These two designs are common throughout the industry, each with particular advantages and limitations with regard to throughput.(50) Parallel parlors are most common in large herd operations where cows are positioned in stationary stalls; however, rotary parlors have certain advantages given the highly automated process where cows enter/exit a rotating carousel.(51, 52)
Figure 1.

Milking parlor configurations: (a) parallel and (b) rotary used at the dairy operations that participated in this study. Reprinted/adapted with permission from ref 50. Copyright 2013 Taylor & Francis.
The IESL v2 sampler, described below, was positioned near the operator pit inside each milking parlor to collect a representative aerosol sample across a full work shift. Samples were collected over four different campaigns at each dairy (n = 12 days). Sampling at each dairy was spread out to represent fall, winter, spring, and summer seasons (Table 1). The IESL v2 cascade impactor was modified from its original design for atmospheric sampling(49) to segregate airborne dust into four aerodynamic size fractions: >30, 10–30, 3–10, and <3 μm. These size fractions were chosen to represent particles that could potentially deposit in the pulmonary, tracheo-bronchial, and upper regions of the respiratory system. Particular emphasis was made to investigate particles larger than 10 μm, which is the upper limit of most aerosol sizing equipment. The three largest size fractions were collected onto PTFE impaction substrates,(49) while particles smaller than 3 μm were collected on a PTFE final filter (20 × 20 cm, Zefluor, 3 μm pore size). A rotary vane blower (Gast model R4110–2, Benton Harbor, MI) maintained a flow of 1500 L/min through the instrument, which was monitored in real time using an in-line mass flow meter (Sierra Instruments model 760-N5 (Monterey, CA). Details of the impactor modifications and operation are provided in the Supporting Information (Figures S2 and S3).
Table 1.
Milking Parlor Configurations and IESL v2 Sampling Characteristics
| parlor design | date of collection | sample time (min) | total volume (L) | total PM collected (mg) |
|---|---|---|---|---|
| Dairy 1 | ||||
| parallel | Nov 2012 | 480 | 647214 | 76 |
| April 2013 | 551 | 734465 | 132 | |
| Dec 2012 | 543 | 773739 | 74 | |
| July 2013 | 480 | 696800 | 124 | |
| Dairy 2 | ||||
| rotary | Nov 2012 | 552 | 781160 | 115 |
| Jan 2013 | 594 | 835984 | 89 | |
| May 2013 | 501 | 666431 | 50 | |
| Aug 2013 | 448 | 669760 | 47 | |
| Dairy 3 | ||||
| parallel | April 2013 | 375 | 535015 | 55 |
| June 2013 | 462 | 658214 | 84 | |
| Sept 2013 | 471 | 699707 | 60 | |
| Jan 2014 | 416 | 618383 | 55 | |
Since the top three stages of the IESL v2 used Teflon-based substrates rather than filters, samples were retreived using a Teflon spatula. An NRD Staticmaster 1 × 3-in. ionizing unit was used in tandem with the spatula to minimize electrostatic losses during recovery. All samples were weighed to the nearest 0.1 mg on an analytical balance (Denver Instrument M-series 220D, Arvada, CO). The final filters were weighed pre- and postsampling following a 24-h equilibration in a HEPA-filtered weighing room. We designed two equilibration chambers to house filters pre- and postsampling. One Zefluor afterfilter was dedicated as a laboratory blank and housed in the clean, presampling equilibration chamber. This blank filter was used to correct for any error in measurements and determination of sampling efficiency. All samples were stored at −80 °C prior to analysis.
Sample Analysis
Postsampling, an aliquot of approximately 1 mg of dust from the top three stages of the IESL v2 was weighed using a Mettler Toledo MX5 (Columbus, OH). Subsequently, each fraction was extracted in 10 mL of 0.05% TWEEN-20 solution(53) with mechanical agitation (vortexing and shaking). Since aliquots of afterfilter extracts were to be used in future cell culture studies, Tween was not used, as it is a known cytotoxin (see below).
Afterfilter Extraction
Each PTFE Zefluor afterfilter was serially sonicated in solvents of decreasing polarity as previously described.(54) The afterfilter was preweighed, placed in a 50 mL pyrogen-free Pyrex screw cap tube, then presoaked in 40 mL of a pyrogen-free milli-Q water for 10 min, and then vortexed for 1 min. Subsequently, filters were sonicated and then washed in a rotator for 1 h, respectively. The milli-Q water extract was transferred to a 40 mL pyrogen-free Pyrex screw cap tube and stored in a refrigerator. Next, each filter was extracted (following a similar procedure as described above) in 40 mL of acetone. After transferring the acetone extract to a secondary container, the final extraction was performed using hexane. The filter was removed and stored in a chemical hood for 12 h to evaporate residual solvent. Each filter was desiccated, equilibrated for 24 h, and then postweighed to the nearest milligram.
The hexane and acetone extracts from each sample were combined in the original extraction tube and evaporated using a nitrogen blowdown manifold. Subsequently, milli-Q water extracts were transferred back to the original tube, frozen to −80 °C, and lyophilized at 0.1 mbar pressure and −40 °C using a Labconoco Freezone 4.5 Liter Benchtop Freeze-Dry System (Fort Scott, KS). Extracts were stored at −80 °C until reconstitution.
Microbial Community Chemical Markers
Three different aliquots from a subset of six IESL v2 samples (i.e., 24 size-fractionated sample extracts representing each dairy) were assigned for separate analysis of biologically active endotoxin, total endotoxin (3-hydroxy fatty acids; 3-OHFA), and muramic acid. Briefly, three individual replicates of 100 μL were analyzed for biologically active endotoxin using Pyrogene Recombinant Factor C (rFC) Assay kits (Cambrex, East Rutherford, NJ) as previously described.(55) Similar to Poole et al. (2010), 3-OHFA and muramic acid were measured in the remaining two individual aliquots of 1.5 mL. Each aliquot was lyophilized, digested, derivatized, and separately analyzed using a Waters Quattro Micro GC-MS/MS. Reagent and solvent blanks were included in each analysis and served as reference and control for background contamination.
DNA Sequencing
High-throughput DNA sequencing was conducted on a subset of six IESL v2 samples (i.e., 24 size-fractionated samples) representing each dairy. Bacterial genomic DNA was extracted using the PowerSoil DNA Isolation Kit (MO BIO). The V4 region of the 16S rRNA gene (515F-806R) was amplified with region-specific primers according to protocols published by the Earth Microbiome Project (www.earthmicrobiome.org).(56) Amplification was completed utilizing a barcoded primer set adapted for MiSeq by adding nine extra bases in the adapter region of the forward amplification primer that support paired-end sequencing.(57) The reverse amplification primer also contained a 12-base barcode sequence that supports pooling of up to 2,167 different samples in each lane. Each 25 μL PCR reaction contained 12 μL of MoBio PCR Water (Certified DNA-free), 10 μL of 5 Prime HotMasterMix (1×), 1 μL of Forward Primer (5 μM concentration, 200 pM final), 1 μL of Golay Barcode Tagged Reverse Primer (5 μM concentration, 200 pM final), and 1 μL of genomic DNA. The PCR conditions were as follows: 94 °C for 3 min to denature the DNA, with 35 cycles at 94 °C for 45 s, 50 °C for 60 s, and 72 °C for 90 s, with a final extension of 10 min at 72 °C to ensure complete amplification. Following PCR, amplicons were quantified using PicoGreen (Invitrogen) and a plate reader. Once quantified, different volumes of each of the products were pooled into a single tube so that each amplicon was represented equally. This pool was then cleaned using the UltraClean PCR Clean-Up Kit (MoBio) and quantified using Qubit (Invitrogen). After quantification, the molarity of the pool was determined and diluted to 2 nM, denatured, and then diluted to a final concentration of 6.75 pM with a 10% PhiX spike for loading on the Illumina MiSeq sequencer.
Single Particle Analysis and Elemental Composition
During a selected sampling day, the top three stages of the IESL v2 were loaded with 200-mesh transmission electron microscopy grids (Ted Pella, Inc., Redding, CA) and operated for 30 min. Afterward, each grid was transported back to the lab and mounted on a 10 mm JEOL aluminum specimen stub (Ted Pella, Inc., Redding, CA) using double coated, carbon conductive tape. A 10 mm punch was taken from the center of the Zefluor PTFE afterfilter and mounted on a JEOL stub. All samples were sputter coated with a thin layer of carbon prior to analysis.
Scanning electron microscopy (SEM) was performed using a field emission system (JEOL model JSM-6500F, Peabody, MA) coupled with energy dispersive spectroscopy (EDS). Sufficient resolution was achieved at a working distance of 10 mm and an accelerating voltage between 10 and 15 kV. Elemental identification, relative abundances, and X-ray mapping were acquired using point and shoot and spectral imaging acquisition modes. The high background of fluorine atoms from the PTFE filter precluded elemental resolution of PM < 3; results from only the larger three size fractions are reported.
Statistical Analysis
Descriptive and Spearman Rank Correlation
Data were normalized to the amount of air sampled at each campaign and reported in units of mass per cubic meter of air. Descriptive statistics of mass concentrations and bacterial loadings are presented as the geometric mean (GM) and geometric standard deviation (GSD). Correlations between total mass concentration of the IESL v2 inhalable fraction and EU, 3-OHFA, and muramic acid were calculated from Spearman rank correlation coefficients (ρ). Due to the non-normal distribution of the data, we used Kruskal–Wallis tests to detect differences in median EU, 3-OHFA, and muramic acid mass as a function of PM size. The Dwass, Steel, Crichtow-Fligner Method was used to conduct pairwise comparisons of median values by size. Using the same statistical approach, we investigated seasonal differences for mass concentration and each bacterial marker. These analyses were performed using SAS version 9.3 (SAS Institute Inc., Cary, NC).
Bioinformatics
Ribonucleic acid sequences were quality filtered and assigned to corresponding samples based on their 12-bp error-correcting Golay barcodes. Operational taxonomic units (OTUs) were assigned taxonomy by clustering sequences against 97% OTU reference data from the Greengenes database(58) using UCLUST.(59) Diversity metrics were calculated using both OTU- and phylogeny-based methods. Within-sample diversity (alpha diversity) was evaluated using rarefaction, sample richness, and Faith’s phylogenetic distance. Similarity between communities was compared using FastUnifrac, which uses the Greengenes 97% OTU phylogenetic tree as a reference to calculate phylogenetic distances.(60) The unweighted and weighted Unifrac metrics were calculated to compare samples qualitatively (presence/absence only) and quantitatively (relative abundances of taxa included).(61) Taxonomic composition, heatmaps, and SourceTracker(62) were generated using Qiime v1.9.1 and R Programming Language v3.2.3.
Results and Discussion
The IESL v2 was deployed 12 times (four times at each dairy) between 2012 and 2014 producing a total of 48 size-fractionated dust samples. The median sampling time was 480 min (range: 375—594 min; Table 1). Sampling times varied depending on the work shift and delays in production. Some shifts were delayed due to mechanical issues or to the arrival of new cows that were not accustomed to the milking parlor. The IESL v2 was set up (and removed) during opportune times identified by dairy managers and workers inside the parlor. The average dust catch (i.e., the sum of all four IESL stages) as a geometric mean was 73 mg (GSD: 1.4), which translates to a geometric PM mass concentration of 108 μg m–3 (GSD: 1.3); these levels are similar to those for area samples reported by Reynolds et al. (2009) but lower than inhalable mass concentrations measured from personal breathing-zone samples among the workers.(21, 29) Fixed-site area measurements tend to be lower than personal exposures in occupational environments, given the close proximity of workers to potential emission sources (e.g., feed, bedding materials, and animals). Garcia et al. (2013) demonstrated that personal samples collected in dairy worker’s breathing zones were higher than area-based samples. There were no statistically significant (p = 0.66) differences in measured dust concentrations by season.
Particle Size Distributions and Chemical Markers of Microbial Enrichment
The size distribution of inhalable PM was consistently bimodal with one mode under 3 μm and a second mode above 30 μm (Figure 2a). This larger size mode persisted across different dairies, days, and seasons. This is a novel finding; no studies have described the presence (and composition) of particles larger than 20 μm in dairy environments, presumably due to a lack of sizing equipment. Further, the distribution of mass in this larger mode often rivaled or exceeded that of the smaller mode (Figure 2). A higher mass concentration was observed in the 10–30 μm size range at Dairies 1 and 3 and in the 30–100 μm size range at Dairy 2.
Figure 2.

Average size distributions of inhalable particles and their microbial enrichment: (a) total PM mass by gravimetry; (b) muramic acid and (c) 3-hydroxy fatty acids by mass spectroscopy; (d) endotoxin by recombinant factor c assay. Error bars represent standard deviations taken across independent sampling days. The y-axis represents the mass.
The concentration of bacterial chemical markers also varied by particle size (Figure 2b–d). Endotoxin and muramic acid were present in varying concentrations in both smaller and larger size fractions. The distribution of muramic acid and 3-OHFA was also bimodal; however, the mass contribution of 3-OHFA was at least an order of magnitude greater than muramic acid. On the contrary, biologically active endotoxin by size-fraction largely varied and followed a unimodal distribution. Correlations between total IESL v2 inhalable mass concentrations and the enrichment of biologically active endotoxin (ρ = 0.72, p < 0.0001), total endotoxin (ρ = 0.65, p < 0.0001), and muramic acid (ρ = 0.67, p < 0.0001) were strong and statistically significant (Table S1). Garcia et al. 2012 also observed a strong correlation (ρ = 0.79) between PM mass (collected by a personal inhalable sampler) and biologically active endotoxin. In this present study, no statistically significant differences were observed between endotoxin content and particle size (p = 0.16). Median mass concentrations of 3-OHFA and muramic acid differed significantly (p = 0.015) between 10 and 3 μm. The muramic acid data also suggested a difference in median concentrations between the 30 μm cut-point and the 3 μm cut-point (p = 0.063). There was no statistically significant difference in biologically active endotoxin (p = 0.58), 3-OHFA (p = 0.97), and muramic acid (p = 0.47) concentrations by season. These markers were not detected in the reagent or solvent blanks.
Together, these data suggest that risk assessment and emissions control efforts should consider a wider range of particle sizes, spanning the entire range of inhalable aerosol, given the concentrations and compositions of PM sizes reported here. The relative distribution of chemical markers was not significantly different between dairies (endotoxin: p = 0.14; muramic acid: p = 0.72; 3-OHFA: p = 0.95) suggesting that emissions/exposure reduction strategies could produce commensurate reductions in health hazards from one parlor design to the next (e.g., herringbone or rotary).
In the absence of a standard analytical procedure for analyzing endotoxin, we measured total (3-OHFAs) and biologically active endotoxin (lipid A) using GC-MS/MS and enzymatic assay methods, respectively. A common finding in the scientific literature is to measure the response of an enzyme to lipid A;(33) however, this may not accurately relate to dose if the analyte is bound to the cell. While more labor intensive and expensive, using GC-MS/MS allows resolution of specific 3-OHFAs present in the lipid A component. Knowing the richness and abundance of these fatty acids may provide better and more reliable estimates of exposure risk.(21) Burch et al. (2010) found that 3-OHFA to be a more sensitive indicator of nasal inflammation than lipid A among agricultural workers. This was evident by a strong association between 3-OHFA and inflammatory markers (e.g., polymorphonuclear neutrophils and interleukin 8) measured in nasal lavages. We evaluated the relationship between 3-OHFA and lipid A and observed a moderate correlation (ρ = 0.4; p = 0.055; Figure S3). Other researchers demonstrated various degrees of correlation between 3-OHFA and lipid A with statistical significance, in dairy and other livestock environments.(43, 55, 63) Reynolds et al. (2005) concluded that measuring 3-OHFA by GC-MS/MS provides better resolution of the chemical composition of bacteria-specific endotoxin, especially if more endotoxin is cell-bound, than the biological assay. Without a priori knowledge of the proportion of cell-free to cell-bound endotoxin, both markers in tandem remain useful, especially until international consensus on sampling and analyzing airborne endotoxin is established.
The presence of muramic acid, an inflammatory component of primarily Gram-positive bacteria, suggests that diverse bacterial species are present in dairy PM.(44, 48) Poole et al. (2010) suggested that muramic acid in dairy PM promotes inflammatory responses by human monocytes and bronchial epithelial cells independently of endotoxin. This marker is relatively unexplored as it relates to human health outcomes. Recently, Nonnenmann et al. (2017) found no associations between exposures to muramic acid and changes in exhaled nitric oxide, a marker of pulmonary inflammation, among workers inside dairy parlors.(64) Given the cross-sectional design of this study, unanswered questions remain regarding the role of muramic acid in agricultural lung disease.
DNA Sequencing of Size-Segregated Dairy Aerosol
Amplicon sequencing of the 16S rRNA V4 region was conducted to characterize the microbial community structure in collected bioaerosol samples. A total of 1,878 distinct operational taxonomic units (OTUs) were identified (using a threshold of 97% identity of sequence similarity) across all samples, with an average depth of 1,300 sequencing reads per sample. All sequences associated with reagents and DNA extraction were removed from the sample data set.
We used SourceTracker, a Bayesian statistical approach, to identify potential sources of these bacterial OTUs (Figure 3a). Measured OTUs were derived predominantly from animal feces (greater than 75%), which is consistent with high-density livestock operations. However, other animal sources, such as bird and human sources, were also detected, in addition to typical soil and waterborne taxa (Figure 3a). All the dairies contained bathrooms near each operator pit. Consequently, markers of human feces in bioaerosols were observed, most notably in the parlor using a rotary milking system. This is a concern as previous studies have suggested that substantial atmospheric loading of potentially infectious agents occurs when toilets are flushed.(65)
Figure 3.
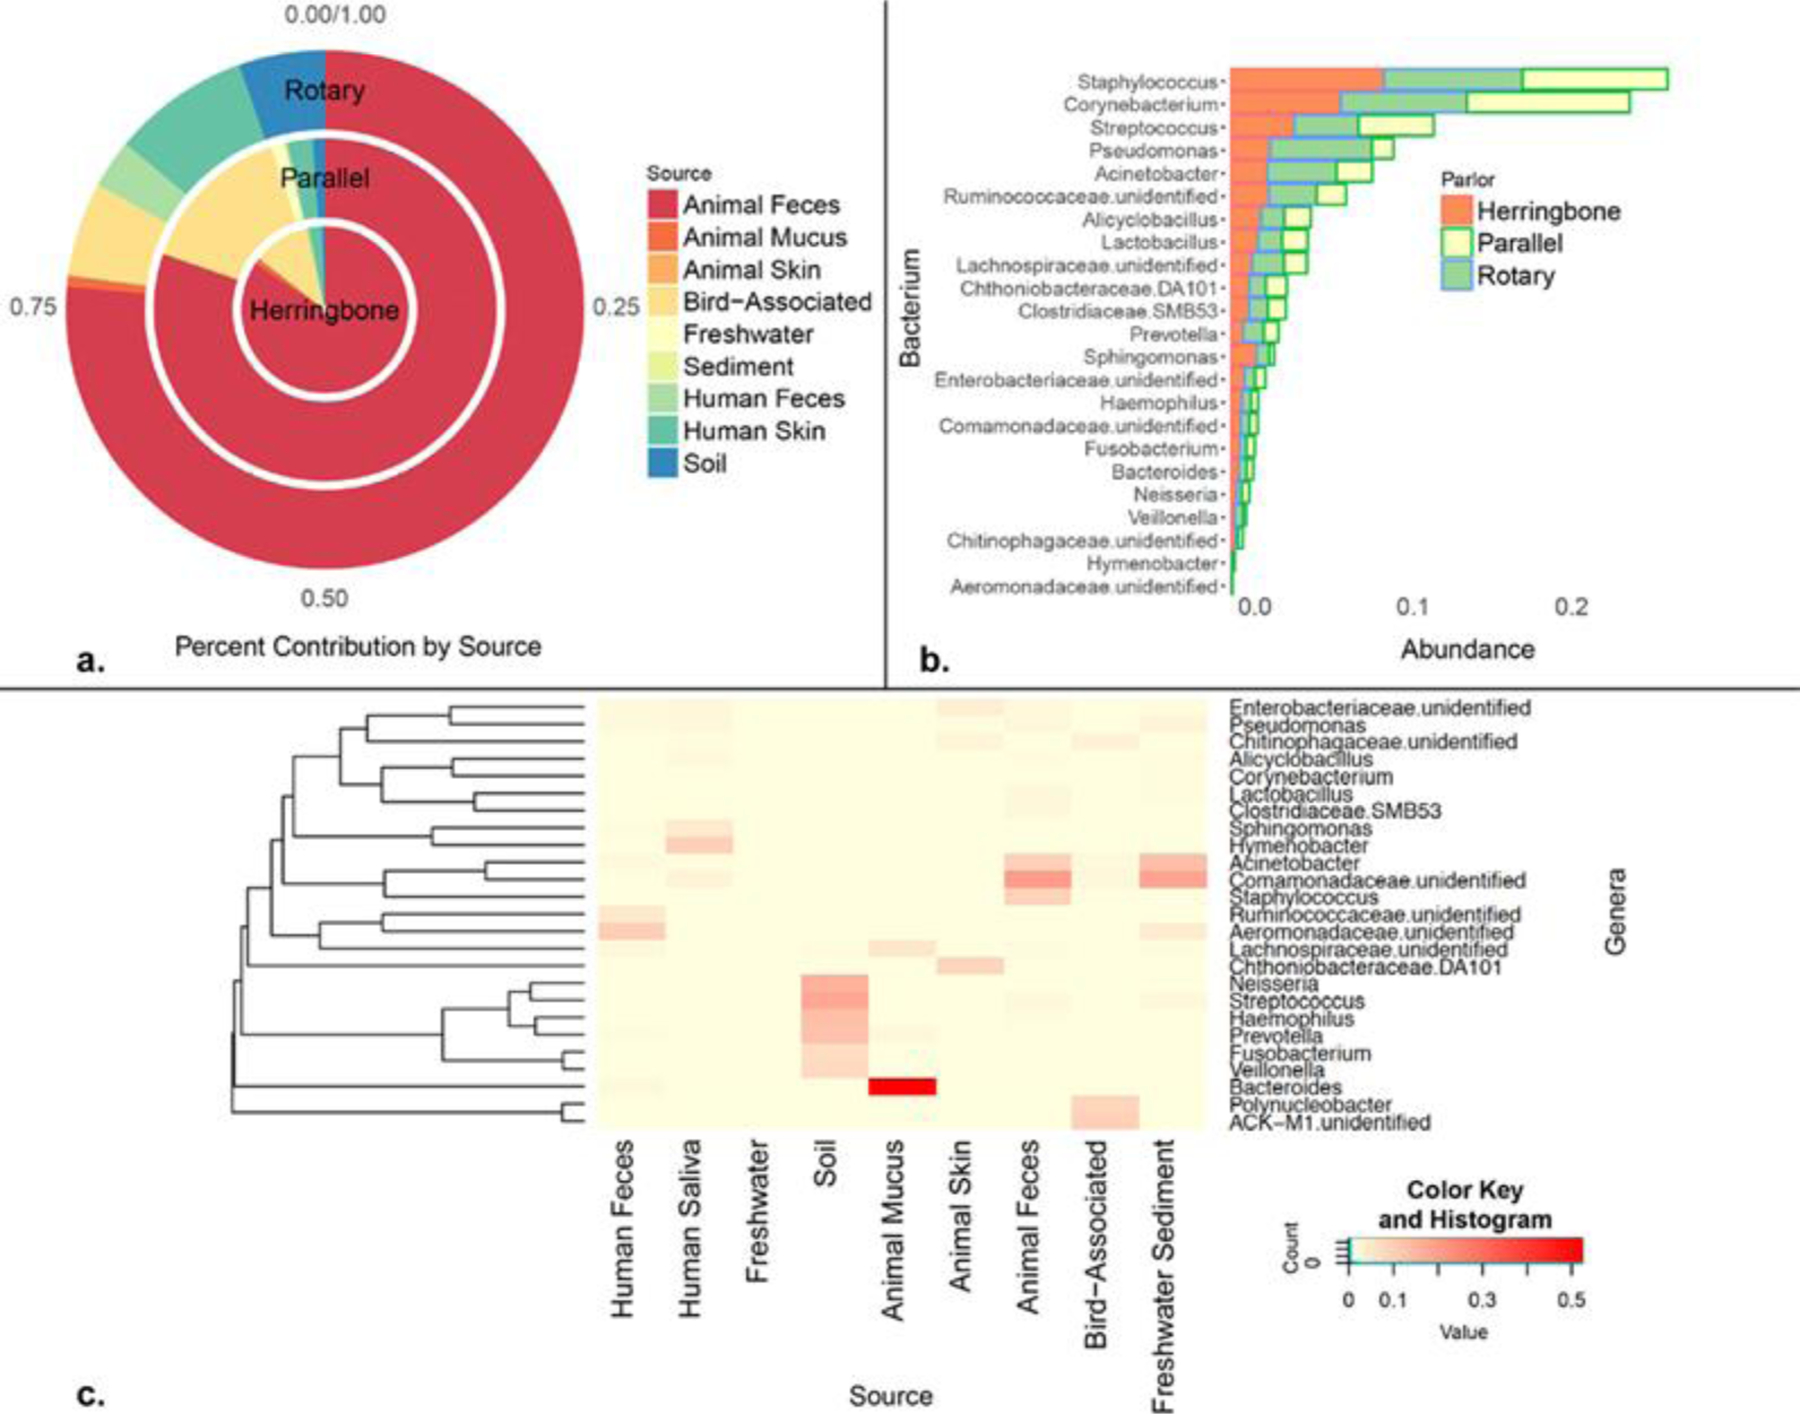
Type and source attribution of common bacterial aerosols from dairy milk parlors: (a) bacteria were traced largely to animal feces, as well as bird and human-associated sources; (b) relative bacterial abundance was comparable across different parlor types with Staphylococcus, Streptococcus, and Pseudomonas as the predominant genera; (c) heat map showing unique fingerprints of bacteria were identified by source including known pathogens with potential for antibiotic-resistance. The color key and histogram represent the distribution of the relative abundance (via counts) of the OUT at the genus level. Each square is proportional to the counts of operational taxonomic units (normalized to an even sequencing depth). The taxa shown in this plot were associated with varying degrees of counts. The color yellow represents low abundant taxa, while dominant taxa are shown in red.
Similar trends in relative bacterial abundance were observed between dairies, regardless of parlor design (i.e., rotary, parallel, and herringbone; Figure 3b) or USDA certification status. Gram-positive bacteria were prevalent, specifically Staphylococcus (8.1%), Corynebacterium (8.5%), and Streptococcus (3.8%). Dairy cattle are principal reservoirs of Staphylococcus aureus, an opportunistic pathogen among humans that can rapidly evolve toward an antibiotic-resistant phenotype.(66, 67) Recently, nasal carriage of livestock-associated, antibiotic-resistant Staphylococcus aureus, which is distinct from hospital- and community-associated strains, was suggested to be a potential risk factor for skin and soft tissue infection.(68) Given the changing landscape of Staphylococcus aureus resistance,(69–72) our results suggest that these larger particles (that we typically do not measure) are an important source of exposure to opportunistic pathogens among workers (who may transport these species offsite) and nearby residents. This further substantiates the concern that nasal colonization and/or skin infection by these pathogens is a public health concern worthy of additional investigation.
Bacterial source profiles are presented in Figure 3c. Bacteria commonly associated with mammalian gut microbiome were present (e.g., Acinetobacter) including unclassified genera associated with Ruminococcaceae, Lachnospiraceae, and Enterobacteriaceae.(73) Staphylococcus was one of the most abundant taxa (at the genus level) relative to other potential organisms (excluding Comamonadaceae) originating most likely from animal feces. Pseudomonas and Bacteroides were also present in collected bioaerosols. These genera contain species that are linked to increased morbidity and mortality based on virulence factors and mediation of drug resistance.(74–78)
The relative contribution of bacteria was comparable across all four size-fractions (Figure 4) with a few exceptions. Pseudomonas and Sphingomonas were highest in the 10 μm fraction. Collectively, these results suggest that the airborne PM microbiome extends well into the inhalable range (up to 100 μm in aerodynamic diameter). Above 30 μm, inhaled particles deposit primarily in the upper respiratory tract, where they reside or become eventually swallowed. As such, infections in the nasal passage and gut (via mucociliary clearance) are possible based on bacterial constitution of bioaerosols observed in this study. Further, Pseudomonas, Streptococcus, Prevotella, Fusobacterium, Haemophilus, Veillonella, and Porphyromonas were observed in this study, which may play an important role in the lung microbiome.(79) Pseudomonas has also been linked to asthma in deep lung tissue studies.(80)
Figure 4.

Heat map of the abundance of the top 25 OTUs differentiating bacterial enrichment by aerodynamic diameter of inhalable bioaerosols. For this analysis, one set of IESL v2 samples was analyzed to demonstrate that the bioaerosol microbiome spans the entire inhalable fraction. The color of each square is proportional to the counts of OTUs as stated in Figure 2.
Single Particle Analysis and Elemental Composition
A wide spectrum of particle morphologies ranging from round to amorphic was observed in each size range under SEM (examples are shown in Figure 5A–C). Particle topographies were heterogeneous, including surfaces that were flat and smooth as well as folded and rough. Particles predominantly contained magnesium, aluminum, silicon, and calcium (Figure 5A–C), which were most likely in the oxide form (e.g., silica). Trace elements such as titanium, iron, sodium, potassium, and sulfur were also observed (data not shown). Cambra-López et al. (2011) identified similar elements in a source apportionment study of particulate matter from poultry and swine housing-systems in The Netherlands. Previous research has demonstrated that agricultural workers, in general, are exposed to high levels of silica (e.g., greater than 0.1 mg m–3).(81, 82) In dairies, sand is frequently used in animal bedding, which has been shown to reduce Gram-negative bacteria.(83) However, sand remains a potential inhalation hazard due to its silica content. In light of the new silica rule enforced by Occupational Safety and Health Administration (0.05 mg m–3),(84) quantitative exposure assessments of silica and other potentially harmful inorganic hazards are essential for protecting dairy workers against occupational lung diseases (e.g., silicosis).
Figure 5.

Magnesium (Mg), aluminum (Al), silicon (Si), and calcium (Ca) were identified by single-particle analysis using SEM-EDS. Elemental maps of single particles illustrate the presence of these chemical elements based on color density: (A) PM30–100; (B) PM10–30; and (C) PM03–10. An elemental map is not shown for particles smaller than 3 μm due to strong background signals of fluorine from the PTFE afterfilter.
Implications for Exposure and Health
Inhalable particulate matter from Colorado dairies is a complex mixture of organic and inorganic components with high inflammatory potential. This is the first study to characterize the full size distribution of airborne particles emitted by agricultural dairy operations, specifically inside the milking parlor. Our results suggest that both size-fractions of aerosols in these dairies are likely generated by common sources based on the strong correlation between markers. These sources may include, but are not limited to, resuspension events such as flushing the parlor and moving animals, which may account for the bimodal distribution of the particles evaluated in this study. Based on various factors (e.g., particle size, and prevailing wind patterns), agricultural bioaerosols have been demonstrated to travel long distances (up to 5 km).(9, 13) Although large particles settle quickly in quiescent air, atmospheric transport of PM10 has been suggested to extend up to several kilometers downwind.(12) A linear relationship between wind speed and transport distance has been widely recognized for atmospheric dust.(85, 86) Dust storms can transport large particles (>20 μm) hundreds (to potentially thousands) of kilometers.(87) Hence, these larger particles can potentially impact the health of residents in surrounding (downwind) communities. Alternatively, dust from upwind sources (e.g., other livestock operations or anthropogenic activities) may be a concern to the dairy microenvironment, including animal health. This present study warrants further modeling of bioaerosol dispersion and deposition for particles extending up to 100 μm in aerodynamic diameter.
A limitation of this work is that DNA sequencing does not distinguish viable from nonviable bacteria. This distinction is important, but the inherent challenges associated with determining the concentration of viable bacteria in bioaerosols made this effort beyond the scope of the present study. Bacteria experience considerable stress related to mechanical and nonmechanical forces during air sampling, which can render them nonviable.(88, 89) For example, the shear force from sample aspiration and/or impaction may rupture the bacterial cell;(90) desiccation may also damage the cell and reduce viability.(88) Hence, collection into a liquid media and shorter sample times are typically recommended. Further, less than 1% of all bacteria are culturable in the laboratory.(91, 92) Culture-based techniques are selective for certain bacteria and, in turn, bias the results.(93) In view of all this, abundance and diversity of viable bacteria are underestimated at a concerning magnitude. Irrespective of these challenges, isolating viable bacteria remains an important practice that will be essential in our future bioaerosol exposure assessments, in particular phenotypic characterizations, single genome sequencing, and strain identification. Although field blanks were not collected (only one IESL v2 impactor exists), we employed a thorough washing procedure (70% ethanol and 10% bleach solutions) between sampling campaigns and tested our sampling surfaces using laboratory (and reagent) blanks. Our signal-to-laboratory blank values were separated by orders of magnitude, given that each stage collected tens of milligrams of organic dust mass.
Previous research on agricultural aerosol has focused primarily on PM2.5 and respirable size fractions (particles less than 4 μm in aerodynamic diameter) under the assumption that pulmonary deposition is of greatest concern for assessing health risks. In the present study, we demonstrate that a substantial (and oftentimes a majority) proportion of particulate mass is present in larger size ranges – spanning 10–100 μm in aerodynamic diameter. These larger particles tend to deposit in the upper respiratory system, including the nasopharyngeal region. Consequently, nasal colonization by pathogenic species is possible, resulting in localized and systemic effects.(71, 72, 94–98) This finding is of particular public health relevance, especially in the context of facilitated transmission of potentual zoonotic pathogens into the community.
With a paucity of literature regarding large particles and attendant health effects, our results have important implications for occupational, environmental, and public health. The current scientific opinion suggests that bioaerosol exposure confers protection against asthma and atopy in children.(20, 99, 100) However, several unanswered questions remain regarding spatiotemporal dynamics of exposure, gene-environment interactions, and the health continuum of these populations. Also importantly, protections require exposure in infancy, and children or adults who are not exposed often have exaccerbation of their airway disease by later exposure.(99) More research (particularly microbiome studies) is needed in this area of large particle exposure health outcomes to comprehensively address inhalable PM exposures, differentiate between protective and adverse effects, develop interventions and controls, and improve the health of dairy workers.
Supplementary Material
ACKNOWLEDGMENTS
The authors would like to thank Dr. Jeff Collett for graciously providing the IESL instrument. We would like to extend our appreciation to Drs. Margaret Davidson and Christian L’Orange, John Mehaffy, and Ben Reynolds for their contributions to the IESL v2 redesign; Mary Bradford, Laura Krause, Bevin Luna, and Jessina Tryon for their assistance in sample collection and analysis; and Drs. Gregory Dooley and Patrick McCurdy at the CSU Center for Environmental Medicine and the Central Instrument Facility for their help with GC-MS/MS and SEM/EDS analysis. The authors also thankfully acknowledge Mr. Karam Ahmad for his time and help with graphic designs. Finally, this research would not be possible without the outstanding support, interest, and commitment towards healthy environments that has been demonstrated by the dairy producers in the High Plains and Rocky Mountain region. This research was supported by the CDC/NIOSH High Plains Intermountain Center for Agricultural Health and Safety (2U54OH008085) and the CDC/ NIOSH Mountain and Plains Education and Research Center (T42OH009229-07).
REFERENCES
- (1).Douphrate DI; Hagevoort GR; Nonnenmann MW; Lunner Kolstrup C; Reynolds SJ; Jakob M; Kinsel M The Dairy Industry: A Brief Description of Production Practices, Trends, and Farm Characteristics around the World. Journal of Agromedicine 2013, 18 (3), 187–197. [DOI] [PubMed] [Google Scholar]
- (2).Heederik D; Sigsgaard T; Thorne PS; Kline JN; Avery R; Bønløkke JH; Chrischilles EA; Dosman JA; Duchaine C; Kirkhorn SR; Kulhankova K; Merchant JA Health Effects of Airborne Exposures from Concentrated Animal Feeding Operations. Environ. Health Perspect 2007, 115 (2), 298–302. [DOI] [PMC free article] [PubMed] [Google Scholar]
- (3).Pruden A; Pei R; Storteboom H; Carlson KH Antibiotic Resistance Genes as Emerging Contaminants: Studies in Northern Colorado. Environ. Sci. Technol 2006, 40 (23), 7445–50. [DOI] [PubMed] [Google Scholar]
- (4).Merchant J; Coussens C; Gilbert D In Rebuilding the Unity of Health and the Environment in Rural America; Workshop Summary, The National Academies Press: Washington, DC, 2006; DOI: 10.17226/11596. Environmental Science & Technology Article DOI: Environ. Sci. Technol. 2017, 51, 6430–6440 [DOI] [PubMed] [Google Scholar]
- (5).Mitloehner FM; Schenker MB Environmental Exposure and Health Effects from Concentrated Animal Feeding Operations. Epidemiology 2007, 18 (3), 309–11. [DOI] [PubMed] [Google Scholar]
- (6).Schinasi L; Horton RA; Guidry VT; Wing S; Marshall SW; Morland KB Air Pollution, Lung Function, and Physical Symptoms in Communities near Concentrated Swine Feeding Operations. Epidemiology 2011, 22 (2), 208–15. [DOI] [PMC free article] [PubMed] [Google Scholar]
- (7).Carrel M; Schweizer ML; Sarrazin MV; Smith TC; Perencevich EN Residential Proximity to Large Numbers of Swine in Feeding Operations Is Associated with Increased Risk of Methicillin-Resistant Staphylococcus Aureus Colonization at Time of Hospital Admission in Rural Iowa Veterans. Infect. Control Hosp. Epidemiol 2014, 35 (2), 190–3. [DOI] [PubMed] [Google Scholar]
- (8).Wing S; Horton RA; Rose KM Air Pollution from Industrial Swine Operations and Blood Pressure of Neighboring Residents. Environ. Health Perspect 2013, 121 (1), 92–6. [DOI] [PMC free article] [PubMed] [Google Scholar]
- (9).McEachran AD; Blackwell BR; Hanson JD; Wooten KJ; Mayer GD; Cox SB; Smith PN Antibiotics, Bacteria, and Antibiotic Resistance Genes: Aerial Transport from Cattle Feed Yards Via Particulate Matter. Environ. Health Perspect 2015, 123 (4), 337–43. [DOI] [PMC free article] [PubMed] [Google Scholar]
- (10).Jahne MA; Rogers SW; Holsen TM; Grimberg SJ; Ramler IP Emission and Dispersion of Bioaerosols from Dairy Manure Application Sites: Human Health Risk Assessment. Environ. Sci. Technol 2015, 49 (16), 9842–9849. [DOI] [PubMed] [Google Scholar]
- (11).Bonifacio HF; Maghirang RG; Auvermann BW; Razote EB; Murphy JP; Harner JP 3rd Particulate Matter Emission Rates from Beef Cattle Feedlots in Kansas-Reverse Dispersion Modeling. J. Air Waste Manage. Assoc 2012, 62 (3), 350–61. [DOI] [PubMed] [Google Scholar]
- (12).Hiranuma N; Brooks SD; Gramann J; Auvermann BW High Concentrations of Coarse Particles Emitted from a Cattle Feeding Operation. Atmos. Chem. Phys 2011, 11 (16), 8809–8823. [Google Scholar]
- (13).Williams DAL; Breysse PN; McCormack MC; Diette GB; McKenzie S; Geyh AS Airborne Cow Allergen, Ammonia and Particulate Matter at Homes Vary with Distance to Industrial Scale Dairy Operations: An Exposure Assessment. Environ. Health 2011, 10 (1), 72. [DOI] [PMC free article] [PubMed] [Google Scholar]
- (14).Borlée F; Yzermans CJ; van Dijk CE; Heederik D; Smit LAM Increased Respiratory Symptoms in Copd Patients Living in the Vicinity of Livestock Farms. Eur. Respir. J 2015, 46 (6), 1605–14. [DOI] [PubMed] [Google Scholar]
- (15).Radon K; Schulze A; Ehrenstein V; van Strien RT; Praml G; Nowak D Environmental Exposure to Confined Animal Feeding Operations and Respiratory Health of Neighboring Residents. Epidemiology 2007, 18 (3), 300–308. [DOI] [PubMed] [Google Scholar]
- (16).Wilson SM; Serre ML Examination of Atmospheric Ammonia Levels near Hog Cafos, Homes, and Schools in Eastern North Carolina. Atmos. Environ 2007, 41 (23), 4977–4987. [Google Scholar]
- (17).Nazaroff WW Indoor Bioaerosol Dynamics. Indoor Air 2016, 26 (1), 61–78. [DOI] [PMC free article] [PubMed] [Google Scholar]
- (18).Blais-Lecours P; Perrott P; Duchaine C Non-Culturable Bioaerosols in Indoor Settings: Impact on Health and Molecular Approaches for Detection. Atmos. Environ 2015, 110, 45–53. [DOI] [PMC free article] [PubMed] [Google Scholar]
- (19).Reynolds SJ; Nonnenmann MW; Basinas I; Davidson M; Elfman L; Gordon J; Kirychuck S; Reed S; Schaeffer JW; Schenker MB; Schlunssen V; Sigsgaard T Systematic Review of Respiratory Health among Dairy Workers. Journal of Agromedicine 2013, 18 (3), 219–43. [DOI] [PubMed] [Google Scholar]
- (20).Douwes J; Thorne P; Pearce N; Heederik D Bioaerosol Health Effects and Exposure Assessment: Progress and Prospects. Ann. Occup. Hyg 2003, 47 (3), 187–200. [DOI] [PubMed] [Google Scholar]
- (21).Burch JB; Svendsen E; Siegel PD; Wagner SE; von Essen S; Keefe T; Mehaffy J; Martinez AS; Bradford M; Baker L; Cranmer B; Saito R; Tessari J; Linda P; Andersen C; Christensen O; Koehncke N; Reynolds SJ Endotoxin Exposure and Inflammation Markers among Agricultural Workers in Colorado and Nebraska. J. Toxicol. Environ. Health, Part A 2009, 73 (1), 5–22. [DOI] [PubMed] [Google Scholar]
- (22).Reynolds SJ; Clark ML; Koehncke N; von Essen S; Prinz L; Keefe TJ; Mehaffy J; Bradford M; Cranmer B; Davidson ME; Yang IV; Burch JB Pulmonary Function Reductions among Potentially Susceptible Subgroups of Agricultural Workers in Colorado and Nebraska. J. Occup. Environ. Med 2012, 54 (5), 632–641. [DOI] [PubMed] [Google Scholar]
- (23).2012 Census of Agriculture: United States Summary and State Data; USDA National Agriculture Statistics Service: Vol. 1 http://www.agcensus.usda.gov/Publications/2012/Full_Report/Volume_1,_Chapter_1_US/usv1.pdf (accessed 05 May 2017).
- (24).FAO Status and Prospects for Smallholder Milk Production - a Global Perspective; Hemme T; Otté J, Eds.; 2010.
- (25).Cambra-López M; Torres AG; Aarnink AJA; Ognik NWM Source Analysis of Fine and Coarse Particulate Matter from Livestock Houses. Atmos. Environ 2011, 45, 694–707. [Google Scholar]
- (26).Cambra-Lopez M; Aarnink AJ; Zhao Y; Calvet S; Torres AG Airborne Particulate Matter from Livestock Production Systems: A Review of an Air Pollution Problem. Environ. Pollut 2010, 158 (1), 1–17. [DOI] [PubMed] [Google Scholar]
- (27).Cambra-López M; Hermosilla T; Aarnink AJA; Ogink NWM A Methodology to Select Particle Morpho-Chemical Characteristics to Use in Source Apportionment of Particulate Matter from Livestock Houses. Computers and Electronics in Agriculture 2012, 81 (0), 14–23. [Google Scholar]
- (28).Lee S-A; Adhikari A; Grinshpun SA; McKay R; Shukla R; Reponen T Personal Exposure to Airborne Dust and Microorganisms in Agricultural Environments. J. Occup. Environ. Hyg 2006, 3 (3), 118–130. [DOI] [PubMed] [Google Scholar]
- (29).Garcia J; Bennett DH; Tancredi D; Schenker MB; Mitchell D; Reynolds SJ; Mitloehner FM Occupational Exposure to Particulate Matter and Endotoxin for California Dairy Workers. Int. J. Hyg. Environ. Health 2013, 216 (1), 56–62. [DOI] [PubMed] [Google Scholar]
- (30).Garcia J; Bennett DH; Tancredi DJ; Schenker MB; Mitchell DC; Reynolds SJ; Silva R; Dooley GP; Mehaffy J; Mitloehner FM Characterization of Endotoxin Collected on California Dairies Using Personal and Area-Based Sampling Methods. J. Occup. Environ. Hyg 2012, 9 (10), 580–91. [DOI] [PubMed] [Google Scholar]
- (31).Kirychuk SP; Reynolds SJ; Koehncke NK; Lawson J; Willson P; Senthilselvan A; Marciniuk D; Classen HL; Crowe T; Just N; Schneberger D; Dosman JA Endotoxin and Dust at Respirable and Nonrespirable Particle Sizes Are Not Consistent between Cage- and Floor-Housed Poultry Operations. Ann. Occup. Hyg 2010, 54 (7), 824–32. [DOI] [PubMed] [Google Scholar]
- (32).Nieuwenhuijsen MJ; Noderer KS; Schenker MB; Vallyathan V; Olenchock S Personal Exposure to Dust, Endotoxin and Crystalline Silica in California Agriculture. Ann. Occup. Hyg 1999, 43 (1), 35–42. [PubMed] [Google Scholar]
- (33).Duquenne P; Marchand G; Duchaine C Measurement of Endotoxins in Bioaerosols at Workplace: A Critical Review of Literature and a Standardization Issue. Ann. Occup. Hyg 2013, 57 (2), 137–72. [DOI] [PubMed] [Google Scholar]
- (34).Basinas I; Sigsgaard T; Erlandsen M; Andersen NT; Takai H; Heederik D; Omland O; Kromhout H; Schlunssen V Exposure-Affecting Factors of Dairy Farmers’ Exposure to Inhalable Dust and Endotoxin. Ann. Occup. Hyg 2014, 58 (6), 707–23. [DOI] [PubMed] [Google Scholar]
- (35).Samadi S; van Eerdenburg FJ; Jamshidifard AR; Otten GP; Droppert M; Heederik DJ; Wouters IM The Influence of Bedding Materials on Bio-Aerosol Exposure in Dairy Barns. J. Exposure Sci. Environ. Epidemiol 2012, 22 (4), 361–8. [DOI] [PubMed] [Google Scholar]
- (36).Skogstad A; Madso L; Eduard W Classification of Particles from the Farm Environment by Automated Sizing, Counting and Chemical Characterisation with Scanning Electron Microscopy-Energy Dispersive Spectroscopy. J. Environ. Monit 1999, 1 (4), 379–82. [DOI] [PubMed] [Google Scholar]
- (37).Kullman GJ; Thorne PS; Waldron PF; Marx JJ; Ault B; Lewis DM; Siegel PD; Olenchock SA; Merchant JA Organic Dust Exposures from Work in Dairy Barns. Am. Ind. Hyg. Assoc. J 1998, 59 (6), 403–13. [DOI] [PubMed] [Google Scholar]
- (38).Arteaga V; Mitchell D; Matt G; Quintana P; Schaeffer J; Reynolds S; Schenker M; Mitloehner F Occupational Exposure to Endotoxin in Pm2.5 and Pre- and Post-Shift Lung Function in California Dairy Workers. J. Environ. Prot 2015, 6 (5), 552–565. [Google Scholar]
- (39).Mueller-Anneling L; Avol E; Peters JM; Thorne PS Ambient Endotoxin Concentrations in Pm10 from Southern California. Environ. Health Perspect 2004, 112 (5), 583–588. [DOI] [PMC free article] [PubMed] [Google Scholar]
- (40).Shusterman D Occupational Irritant and Allergic Rhinitis. Curr. Allergy Asthma Rep 2014, 14 (4), 425. [DOI] [PubMed] [Google Scholar]
- (41).Moscato G; Siracusa A Rhinitis Guidelines and Implications for Occupational Rhinitis. Curr. Opin. Allergy Clin. Immunol 2009, 9 (2), 110–5. [DOI] [PubMed] [Google Scholar]
- (42).EAACI Task Force on Occupational Rhinitis; Moscato G; Vandenplas O; Gerth Van Wijk R; Malo JL; Quirce S; Walusiak J; Castano R; De Groot H; Folletti I; Gautrin D; Yacoub MR; Perfetti L; Siracusa A Occupational Rhinitis. Allergy 2008, 63 (8), 969–80. [DOI] [PubMed] [Google Scholar]
- (43).Garcia J; Bennett DH; Tancredi DJ; Schenker MB; Mitchell DC; Reynolds SJ; Silva R; Dooley GP; Mehaffy J; Mitloehner FM Characterization of Endotoxin Collected on California Dairies Using Personal and Area-Based Sampling Methods. J. Occup. Environ. Hyg 2012, 9 (10), 580–591. [DOI] [PubMed] [Google Scholar]
- (44).Poole JA; Dooley GP; Saito R; Burrell AM; Bailey KL; Romberger DJ; Mehaffy J; Reynolds SJ Muramic Acid, Endotoxin, 3-Hydroxy Fatty Acids, and Ergosterol Content Explain Monocyte and Epithelial Cell Inflammatory Responses to Agricultural Dusts. J. Toxicol. Environ. Health, Part A 2010, 73 (10), 684–700. [DOI] [PMC free article] [PubMed] [Google Scholar]
- (45).Hawley B; Schaeffer J; Poole JA; Dooley GP; Reynolds S; Volckens J Differential Response of Human Nasal and Bronchial Epithelial Cells Upon Exposure to Size-Fractionated Dairy Dust. J. Toxicol. Environ. Health, Part A 2015, 78 (9), 583–94. [DOI] [PMC free article] [PubMed] [Google Scholar]
- (46).Monso E; Riu E; Radon K; Magarolas R; Danuser B; Iversen M; Morera J; Nowak D Chronic Obstructive Pulmonary Disease in Never-Smoking Animal Farmers Working inside Confinement Buildings. Am. J. Ind. Med 2004, 46 (4), 357–62. [DOI] [PubMed] [Google Scholar]
- (47).Blais Lecours P; Duchaine C; Taillefer M; Tremblay C; Veillette M; Cormier Y; Marsolais D Immunogenic Properties of Archaeal Species Found in Bioaerosols. PLoS One 2011, 6 (8), e23326. [DOI] [PMC free article] [PubMed] [Google Scholar]
- (48).Poole JA; Romberger DJ Immunological and Inflammatory Responses to Organic Dust in Agriculture. Curr. Opin. Allergy Clin. Immunol 2012, 12 (2), 126–132. [DOI] [PMC free article] [PubMed] [Google Scholar]
- (49).Collett J Jr.; Iovinelli R; Demoz B A Three-Stage Cloud Impactor for Size-Resolved Measurement of Cloud Drop Chemistry. Atmos. Environ 1995, 29 (10), 1145–1154. [Google Scholar]
- (50).Douphrate DI; Lunner Kolstrup C; Nonnenmann MW; Jakob M; Pinzke S Ergonomics in Modern Dairy Practice: A Review of Current Issues and Research Needs. Journal of Agromedicine 2013, 18 (3), 198–209. [DOI] [PubMed] [Google Scholar]
- (51).Douphrate DI; Nonnenmann MW; Rosecrance JC Ergonomics in Industrialized Dairy Operations. Journal of Agromedicine 2009, 14 (4), 406–412. [DOI] [PubMed] [Google Scholar]
- (52).Douphrate DI; Fethke NB; Nonnenmann MW; Rodriguez A; Hagevoort R; Gimeno Ruiz de Porras D Full-Shift and Task-Specific Upper Extremity Muscle Activity among Us LargeHerd Dairy Parlour Workers. Ergonomics 2016,1–13. [DOI] [PMC free article] [PubMed] [Google Scholar]
- (53).Reynolds SJ; Milton DK; Heederik D; Thorne PS; Donham KJ; Croteau EA; Kelly KM; Douwes J; Lewis D; Whitmer M; Connaughton I; Koch S; Malmberg P; Larsson BM; Deddens J; Saraf A; Larsson L Interlaboratory Evaluation of Endotoxin Analyses in Agricultural Dusts - Comparison of Lal Assay and Mass Spectrometry. J. Environ. Monit 2005, 7 (12), 1371–1377. [DOI] [PubMed] [Google Scholar]
- (54).Bein KJ; Wexler AS A High-Efficiency, Low-Bias Method for Extracting Particulate Matter from Filter and Impactor Substrates. Atmos. Environ 2014, 90, 87–95. [Google Scholar]
- (55).Saito R; Cranmer BK; Tessari JD; Larsson L; Mehaffy JM; Keefe TJ; Reynolds SJ Recombinant Factor C (Rfc) Assay and Gas Chromatography/Mass Spectrometry (Gc/Ms) Analysis of Endotoxin Variability in Four Agricultural Dusts. Ann. Occup. Hyg 2009, 53 (7), 713–22. [DOI] [PubMed] [Google Scholar]
- (56).Gilbert JA; Jansson JK; Knight R The Earth Microbiome Project: Successes and Aspirations. BMC Biol 2014, 12, 69. [DOI] [PMC free article] [PubMed] [Google Scholar]
- (57).Caporaso JG; Lauber CL; Walters WA; Berg-lyons D; Huntley J; Fierer N Ultra-High-Throughput Microbial Community Analysis on the Illumina Hiseq and Miseq Platforms. ISME J 2012, 6, 1621–4. [DOI] [PMC free article] [PubMed] [Google Scholar]
- (58).McDonald D; Price MN; Goodrich J; Nawrocki EP; DeSantis TZ; Probst A; Andersen GL; Knight R; Hugenholtz P An Improved Greengenes Taxonomy with Explicit Ranks for Ecological and Evolutionary Analyses of Bacteria and Archaea. ISME J 2012, 6 (3), 610–618. [DOI] [PMC free article] [PubMed] [Google Scholar]
- (59).Edgar RC Search and Clustering Orders of Magnitude Faster Than Blast. Bioinformatics 2010, 26 (19), 2460–2461. [DOI] [PubMed] [Google Scholar]
- (60).Hamady M; Lozupone C; Knight R Fast Unifrac: Facilitating High-Throughput Phylogenetic Analyses of Microbial Communities Including Analysis of Pyrosequencing and Phylochip Data. ISME J 2010, 4 (1), 17–27. [DOI] [PMC free article] [PubMed] [Google Scholar]
- (61).Lozupone C; Lladser ME; Knights D; Stombaugh J; Knight R Unifrac: An Effective Distance Metric for Microbial Community Comparison. ISME J 2011, 5 (2), 169–172. [DOI] [PMC free article] [PubMed] [Google Scholar]
- (62).Knights D; Kuczynski J; Charlson ES; Zaneveld J; Mozer MC; Collman RG; Bushman FD; Knight R; Kelley ST Bayesian Community-Wide Culture-Independent Microbial Source Tracking. Nat. Methods 2011, 8 (9), 761–763. [DOI] [PMC free article] [PubMed] [Google Scholar]
- (63).Reynolds SJ; Milton DK; Heederik D; Thorne PS; Donham KJ; Croteau EA; Kelly KM; Douwes J; Lewis D; Whitmer M; Connaughton I; Koch S; Malmberg P; Larsson BM; Deddens J; Saraf A; Larsson L Interlaboratory Evaluation of Endotoxin Analyses in Agricultural Dusts–Comparison of Lal Assay and Mass Spectrometry. J. Environ. Monit 2005, 7 (12), 1371–7. [DOI] [PubMed] [Google Scholar]
- (64).Nonnenmann MW; Gimeno Ruiz de Porras D; Levin J; Douphrate D; Boggaram V; Schaffer J; Gallagher M; Hornick M; Reynolds S Pulmonary Function and Airway Inflammation among Dairy Parlor Workers after Exposure to Inhalable Aerosols. Am. J. Ind. Med 2017, 60 (3), 255–263. [DOI] [PMC free article] [PubMed] [Google Scholar]
- (65).Johnson DL; Mead KR; Lynch RA; Hirst DV L Lifting the Lid on Toilet Plume Aerosol: A Literature Review with Suggestions for Future Research. Am. J. Infect. Control 2013, 41 (3), 254–258. [DOI] [PMC free article] [PubMed] [Google Scholar]
- (66).Castillo Neyra R; Vegosen L; Davis MF; Price L; Silbergeld EK Antimicrobial-Resistant Bacteria: An Unrecognized Work-Related Risk in Food Animal Production. SH W 2012, 3 (2), 85–91. [DOI] [PMC free article] [PubMed] [Google Scholar]
- (67).Silbergeld EK; Graham J; Price LB Industrial Food Animal Production, Antimicrobial Resistance, and Human Health. Annu. Rev. Public Health 2008, 29 (1), 151–169. [DOI] [PubMed] [Google Scholar]
- (68).Nadimpalli M; Stewart JR; Pierce E; Pisanic N; Love DC; Hall D; Larsen J; Carroll KC; Tekle T; Perl TM; Heaney CD Livestock-Associated, Antibiotic-Resistant Staphylococcus Aureus Nasal Carriage and Recent Skin and Soft Tissue Infection among Industrial Hog Operation Workers. PLoS One 2016, 11 (11), e0165713. [DOI] [PMC free article] [PubMed] [Google Scholar]
- (69).Smith TC Livestock-Associated Staphylococcus Aureus: The United States Experience. PLoS Pathog 2015, 11 (2), e1004564. [DOI] [PMC free article] [PubMed] [Google Scholar]
- (70).Lowy F Staphylococcus Aureus Infection. N. Engl. J. Med 1998, 339, 520–532. [DOI] [PubMed] [Google Scholar]
- (71).Nadimpalli M; Rinsky JL; Wing S; Hall D; Stewart J; Larsen J; Nachman KE; Love DC; Pierce E; Pisanic N; Strelitz J; Harduar-Morano L; Heaney CD Persistence of LivestockAssociated Antibiotic-Resistant Staphylococcus Aureus among Industrial Hog Operation Workers in North Carolina over 14 Days. Occup. Environ. Med 2015, 72 (2), 90–9. [DOI] [PMC free article] [PubMed] [Google Scholar]
- (72).Rinsky JL; Nadimpalli M; Wing S; Hall D; Baron D; Price LB; Larsen J; Stegger M; Stewart J; Heaney CD Livestock-Associated Methicillin and Multidrug Resistant Staphylococcus Aureus Is Present among Industrial, Not Antibiotic-Free Livestock Operation Workers in North Carolina. PLoS One 2013, 8 (7), e67641. [DOI] [PMC free article] [PubMed] [Google Scholar]
- (73).Mao S; Zhang M; Liu J; Zhu W Characterising the Bacterial Microbiota across the Gastrointestinal Tracts of Dairy Cattle: Membership and Potential Function. Sci. Rep 2015, 5, 16116. [DOI] [PMC free article] [PubMed] [Google Scholar]
- (74).Pseudomonas aeruginosa in Healthcare Settings https://www.cdc.gov/hai/organisms/pseudomonas.html (accessed 05 May 2017).
- (75).Wexler HM Bacteroides: The Good, the Bad, and the NittyGritty. Clin. Microbiol. Rev 2007, 20 (4), 593–621. [DOI] [PMC free article] [PubMed] [Google Scholar]
- (76).Nathwani D; Raman G; Sulham K; Gavaghan M; Menon V Clinical and Economic Consequences of Hospital-Acquired Resistant and Multidrug-Resistant Pseudomonas Aeruginosa Infections: A Systematic Review and Meta-Analysis. Antimicrobial Resistance and Infection Control 2014, 3 (1), 32. [DOI] [PMC free article] [PubMed] [Google Scholar]
- (77).Obritsch MD; Fish DN; MacLaren R; Jung R Nosocomial Infections Due to Multidrug-Resistant Pseudomonas Aeruginosa: Epidemiology and Treatment Options. Pharmacotherapy 2005, 25 (10), 1353–64. [DOI] [PubMed] [Google Scholar]
- (78).van ‘t Wout EFA; van Schadewijk A; van Boxtel R; Dalton LE; Clarke HJ; Tommassen J; Marciniak SJ; Hiemstra PS Virulence Factors of Pseudomonas Aeruginosa Induce Both the Unfolded Protein and Integrated Stress Responses in Airway Epithelial Cells. PLoS Pathog 2015, 11 (6), e1004946. [DOI] [PMC free article] [PubMed] [Google Scholar]
- (79).Erb-Downward JR; Thompson DL; Han MK; Freeman CM; McCloskey L; Schmidt LA; Young VB; Toews GB; Curtis JL; Sundaram B; Martinez FJ; Huffnagle GB Analysis of the Lung Microbiome in the “Healthy” Smoker and in Copd. PLoS One 2011, 6 (2), e16384. [DOI] [PMC free article] [PubMed] [Google Scholar]
- (80).Denner DR; Sangwan N; Becker JB; Hogarth DK; Oldham J; Castillo J; Sperling AI; Solway J; Naureckas ET; Gilbert JA; White SR Corticosteroid Therapy and Airflow Obstruction Influence the Bronchial Microbiome, Which Is Distinct from That of Bronchoalveolar Lavage in Asthmatic Airways. J. Allergy Clin. Immunol 2016, 137 (5), 1398–1405 e3. [DOI] [PMC free article] [PubMed] [Google Scholar]
- (81).Schenker M Exposures and Health Effects from Inorganic Agricultural Dusts. Environ. Health Perspect 2000, 108 (Suppl 4), 661–664. [DOI] [PMC free article] [PubMed] [Google Scholar]
- (82).Schenker MB Inorganic Agricultural Dust Exposure Causes Pneumoconiosis among Farmworkers. Proc. Am. Thorac. Soc 2010, 7 (2), 107–110. [DOI] [PubMed] [Google Scholar]
- (83).Westphal A; Williams ML; Baysal-Gurel F; LeJeune JT; McSpadden Gardener BB General Suppression of Escherichia Coli O157:H7 in Sand-Based Dairy Livestock Bedding. Appl. Environ. Microbiol 2011, 77 (6), 2113–21. [DOI] [PMC free article] [PubMed] [Google Scholar]
- (84).Occupational Safety and Health Administration’s Final Rule to Protect Workers from Exposure to Respirable Crystalline Silica https://www.osha.gov/silica/ (accessed 05 May 2017).
- (85).Friese CA; van der Does M; Merkel U; Iversen MH; Fischer G; Stuut J-BW Environmental Factors Controlling the Seasonal Variability in Particle Size Distribution of Modern Saharan Dust Deposited Off Cape Blanc. Aeolian Research 2016, 22, 165–179. [Google Scholar]
- (86).Tsoar H; Pye K Dust Transport and the Question of Desert Loess Formation. Sedimentology 1987, 34 (1), 139–153. [Google Scholar]
- (87).Prospero JM; Bonatti E; Schubert C; Carlson TN Dust in Caribbean Atmosphere Traced to an African Dust Storm. Earth Planet. Sci. Lett 1970, 9 (3), 287–293. [Google Scholar]
- (88).Zhen H; Han T; Fennell DE; Mainelis G Release of Free DNA by Membrane-Impaired Bacterial Aerosols Due to Aerosolization and Air Sampling. Appl. Environ. Microbiol 2013, 79 (24), 7780–7789. [DOI] [PMC free article] [PubMed] [Google Scholar]
- (89).Chen P-S; Li C-S Sampling Performance for Bioaerosols by Flow Cytometry with Fluorochrome. Aerosol Sci. Technol 2005, 39 (3), 231–237. [Google Scholar]
- (90).Lin X; Reponen T; Willeke K; Wang Z; Grinshpun SA; Trunov M Survival of Airborne Microorganisms During Swirling Aerosol Collection. Aerosol Sci. Technol 2000, 32 (3), 184–196. [Google Scholar]
- (91).Hilty M; Burke C; Pedro H; Cardenas P; Bush A; Bossley C; Davies J; Ervine A; Poulter L; Pachter L; Moffatt MF; Cookson WOC Disordered Microbial Communities in Asthmatic Airways. PLoS One 2010, 5 (1), e8578. [DOI] [PMC free article] [PubMed] [Google Scholar]
- (92).Staley JT; Konopka A Measurement of in Situ Activities of Nonphotosynthetic Microorganisms in Aquatic and Terrestrial Habitats. Annu. Rev. Microbiol 1985, 39, 321–46. [DOI] [PubMed] [Google Scholar]
- (93).Nonnenmann MW; Bextine B; Dowd SE; Gilmore K; Levin JL Culture-Independent Characterization of Bacteria and Fungi in a Poultry Bioaerosol Using Pyrosequencing: A New Approach. J. Occup. Environ. Hyg 2010, 7 (12), 693–699. [DOI] [PubMed] [Google Scholar]
- (94).Bassis CM; Tang AL; Young VB; Pynnonen MA The Nasal Cavity Microbiota of Healthy Adults. Microbiome 2014, 2 (1), 27. [DOI] [PMC free article] [PubMed] [Google Scholar]
- (95).Liu CM; Price LB; Hungate BA; Abraham AG; Larsen LA; Christensen K; Stegger M; Skov R; Andersen PS Staphylococcus Aureus and the Ecology of the Nasal Microbiome. Sci. Adv 2015, 1 (5), e1400216. [DOI] [PMC free article] [PubMed] [Google Scholar]
- (96).Wilson M; Hamilos D The Nasal and Sinus Microbiome in Health and Disease. Curr. Allergy Asthma Rep 2014, 14 (12), 485. [DOI] [PubMed] [Google Scholar]
- (97).Yameen MA; Iram S; Mannan A; Khan SA; Akhtar N Nasal and Perirectal Colonization of Vancomycin Sensitive and Resistant Enterococci in Patients of Paediatrics Icu (Picu) of Tertiary Health Care Facilities. BMC Infect. Dis 2013, 13, 156. [DOI] [PMC free article] [PubMed] [Google Scholar]
- (98).Ostfeld E; Segal J; Segal A; Bogokovski B Bacterial Colonization of the Nose and External Ear Canal in Newborn Infants. Isr. J. Med. Sci 1983, 19 (12), 1046–9. [PubMed] [Google Scholar]
- (99).Stein MM; Hrusch CL; Gozdz J; Igartua C; Pivniouk V; Murray SE; Ledford JG; Marques dos Santos M; Anderson RL; Metwali N; Neilson JW; Maier RM; Gilbert JA; Holbreich M; Thorne PS; Martinez FD; von Mutius E; Vercelli D; Ober C; Sperling AI Innate Immunity and Asthma Risk in Amish and Hutterite Farm Children. N. Engl. J. Med 2016, 375 (5), 411–421. [DOI] [PMC free article] [PubMed] [Google Scholar]
- 100.() Wlasiuk G; Vercelli D The Farm Effect, Or: When, What and How a Farming Environment Protects from Asthma and Allergic Disease. Curr. Opin. Allergy Clin. Immunol 2012, 12 (5), 461–6. [DOI] [PubMed] [Google Scholar]
Associated Data
This section collects any data citations, data availability statements, or supplementary materials included in this article.