

Abstract
Toner formulations used by laser printers (LP) and photocopiers (PC), collectively called “toner-based printing equipment” (TPE), are nano-enabled products (NEP) because they contain several engineered nanomaterials (ENM) that improve toner performance. It has been shown that during consumer use (printing), these ENM are released in the air, together with other semi volatile organic nanoparticles, and newly formed gaseous co-pollutants such as volatile organic compounds (VOC). The aim of this review is to detail and analyze physico-chemical and morphological (PCM), as well as the toxicological properties of particulate matter (PM) emissions from TPE. The review covers evolution of science since the early 2000, when this printing technology first became a subject of public interest, as well as the lagging regulatory framework around it. Important studies that have significantly changed our understanding of these exposures are also highlighted. The review continues with a critical appraisal of the most up-to-date cellular, animal and human toxicological evidence on the potential adverse human health effects of PM emitted from TPE. We highlight several limitations of existing studies, including: (i) use of high and often unrealistic doses in vitro or in vivo; (ii) unrealistically high dose rates in intratracheal instillation studies; (iii) improper use of toners as surrogate for emitted nanoparticles; (iv) lack of or inadequate PCM characterization of exposures; and (v) lack of dosimetry considerations in in vitro studies. Presently, there is compelling evidence that the PM01 from TPE are biologically active and capable of inducing oxidative stress in vitro and in vivo, respiratory tract inflammation in vivo (in rats) and in humans, several endpoints of cellular injury in monocultures and co-cultures, including moderate epigenetic modifications in vitro. In humans, limited epidemiological studies report typically 2-3 times higher prevalence of chronic cough, wheezing, nasal blockage, excessive sputum production, breathing difficulties, and shortness of breath, in copier operators relative to controls. Such symptoms can be exacerbated during chronic exposures, and in individuals susceptible to inhaled pollutants. Thus respiratory, immunological, cardiovascular, and other disorders may be developed following such exposures; however, further toxicological and larger scale molecular epidemiological studies must be done to fully understand the mechanism of action of these TPE emitted nanoparticles. Major research gaps have also been identified. Among them, a methodical risk assessment based on “real world” exposures rather than on the toner particles alone needs to be performed to provide the much-needed data to establish regulatory guidelines protective of individuals exposed to TPE emissions at both the occupational and consumer level. Industry-wide molecular epidemiology as well as mechanistic animal and human studies are also urgently needed.
Keywords: toners, printer, photocopying, nanotoxicology, nanoparticle exposures, lung inflammation, asthma
Introduction
In virtually every commercial and home office, retail business, and academic institutions, workers and the public rely on laser printers (LP) and/or photocopiers (PC) for document production in some phase of daily operations. PC have been in commercial use since they were developed in 1937 by Xerox engineers searching for a means to accelerate the in-house document duplicating process with their work turned into a corporate venture in the 1950’s. In 1969, engineers at Xerox created the LP (Reilly 2003). During the unprecedented growth of computing and business machines, LP and PC have become faster, more reliable, affordable and produce higher quality images. LP and PC rely on very similar, if not the same, technology and materials to produce an image onto a sheet of paper. In more detail, irrespective of color or monochrome printing, toner-based printing requires a photosensitive drum to attract the toner powder and fuse it on the paper using elevated levels of pressure and heat (Pettersson and Fodgen, 2006).
Dry toner formulations are proprietary and generally little is known beyond information reported in Safety Data Sheets (SDS). Universal components of toner include carbon black (CB), organic resin or waxes, styrene and iron (III) oxide. However, both the exact composition and the manufacturing process varies slightly from manufacturer to manufacturer. Toner is generally made through: 1) compounding toner ingredients into a slurry that once dried is mechanically pulverized into a fine powder consisting of irregularly-shaped particles with approximate diameters ranging from 5-10 μm or 2) emulsion aggregation, which involves extrusion and additional processing that results in uniform spheres with diameters starting at approximately 5 μm to considerably larger sizes (Burns et al. 2002, O’Rourke et al. 2003).
Studies investigating the impact of toner-based printing equipment (TPE) use on indoor air quality (IAQ) date back to the early 1990’s in early Sick Building Syndrome investigations. Many of these studies focused on gaseous pollutants such as volatile organic compounds (VOC), ozone (O3), and to a lesser extent, particulates from a variety of sources (i.e., indoor cooking, microbial spores, and printing and copying) (Harrison et al. 1992, Jones 1999, USEPA 2013). Over the past decade, a considerable body of literature has documented that LP and PC emit significant numbers of nanoparticles during and following their operation.
For clarity, particulate matter less than 100 nm (PM01), ultrafine particles (UFP), and nanoparticles (NP) are defined as particles having one or more dimensions of less than 100 nm (OSHA 2011, WHO 2011). Further distinctions are made in the literature between incidental and engineered nanoparticles or nanomaterials (ENM), reflecting their origin of formation (incidental by-products of combustion or other industrial processes vs. intentional industrial manufacturing, respectively), formation mechanisms, and whether nanoparticle generation/production was intentional or not. With large-scale commercialization of nanotechnology and widespread market penetration of nano-enabled products, new mixed incidental and engineered nanoparticle exposure scenarios have emerged at various stages of a product life cycle, from the production of raw materials to end-of life recycling and disposal (Pal, Watson, et al. 2015, Sotiriou et al. 2016, Sotiriou et al. 2015). Addition of ENM in this mix creates new technical and conceptual challenges related to assessing the chemical and toxicological properties of emissions, untangling the role of ENM form that of incidental nanoparticles, and eventually assessing the risk (Watson-Wright et al. 2017).
In the context of TPE emissions, as we will discuss in detail in later sections, several metal oxides ENM (iron oxide, manganese oxide, copper oxide, titania, alumina, etc.) that are used in toner formulations, become airborne. In general, ENM, are characterized by larger surface area, more active and often catalytic surface chemistry, slower physiological clearance, longer retention in the lungs, and translocation to extra-pulmonary organs, with subsequent accumulation in the liver and spleen compared to their respective microscopic counterparts (Cohen et al. 2014, Grassian et al. 2016, Hsieh et al. 2013, Konduru et al. 2015, Konduru et al. 2014, Konduru et al. 2016, Kreyling et al. 2007, Kreyling et al. 2009, Semmler-Behnke et al. 2007, Semmler-Behnke et al. 2008, Takenaka et al. 2006, Yokel et al. 2014, Zhou et al. 2014). These physico-chemical attributes of ENM often translate to higher toxicity per unit mass (Demokritou et al. 2013).
Over the past few years, several papers have been published on the exposure characterization and toxicology of PM emitted from TPE, the overall outcome of which is a qualitative shift in our understanding of these exposures and their subsequent human and environmental health implications.
The purpose of this manuscript is to provide a comprehensive and critical appraisal of the existing, and more importantly, emerging literature on the toxicological, epidemiological and physico-chemical and morphological (PCM) characterization of emissions from TPE. Furthermore, we identify current knowledge gaps and future research needs (e.g., the need to develop better exposure controls and to assessing the disease burden in consumers and workers exposed to this technology), as well as develop the necessary regulatory framework to minimize current exposures and risks.
Methods
Online searches were performed using Google Scholar (https://scholar.google.com), Science.gov (www.science.gov), PubMed, EMBASE and Web of Science search engines with the search phrases “ultrafine particles and laser printers”, “nanoparticles and laser printers”, “ultrafine particles from photocopiers”, “nanoparticles from photocopiers”, ‘’toners” and, “toners and patents”. The literature was also searched for regulations related to PM0.1 in the occupational environment. This search included the United States Occupational Safety and Health Administration (OSHA), the United States Environmental Protection Agency (US EPA) and the World Health Organization (WHO). In addition to online searches, our group has actively investigated TPE PM emissions for several years and has amassed a reasonably thorough library of research publications, from which we draw a great deal of reference material. The search was restricted to peer-reviewed publications in English from the years of 2000 to 2016.
Results
We included 54 peer-reviewed papers specifically related to toners, emissions, and exposures from TPE. Thirty-two articles focused on emissions and their chemistry while 22 pertained solely to toxicological characterization. As mentioned earlier, papers that dealt with toxicological assessment of toners, as well as epidemiological studies on workers engaged in toner manufacturing were excluded as being outside the scope of this review. The main reason is that TPE-emitted nanoparticles represent an exposure scenario that is distinct from that of toner manufacturing.
Exposures
A chronological summary of main studies related to exposures is presented in the top part of Figure 1. It is worth noting that other important papers were published but could not been included for the sake of space limitations. In this timeline, only breakthrough discoveries/papers in this research area were included based on authors personal assessment of events. The topic of exposures from TPE has been studied continuously over the past 15 years. Earlier studies focused on emissions of VOC and O3, then PM10, PM25, and only recently the attention has shifted to PM0.1 and ENM in toners and emitted PM. Thirty-two studies have been published on exposures from the years 2000 to 2015. Table 1 provides a summary of the exposure and emission studies from TPE with a primary focus on particle and gaseous co-pollutant emissions.
Figure 1.

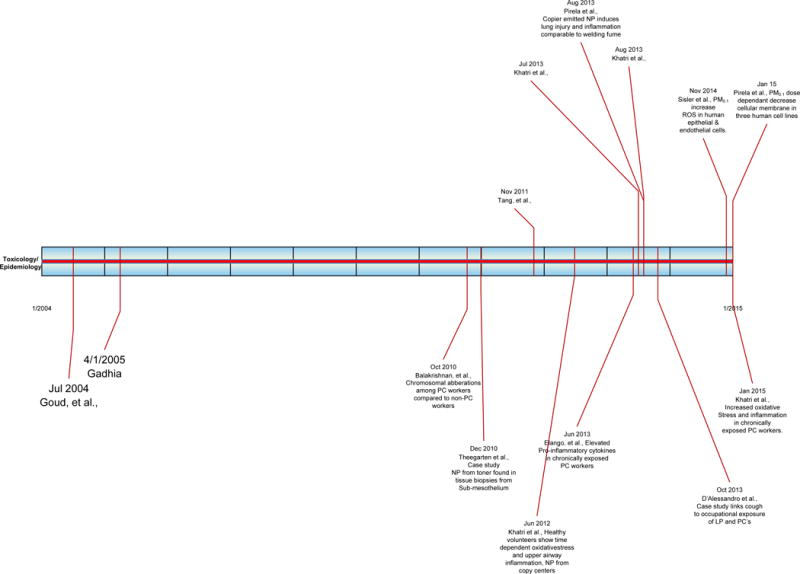
Table 1.
Summary of exposure studies from toner-based printing equipment (TPE) from 2000–2015. These studies focused primarily on particle emissions and gaseous pollutants.
| Year | Author | Study information | Main findings |
|---|---|---|---|
| 2000 | Stefaniak et al. |
|
|
| 2001 | Lee et al. |
|
|
| 2005 | Hsu et al. |
|
|
| 2006 | Lee et al. |
|
|
| 2007 | He et al. |
|
|
| 2007 | Lee et al. |
|
|
| 2007 | Kagi et al. |
|
|
| 2008 | Schripp et al. |
|
|
| 2008 | Wensing et al. |
|
|
| 2008 | Gehin et al. |
|
|
| 2009 | Morawska et al. |
|
|
| 2010 | He et al. |
|
|
| 2010 | Koivisto et al. |
|
|
| 2011 | Wang et al. |
|
|
| 2011 | Barthel et al. |
|
|
| 2011 | Tang et al. |
|
|
| 2011 | McGarry et al. |
|
|
| 2011 | Betha et al. |
|
|
| 2012 | Byeon et al. |
|
|
| 2012 | Wang et al. |
|
|
| 2012 | Salthammer et al. |
|
|
| 2012 | Castellano et al. |
|
|
| 2012 | Jayaratne et al. |
|
|
| 2012 | Sarkhosh et al. |
|
|
| 2013 | Bello et al. |
|
|
| 2013 | Mullins et al. |
|
|
| 2014 | Pirela et al. (a, b) |
|
|
| 2014 | Kowalska et al. |
|
|
| 2014 | Barrase et al. |
|
|
| 2015, 2017 | Martin et al. |
|
|
|
ACH, Air changes per hour; cm3, APS: aerodynamic particle sizer; Cubic centimeter; CMD, Count median diameter; CPC, condensation particle counter; Cpd, Compound; EC, Elemental carbon; ELCR, Excess lifetime cancer risk; ENM, Engineered nanomaterial(s); TPE, toner-based printing equipment; IAQ, indoor air quality; LP, Laser printer; MFP, Multifunction printer; NP, Nanoparticle; O3, Ozone; OC, Organic carbon; PC, Photocopier, PM0.1, Particulate matter <0.1 μm in diameter; SVOC, semi-volatile organic compounds; TD, Thermo-denuder; TNC, Total number concentration; Total volatile organic compound (tVOC); UFP, Ultrafine particle (<0.1 μm in diameter); USEPA, United States Environmental Protection Agency; VOC, Volatile organic compound.
It is important at this stage to make some important distinctions between three concepts related to exposures to nanoparticles in general and, more specifically, the TPE-emitted nanoparticles: emission measurements, area measurements in lieu of surrogate personal exposures, and personal exposure measurements. Briefly, emission measurements refer to measurement at the point of release or emission of a pollutant. Area measurements refer to collection of information in affixed location inside a room or building floor. Personal measurements refer to use of a sampler in the breathing zone (lapel) of a person (often a worker over the duration of the workday or activity of interest. In the context of TPE-emitted nanoparticles, emission measurements are taken next to the printer or he exhaust point of the photocopier; area measurements are taken at some distance in the room (often in the center of the room or between the photocopier and the desk). In personal sampling, nanoparticle monitors are worn by photocopier operators for the whole day.
None of the studies discussed here conduced true personal exposure assessment to such nanoparticles the primary reason being lack of personal nanoparticle monitors, which have become commercially available only recently. Although advantages of personal sampling are well understood and documented in the quantitative exposure assessment literature, this is a technologically driven limitation. All studies discussed here fall in the emissions or area measurements. Area measurements are used as surrogates of average personal exposures and for this reason it is important to understand how they compare to personal exposures. The issues has been studies extensively in the quantitative exposure assessment literature in occupational settings and personal monitoring almost always results in higher exposure estimates than area measurements (Demokritou et al. 2001, Rappaport and Kupper 2008). Emission measurements typically would result in higher exposure estimates than personal exposures. This is because of two primary factors: (i) that airborne concentration of a pollutant (including nanoparticles) decreases with distance from the source (due to dilution in the air and removal of contaminant from the air, e.g. nanoparticles agglomerate and/or attach to larger particles and settle); and (ii) that because workers (or consumers) move around during the day, their daily personal exposures reflect not only proximity to the source but also the time spent at different locations.
Martin et al (2017) monitored the activity in 15 photocopy centers in Massachusettsand found that photocopier operators often spent on average 63% of their time at the desk (range 35-90%), which was located on average 1.7 m away from the nearest photocopier (range 0.7-3 m).
Exposure data collected in chamber studies that employ small volume chambers (1 m3 or less), would be considered source/emission studies. If chambers are designed to mimic a room, then depending on the location of instruments, the data can be considered as area or source measurements.
It is also important to note that a variety of real time aerosol measurements instruments have been used over time. Their specifications, such as size range of nano/particle and time to generate a full-size distribution vary, and thus global nanoaerosol measurement metrics, such as total number concentration and size distributions, vary somehow between instruments. A detailed discussion of this issue is outside the scope of this review and the interested reader is encouraged to consult available reviews on this topic (e.g., Table in Amaral et al. 2015).
In subsequent sections, we provide an analysis of the aforementioned studies, distinguishing, where appropriate, between emission studies and area based exposure studies.
Gaseous pollutants
In one of the first investigations in commercial photocopy centers with a focus on VOCs, Stefaniak et al. (2000) documented conditions inside 3 photocopy centers that included a total of 7 high-volume PC. Measureable concentrations of short-chain alkanes (C5-C11) ranging from 0.1 to 21,300 ppb, as well as aromatic solvents including benzene, ethylbenzene, toluene and xylenes were found in area and personal air samples collected from each center. The authors concluded that the reported chemical composition of indoor air samples was attributed to the toner formulations and PC use. In a side-by side comparison study of LP and inkjet printers, Lee et al. (2001) found that LP significantly release greater levels of toluene, ethylbenzene, styrene, and PM10 compared to inkjet and desktop multifunction devices. Because LP and PC employ nearly identical physical process and toner formulations to create an image, Lee’s findings were in good agreement with those from Stefaniak.
In a controlled chamber study of 17 PC from 3 different manufacturers, Hsu et al. (2005) reported PC emit measurable amounts of VOC during the idling and printing stage. The authors found benzene concentrations ranged from 90 to 121 μg/m3. Similarly, another study investigating VOC from PC found significant concentrations of benzene, toluene, styrene, ethylbenzene, alkanes, acetophenone and several aldehydes (Lee et al. 2006). A later assessment of LP emissions using chambers verified the presence of styrene and xylene in the emissions in addition to O3 at levels of up to 30 ppb. Further, the same evaluation was done in an office environment and found that VOC were also emitted by LP at elevated levels (200 μg/m3) (Kagi et al. 2007). Soon after, Barrero-Moreno et al. (2008) measured the gaseous pollutants emitted in a chamber and found the released compounds included styrene, xylenes, ethylbenzene, toluene and particularly, 2,3-dimethyl-2,3-diisobutyl succinonitrile encompassed up to 90% of the VOC identified in the study. Later, Barrese et al. (2014) documented O3 at levels of 45 ppb in an office-sized room and a notable increase in VOC.
Wang et al. (2012) performed qualitative analysis showing TPE emission of alkanes ranging from C21-45, as well as carboxylic acids, esters and other organics. The authors found O3 emission rates ranging from 9.7 to 21.1 μg/minute and total VOC (tVOC) concentrations of up to 400 ppb. Further, 9 unsaturated organic compounds were found to originate from the toner and paper. Higher levels (up to 2889 ppb) of VOC were measured by Pirela et al. (2014) in a chamber study assessing 11 laser printers from various manufacturers. Moreover, Mullins et al. (2013) documented the release of a number of polyaromatic hydrocarbons (PAH) from toners using a simulated printing process. Benzene and trichloroethene were found to be emitted at concentrations greater than 1.15 μg/m3 (0.36 and 0.21 ppb, respectively). Further, the authors documented 14 PAH including phenanthrene, fluoranthene, pyrene and benzo(b)fluoranthene with maximum total emissions of 2.3 μg/page.
While a number of studies have performed chemical speciation on various gaseous co-pollutants emitted, and not just VOC, by TPE during a print job, there are still some knowledge gaps on the topic. For example, chemical interaction between the organic components in these emissions, their absorption on the surface of PM constituents, partitioning between gas/vapor and the PM phase, the impact of aging of the TPE-released pollutants, and their potential toxicological implications remain unknown.
Particulate Matter, PM
The first report on PM exposures in photocopy centers was done by Lee and Hsu (2007), who investigated indoor air quality in several photocopy centers in Taiwan for 9 months. The authors found the occupational environment was often poorly ventilated and cramped with high-volume PC with high levels of PM25 ranging from 10 to 83 μ/m3, with average measurements around 40 μ/m3. The PM25 values regularly exceeded the acceptable 24-hour threshold limits of 100 μ/m3 established by the Taiwan Environmental Protection Agency. Values as high as 1.0×10 particles/cm3 were reported during the printing process, with NP accounting for the majority of the total number concentration (TNC).
Since 2007, heightened sensitivity and sophistication of real-time particle measuring devices, as well as an increased awareness and research interest on this topic resulted in a groundswell of publications from 2007 to the present, especially in controlled environmental chambers.
In the first large scale investigation of LP emissions conducted in an open plan office environment, He et al. (2007) observed increases in TNC up to 3.8×10⁴ particles/cm3. Based on this result, the authors followed with a comprehensive chamber study where significant variation in emissions was observed over the LP studied. Furthermore, emissions varied significantly from one LP model to another, which led to a simple classification structure wherein 40% of the printers studied were classified as “high emitters”. Significant emissions were observed with a count median diameter (CMD) that ranged from 40-76 nm, which suggests the majority of measured particles were PM01 and this has been verified in multiple subsequent studies (Géhin et al. 2008, Salthammer et al. 2012).
Temporal characterization of emissions is an important consideration and several studies have investigated the TPE-emitted PM before, during and after their use. Schripp et al. (2008) reported PM01 emitted from LP at concentrations of 1.1×10⁵ to 2.2×10⁶ particles/cm3 with CMD ranging from 22-40 nm and concluded LP generally fall into two categories based on their temporal emissions patterns. One type of emission profile is the “initial burst”, which is characterized by a sharp increase in TNC immediately following the beginning of a print job, and a subsequent sharp decrease in particle concentration when printing has ceased. In contrast, the “constant emitter” pattern is characterized by a less pronounced increase in TNC at the onset of a print job followed by a much more gradual decrease with time. Tang et al. (2011) assessed 59 LP and 4 PC in office environments and measured PM01 at levels of up to 1.9×10⁵ particles/cm3 with average TNC from 1.0×10 to 80×10 particles/cm3. This study found PM01 concentrations tripled in offices when printing was taking place compared to non-printing even in standby mode. Further, other reports have shown indoor TNC is much greater during office hours (i.e., frequent printing events) than non-business hours.
An important development in the early 2010s was a shift in focus on the morphological and chemical composition of the size fractionated TPE-emitted PM fraction, starting with initial analysis for metal oxides and inorganics widely reported in toner SDS. For example, Barthel et al. (2011) and Pirela et al. (2015) conducted experimental work that focused on the elemental and chemical composition of TPE-emitted PM0.1. In these chamber studies, 10 and 11 LP, respectively, were assigned scripted print tasks and elevated TNC were observed and attributed to the toner used. Further, several transition metals, silicon (Si), chromium (Cr), iron (Fe), manganese (Mn), nickel (Ni), titanium (Ti) and zinc (Zn) were found and attributed directly to the toner formulations used. For the first time in the study of TPE emissions, Barthel et al. (2011) used a thermodenuder as part of the analytical assessment in order to expose the aerosol to very high temperatures and effectively strip the particles of any organic content. The analysis showed that 98-99% of the aerosol emissions in their case were found to be organic in nature; however, no additional analysis to resolve organic content was reported. Salthammer et al. (2012) conducted similar experiments and found emissions contained high organic content, particularly long chain aliphatic and carboxylic acid esters were detected.
A majority of assessments investigating LP emissions have occurred within controlled environmental chambers, which allow researchers to gain an understanding of the magnitude of PM emission, composition, and general mechanisms of formation. Chambers allow investigators to precisely control experimental variables (e.g., relative humidity, temperature, air exchange rate, ventilation rate, operational parameters). Further, in this experimental setting there are no other sources of emissions but those from the TPE, thus isolating both the PM and the gaseous co-pollutants for PCM analysis. In addition to the chamber studies, which are critical in terms of generating real world exposures and assessing their PCM and toxicological properties, exposure assessment studies in various occupational and residential settings are needed to assess human population exposure levels (Wensing et al. 2008).
More recent studies by the authors provide a comprehensive PCM characterization of size fractionated airborne PM for both LP and PC. These studies were built on the hypothesis that ENM had been incorporated into toner formulations and that wide-ranging testing approaches and platforms were needed to properly understand the problem. In the first report to affirm ENM in dry toner formulations, Bello et al. (2013) conducted extensive PCM analysis of PM sampled in a high-volume commercial photocopy center in the US. The photocopy center housed 2 PC from the same manufacturer and used toner with similar ingredients. The results of this multiphasic study included TNC in excess of 2×10⁵ particles/cm3, the majority of which was PM0.1 with primary particle sizes ranging from 30-40 nm (CMD: 34.5 nm), secondary particle sizes of approximately 8-10 nm and PM01 mass concentrations of 4.3 to 4.9 μg/m3.
Firstly, the study by Bello et al. (2013) documented for the first time that toners used in PC constitute a NEP with several ENM in toners become airborne during printing, which contain transition metals and metal oxides (i.e., Fe, Si, Ti, Mn, aluminium (Al), Zn, antimony (Sb), phosphorus (P), magnesium (Mg), calcium (Ca)). Moreover, scanning and transmission electron microscopy (STEM) with energy dispersive x-ray spectroscopy (EDX) analysis found visual and analytical evidence of several types of ENM in both toner and airborne aerosols. Secondly, semi-volatile organic compounds (sVOC) such as long chain alkanes in toners were found in the PM at concentrations ranging from 10 to 2670 ppm but their contribution to the total airborne mas was negligible (<2%). Thirdly, the study provided for the first time a mass balance picture of TPE emissions. The PAH composition (phenanthrene, fluoranthene, pyrene, chrysene and benzo(b)fluoranthene) in the airborne fraction was generally low (10-50 ppb), but no PAH were found in the toners. There are similarities in organic content of photocopy center PM01 at 50-70% organic carbon (OC) by mass, suggesting a significant amount of organic material of indeterminate composition present in PC emissions. Lastly, little PM elemental carbon was found in this study (approximately 0.1 to 0.6%), although toners contained between 5.6 and 5.9% EC. This overall approach was subsequently used in a field study in eight copy centers Martin et al. (2015).
Pirela et al. (2014) developed a laboratory-based exposure platform designed to generate real world exposures suitable for the PCM and in vitro and in vivo characterization studies. This exposure generation platform was utilized to characterize PM emissions from 11 most commercially used monochrome LP. This platform enabled the authors to collect size-fractionated PM samples for off-line PCM and in vitro characterization and was also used in animal inhalation studies. The authors confirmed for the first time that toner formulations of LP constitute a nano-enabled product in agreement with Bello et al. (2013) study for PC. They also confirmed that ENM from toners are released in the air during printing missions and found emission PM peaks of approximately 1.3×10⁶ particles/cm3, with most of the emitted PM with diameters of less than 100 nm, also consistent with the earlier observations of Bello et al. (2013). More importantly, Pirela documented at least eight different ENM in dry toner formulations and in the PM01, including oxides of Si, Ti, Fe, Zn, Al, copper (Cu) and cerium (Ce). This finding was the first to conclusively verify widespread ENM utilization in toner formulations irrespective of the manufacturer or brand for LP. Interestingly, in one particular toner formulation there were TiO2 nanofibers found following detailed STEM and EDX analysis. All evaluated toners contained large amounts of OC (42-89%), metals/metal oxides (1-33%), and some EC (0.33-12%). No OC speciation analysis was performed by the authors. The so-called laser printer-emitted particles (PEPs) possess a composition similar to that of toner and contained 50-90% OC, 0.001-0.5% EC and 1-3% metals. This complex chemical makeup raises additional questions and concerns with respect to ENM that may become airborne and introduced into the general breathing zone of the user (Pirela et al. 2015).
In an expanded follow-up study in 8 photocopy centers across Massachusetts, Martin et al. (2017) conducted extensive PCM characterization of 17 PC toner formulations (5 black and 12 color) from five major manufacturers as well as of size fractionated PM samples collected in those PC centers. Consistent with the earlier studies of Bello et al. (2013) and Pirela et al. (2014), Martin et al. (2015) documented multiple ENM in all the toners examined. Moreover, the study documented ENM separation from the parent toner in multiple formulations, lending support to the earlier concern that ENM may become airborne during the printing/photocopying process. Authors documented high exposures in several centers with weekly average TNC ranging from 3.6×10³ to 3.8×10⁴ particles/cm3 and maximum transient bursts of more than 1.4 million particles/cm3, which translated to TNC over 700 times greater than background. These findings could have been anticipated as lack of engineering controls, poor ventilation, crowded rooms and little awareness of exposures from TPE were documented in most of the 15 photocopy centers surveyed by Martin et al. (2017). Furthermore, the authors found the chemical composition of the PM01 aerosol collected at 8 photocopy centers was complex and qualitatively consistent with Bello and Pirela’s studies. Elemental composition of PM01 from PC was found to include S (0.71-10%), Ca (0.70-2.67%), sodium (Na, 0.16-1.86%), Fe (0.10-0.99%), potassium (K,0.13-1.56%) and Zn (0.14-0.22%). Further, inorganic makeup varied greatly from 36 to 94% among the photocopy centers evaluated. The emitted PM elemental composition reflected qualitatively toner composition and agreed with previous findings. The data show that multiple ENM (e.g., metal oxides) are routinely used in toner formulations, which now seems to be an industry norm. Therefore, a complex chemical composition of the airborne fractions, containing organics, inorganic metal oxides, and small amounts of CB is expected.
Lastly, PM emissions from LP (and PC) also carry charged particles, as well as anions and cations in the form of salts, which should not be surprising given the necessary charge transfer complex created within the device to facility toner deposition onto the paper as it passes the toner drum and into the fuser rollers. Jayaratne et al. (2012) found a single LP released significant quantities of charged particles into the environment. However, the authors did not find a relationship in this study between charged particles, CMD, or TNC. Pirela et al. (2015) found several cations and anions in LP PM0.1 emissions, with individual species (i.e., chloride) all less than 1 μg/g, and the combined total of anions and cations accounting for less than 2% of the total mass of PM emissions. Similarly, Martin et al. (2015) found cation and anion mass concentration in PC emissions for one PC center to be low and in agreement with Pirela et al. (2015). With regards to sVOC, targeted structural elucidation of organics is still needed to identify its major constituents. Despite extensive screening for over 200 analytes, the majority of this organic sVOC fraction, by mass, is not characterized and no exposure markers uniquely specific to TPE emissions are yet available. The catalytic role of metal oxide ENM in formation of new organic species and as carriers of condensed organic matter on their surface is also worthy of further investigations.
Particle Formation Mechanisms
Equally important to PM concentration, from a mitigation and control perspective, are the mechanisms of formation and specific emissions point(s) around the LP or PC. Recurring conceptual themes with respect to particle formation from laser printers are related to the fuser or internal temperature of the housing, homogenous nucleation of sVOC and reaction of VOC with small amounts of O3 present that create secondary organic aerosols (SOA). As research has shown clear evidence that PM0.1 dominates the particle emissions by number, investigations now steer toward additional characterization of the elemental and chemical composition of aerosols in the work environment, as well as formation mechanisms of emissions.
In chamber experiments, Morawska et al. (2009) showed particle and VOC emissions (including ethylbenzene, cyclohexane, m-p-xylene, dimethyl phthalate and toluene) to appear dependent on temperature and correlate positively with PM0.1 TNC and O3 concentration. Negative correlation was found between PM0.1 and tVOC concentration. The authors hypothesized particles may be formed in at least two separate and distinct pathways: 1) homogenous nucleation of evaporated sVOC to form particles, and 2) particle formation through the reaction of VOC with small amounts of O3 to produce SOA. Following Morawska’s results, He et al. (2010) reported fuser temperature has a significant role in particle emissions rates, which support Morawska’s temperature observations. The authors went on to show LP begin to emit particles as soon as they are turned on (in the warm-up phase), which is consistent with other reports (Wensing et al. 2008, Tang et al. 2011).
It is worth mentioning that in earlier microscopy observation studies, the authors found small numbers of toner particles, submicron toner fragments, and agglomerates of NP. The presence of these particles cannot be explained by the first two formation mechanisms. Thus, a third mechanism (mechanical ejection of engineered NP and occasional toner fragments) should also be considered. Specifically, it has been shown that there is release of nanoscale particles from a NEP (i.e., toner powder) during the use of TPE. This is facilitated by the airflow created by the cooling exhaust fan and rollers moving paper through. This mechanism has been confirmed in two studies assessing emissions from both PC and LP (Bello et al. 2013, Pirela et al. 2015). The released PM from TPE was chemically complex and reflected the toner powder chemical profile (e.g., metal oxides). Further, the authors provide evidence of VOC condensing on the surface of the TPE-emitted solid inorganic particles, with particles acting as carriers of the VOC emitted by TPE. Understandably, the health implications for exposures to both PM and VOC are of great interest since the gaseous co-pollutants may now be able to reach the alveolar region of the lung and potentially cause adverse physiological responses.
Of additional importance is identifying where within the LP individual compositional components (i.e., paper, toner, printer housing and solid parts) arise. Particularly, following elemental analysis of the emissions from TPE, only Ca has been linked to the paper used during the print job (Barthel et al. 2011, Pirela et al. 2015). Moreover, Pirela et al. (2015) and Martin et al. (2015) suggested that paper may contribute other elements besides Ca (CaCO3), present in the paper as fillers and whitening agents, including Ti (as titania), Al (as alumina), and Mg (magnesium salts). Understanding the source material, formation mechanisms, and source apportionment, are important first steps in developing effective exposure control measures and product reformulation.
Parameters that affect PM emission profiles
Few studies have evaluated the emission profile of both monochrome and color printing by LP. One study by He et al. (2010) found that color printing leads to two to three times more particle emissions than monochrome printing when comparing LP of the same manufacturer, which is consistent with previous reports (Schripp et al. 2008). The authors followed up on the premise that color printing results in greater TNC by testing both color and monochrome printers in a chamber and found that TNC ranged by three orders of magnitude and color printers were generally found to be greater PM0.1 emitters than their monochrome counterparts.
Print speed (pages per minute) is an operational characteristic that may affect LP emission profiles. It was determined that average particle number concentration was inversely proportional to print speed, while average particle mobility diameter was directly proportional to print speed (Byeon and Kim 2012). The authors hypothesized that lower concentrations (or larger diameters) with increasing printing speed were due to higher coagulation rates with higher primary particle concentrations.
In addition to color/monochrome toner powder and printer speed, several studies have assessed the effect toner page coverage may have on the emission profile of LP. The results indicate that particle emission characteristics are affected by toner coverage, of up to 50%, of the page used by the LP (He et al. 2007, Wang et al. 2012, Pirela et al. 2014). In contrast, some studies have reported inconclusive results regarding toner coverage and PM0.1 emissions (Schripp et al. 2008, Morawska et al. 2009, McGarry et al. 2011). In addition to toner coverage, it has been observed that toner cartridge condition may impact TNC with used cartridges emitting fewer particles compared to newer cartridges (He et al. 2007, Wang et al. 2011).
Other operational conditions that have been shown to increase PM0.1 emissions are startup and standby modes. Wang et al. (2011) observed cold starts and idle time longer than 30 minutes resulted in significantly greater PM0.1 emission compared to emissions from the same LP when given sufficient time to warm up, or was still warm from recent use.
Deposition Modelling
Understanding deposition patterns of TPE-emitted particles is critical in assessing the overall lung burden and estimating deposited doses in the various regions of the respiratory tract. By using the appropriate integrated in vitro dosimetric methodologies, researchers can then compare and select the proper exposure and dose range used in either animal or cellular experimental models (Cohen et al. 2013, Cohen et al. 2015, DeLoid et al. 2014, DeLoid et al. 2017, DeLoid et al. 2015, Pal, Watson, Pirela, Singh, Chalbot, Kavouras and Demokritou 2015).
The Multiple Particle Path Dosimetry Model (MPPD) v.2 (Anjilvel and Asgharian 1995) has been utilized to calculate the lung deposition fraction and deposition mass flux of the particles emitted from TPE on the human respiratory system. Default model parameters used in that modelling assume nasal breathing, a functional residual capacity of 3300 mL, tidal volume of 625 mL, head volume of 50 mL, breathing frequency of 12 breaths/min, and inspiratory fraction of 0.5 (Martin et al. 2015). PC center or LP specific aerosol size distribution parameters were used in the model and they included CMD of 23-40 nm (σg of 1.7-2.1; MMD of 89-180 nm). The estimated total particle deposition in the lungs for this set of parameters varied from 28% to approximately 40%, with increasing gradient of deposition from the head airways to the alveolar region, as follows: head airways (~6%), trachea-bronchial region (~10 %), distal alveolar region (15-20%) (Pirela et al. 2014, Martin et al. 2015). The total deposition mass flux based on the modelling of actual exposure data from the aforementioned studies was 1.732 μg/min●m2, meaning significant doses per unit surface area of lungs per unit time can be delivered to individuals running LP or PC. Of interest is to compare doses and dose rates that the upper airways may receive relative to the lower airways. Specifically, upper airways with a surface area of 150 cm typically would receive 6% of the total number of TPE emitted nanoparticles, whereas the deep airways with 120 m2 surface area receive about 15% of the total number of particles. Crude estimates ((0.06/150)/(0.15/12×105) = 3200) suggest that much higher doses (number per unit surface area of the epithelium) are received by the head airways region, which may be over 3000 times higher than those received by the lower parts of the lungs (Khatri et al. 2013, Pirela et al. 2014). This is important in the context of upper airway disease and possible nanoparticle translocation towards the brain (Oberdorster et al. 2009).
Toxicological Assessment of PM Exposure
The toxicology of PM emitted from TPE has been studied systematically only in the past five years (Tables 2 and 3). Most of these early studies have been conducted by the authors and include mono- and co-culture cellular models, animal intratracheal instillation and whole-body inhalation studies, as well as small-scale exploratory studies in human volunteers and chronically-exposed PC operators. Notable for these studies is the emphasis on employing realistic exposure scenarios supported by extensive PCM exposure characterization studies. The first set of such studies also aligned the toxicity endpoints around airway inflammatory pathways, enabling construction of a broader mechanistic picture on the action of these particles on cells.
Table 2.
Summary of findings from toxicological studies evaluating adverse health effects following exposure to toner powder and TPE-emitted PM.
| Year | First author | Study information | Main findings | Comment |
|---|---|---|---|---|
| 2010 | Bai et al. |
|
|
|
| 2010 | Gminski et al. |
|
|
|
| 2012 | Tang et al. |
|
|
|
| 2013 | Khatri et al. |
|
|
|
| 2013 | Khatri et al. |
|
|
|
| 2013 | Pirela et al. |
|
|
|
| 2014 | Sisler et al. |
|
|
|
| 2015 | Pirela et al. |
|
|
|
| 2016 | Pirela et al. |
|
|
|
Table 3.
Summary of human health studies exposed to emissions from toner-based printing equipment (TPE).
| Year | First author | Study information | Main findings | Comments |
|---|---|---|---|---|
| 2000 | Zina et al. |
|
|
|
| 2004 | Goud et al. |
|
|
|
| 2005 | Gadhia et al. |
|
|
|
| 2009 | Manikantan et al. |
|
|
|
| 2010 | Theegarten et al. |
|
|
|
| 2010 | Balakrishnan et al. |
|
|
|
| 2011 | Kleinsorge et al. |
|
|
|
| 2012 | Khatri et al. |
|
|
|
| 2012 | Dutta et al. |
|
|
|
| 2013 | Elango et al. |
|
|
|
| 2014 | D’Alessandro et al. |
|
|
|
| 2015 | Awodele et al. |
|
|
|
| 2016 | Karimi et al. |
|
|
|
Many studies have been conducted to evaluate toxicity of toner powders in both cellular and animal experimental models (Bai et al. 2010, Bellmann et al. 1991, Furukawa et al. 2002, Gminski et al. 2011, Konczol et al. 2013, Lin and Mermelstein 1994, Morimoto et al. 2013, Muhle et al. 1991, Muhle et al. 1989, Tang et al. 2012). Such studies are directly relevant only in cases of accidental toner exposures, which can happen during toner manufacturing, toner handling, and service/repair of copy machines by copier technicians. However, studies with toner particles are not relevant to, nor are they a substitute for, actual exposures to emissions from TPE because of profound differences in PCM properties between toners and emitted PM and gaseous co-pollutants, differences in particle biokinetics (clearance rate, retention, uptake and translocation inside cells and beyond the lungs), and dose rates. For this reason, such studies have been excluded from this analysis. It is important to note, however, that a few in vitro and in vivo studies have used toner as a surrogate of TPE-emitted nanoparticles. Such practices have little justification and toxicological relevance and we discourage future use of toners in lieu of TPE-emitted nanoparticles as they are inappropriate substitutes and such analysis may have potentially misleading outcomes. There is no replacement for the use of TPE-emitted nanoparticles, at realistic doses and exposure rates, for assessing their toxicological properties, both in vitro and in vivo.
Particles emitted from TPE
In vitro experimental model
Studies using PM emissions from TPE are more relevant to exposures during printing and consumer use than those from toner powder during manufacturing and handling of toners. Such studies have been conducted only in the past few years. Pirela et al. (2014) developed an integrated exposure generation platform that can be utilized for both PCM and in vitro and in vivo toxicological characterization of emissions from LP. This integrated platform was utilized to assess bioactivity of PM emitted from LPs including cell viability and function and identification of molecular markers and endpoints that reflect mechanistic pathways and mode of action. More specifically, Pirela et al. (2016) exposed three physiologically relevant cell lines (small airway epithelial cells, macrophages, lymphoblasts) to LP-emitted PM0.1 at a wide range of administered doses (0.5-100 μg/mL) and observed significant cytotoxicity, membrane integrity damage, increase in reactive oxygen species (ROS) production as well as a rise in pro-inflammatory cytokine release, and epigenetic changes specific to the DNA methylation machinery in different cells lines at mass concentrations in the range doses at the low end of the exposure range correspond to 7.8 hours, whereas at the high concentration range, they would equate to 1,500 hours of exposure (or six straight months) (Lu et al. 2016, Pirela et al. 2016). These concentration ranges are much smaller than what is typically used in in vitro nanotoxicology, and more realistic at the low end of concentrations, however, lower and more realistic doses must be used in future studies.
A co-culture system consisting of small airway epithelial cells and human microvascular endothelial cells was also used to further evaluate bioactivity of both PM0.1 and PM2.5 released by LP (Sisler et al. 2015). The authors found that direct exposure of epithelial cells to LP-emitted PM caused morphological changes of actin remodeling, gap formations, increased production of reactive oxygen species and angiogenesis within the endothelial monolayer. Additionally, a significant upregulation of interleukin (IL)-1β, IL-1Rα, IL-6, IL-8, monocyte chemoattractant protein (MCP)-1, fibroblast growth factor (FGF) basic, interferon γ-induced protein (IP)-10, regulated on activation, normal T cell expressed and secreted (RANTES) and macrophage inflammatory protein (MIP)-1β levels in the cellular lysates or the condition media was found following treatment. These chemokines and cytokines play a major role in the cellular communication observed between small airway epithelial cells (SAEC) and human microvascular endothelial cells (HMVEC) and the resultant responses in HMVEC, in addition to general initiation of the immune response. In another study, PM emitted from some LP caused significant DNA damage on A549 cells following exposure via air-liquid interphase, based on the presence of micronucleus. However, the same study concluded the NP did not cause significant cytotoxic effects on the exposed cells (Tang, Gminski, Konczol, Modest, Armbruster and Mersch-Sundermann 2012). As is common with an air-liquid interphase system, nanoparticle concentration and dose delivered to cells is often unknown. This study highlights another potentially overlooked observation related to possible significant differences in the chemical and toxicological properties of TPE emissions.
Besides LP-emitted PM, there have been studies evaluating the toxicological potential of PM sampled from various PC centers. For instance, Khatri and colleagues tested the effect of the PM0.1 and PM0.25-2 size fractions of photocopy center particles on 3 types of cells (primary human nasal epithelial cells, small airway epithelial cells and induced THP-1 macrophages) at administered concentrations of 30, 100 and 300 μg/mL, which correspond to a cell surface dose of 18, 62.5 and 180 μg/cm2. The authors back-calculated the delivered doses to cells using in vitro cellular dosimetric approaches (that had become available at the end of the study) and found that TPE emitted nanoparticle agglomerates would settle much slower than larger particles and control nanoparticles, such as copper oxide NP. As a result, only 1/10th of the administered concentration would have deposited to the cells at 6 hours, resulting in a 10-times lower effective dose to cells. At 24 hours, only ~20% of the administered concentration of particles would deposit, resulting in an effective cell dose of 1/5th of the administered one, or ~5 times lower ~6, 20, 60 μg/mL). After considering dosimetry, effective doses to cells would in fact be 10 times and 5 times lower at 6 and 24 hour time points, or 1.8, 6.3 and 18 and 6, 22, and 60 μg/cm2, respectively. The message from this assessment is clear: gross errors, as big as five to ten-fold in magnitude would result in the slope of dose-response relationships in vitro, if in vitro dosimetry is not considered. A second important implication of this assessment, highly relevant to this discussion relates to relative comparison of potency of TPE-emitted nanoparticles to other types of nanoparticles. For example, in this same study, CuO nanoparticles of comparable size to TPE nanoparticles were used. Because CuO nanoparticle settle faster, 50% and 100% of the administered CuO concentration was delivered to the cells at 6 and 12 hours, respectively. As we have shown elsewhere (Pal, Bello, et al. 2015), such considerations change the overall picture of the relative potency of these nanoparticles in vitro. In this case, when adjusting for delivered doses, the slope of tumor necrosis factor (TNF)-α production for example for TPE-emitted nanoparticles was ~7 times steeper than that of CuO ENM.
Modest cytotoxicity was observed in the aforementioned cell lines, especially for NP. The cells exhibited high levels of apoptosis and oxidative stress, in addition to an inflammatory response reflected in significant upregulation/expression of the following cytokines: granulocyte-macrophage colony-stimulating factor (GM-CSF), IL-1α, IL-1β, IL-6, IL-8, interferon (IFN)-γ, MCP-1, TNF-α, epidermal growth factor (EGF), and vascular endothelial growth factor (VEGF) (Khatri, Bello, Pal, Cohen, et al. 2013). Furthermore, gene expression confirmed upregulation of Clustered Regularly Interspaced Short Palindromic Repeat-associated protein 8 (CAS8) and tumor protein p53 (apoptosis), TNF-α (inflammation), and heme oxygenase 1 (HO1) (oxidative stress), as well as down regulation of Superoxide Dismutase 1 (SOD1) and Glutathione Peroxidase 1 (GPX1) (oxidative stress). No DNA damage was observed in any of the tested cell lines by comet assay, and neither of the two genes (ku70 and RAD51) tested was affected. Additionally, the authors performed more studies taking into account dosimetry for the nanoscale fraction (no such corrections are needed for larger fractions because they settle faster) and reported that PM0.1 were far more potent in inducing cytotoxicity than the PM0.25-2 fraction (Khatri, Bello, Pal, Cohen, Woskie, Gassert, Lan, Gu, Demokritou and Gaines 2013, Khatri, Bello, Pal, Woskie, et al. 2013).
A major issue with using in vitro experimental models relates to the delivery method of NP to cells. In the case of air-to-liquid delivery systems, particles are delivered to cells in a way that has physiological relevance but the exact dose to cells is difficult to measure or estimate. Delivering nanoparticles in the form of suspensions are susceptible to inaccuracies related to dispersion techniques, dispersant media, re-agglomeration and settling behavior. Recently, methodologies that deal with protocols for ENM dispersion, agglomerate characterization, which includes measurement of effective density of formed agglomerates in cell culture media, and numerical fate and transport approaches that estimate delivered dose to cells as a function of time have been developed and become widely available (DeLoid et al. 2014, 2015 and 2017, Cohen et al. 2015). Employing proper dispersion, characterization and dosimetry methods in in vitro studies, as well as matching the dose delivered to cells to realistic exposure levels are extremely important, critical in fact, in the study outcomes (Pal, Bello, Cohen and Demokritou 2015, Pal, Watson, Pirela, Singh, Chalbot, Kavouras and Demokritou 2015).
As illustrated in earlier sections, dose ranges and lack of dosimetry consideration in in vitro nanotoxicology of TPE-emitted nanoparticles continue to be major problem. Nonetheless, the impact of such conceptual and experimental errors is potentially profound. With the methodology now standardized and freely available, there are no excuses to ignore them. Furthermore, lower dose ranges should be used, one to two orders of magnitude lower, and dose equivalency between airborne exposures and in vitro concentrations documented.
Animal experimental models
There are only a few studies focusing on studying the biological effects of exposure to the emitted PM from LP and PC. These studies are recent and have been conducted primarily by the authors. For example, an assessment was done by Pirela et al. (2013) using different size fractions of PM collected from a photocopy center intratracheally instilled in mice at various doses (0.2, 0.6, 2.0 mg/kg bw). Particle size- and dose-dependent effects were observed in the pulmonary system of the instilled mice. The PM0.1 size fraction led to increased neutrophil number, lactate dehydrogenase, albumin and pro-inflammatory cytokines, all markers of lung injury and inflammation. As for LP-emitted PM, Pirela et al. (2016) evaluated the toxicological potential of these particles in mice exposed by intratracheal instillation (0.5, 2.5, 5.0 mg/kg bw). While the authors found no changes in lung membrane integrity, an immune response -indicated by elevated neutrophil and macrophage recruitment in bronchoalveolar lavage fluid (BALF)-was seen after instillation of LP emitted PM at 0.5 mg/kg bw. Gene expression and epigenetics modifications were documented on mice exposed to 2.5 mg/kg bw, mainly as upregulated expression of the Ccl5 (Rantes), nitric oxide synthase 1 (Nos1) and uncoupling protein 2 (Ucp2) genes in the murine lung tissue and modified components of the DNA methylation machinery (Dnmt3a) as well as expression of transposable element (TE) long interspersed nuclear element (LINE)-1.
Regardless of the experimental model used for the various toxicology studies reviewed here, three common themes - inflammation, oxidative stress, and gene regulation - seem to emerge throughout. In particular, upregulation of only number of important chemokines and cytokines that play various important roles, including but not limited to leukocyte migration and infiltration, cellular antioxidant status and redox balance, modulation of pro-and anti-inflammatory responses, and initiation of an immune response to exogenous particles, among other equally essential biological functions (such as apoptosis).
Understandably, the main focus of investigations to-date has been the respiratory system. Since NP from TPE represent a complex mixture, containing a large organic component, a sizeable amount of metal oxides, and other more volatile organics absorbed onto surface of PM, the toxicological testing framework for these particles should be expanded to evaluate other organ systems and endpoints-including but not limited to those related to cardiovascular, neurological, and blood systems. For example, Lee et al. (2015) demonstrated a concentration-dependent inhibition of synaptic signaling by photocopy center NP in mouse cultured cortical neurons over 0.1-50 μg/mL of administered concentrations (corresponding to delivered concentrations of 0.2-10 μg/mL at 24 hour after taking into account dispersion and dosimetry modeling), and a synergistic effect between amyloid beta and NP. Equally important is utilization of screening assays to understand the impact of variability in chemical composition on toxicity, synergistic effects between organics and metals, and biokinetics of such particles from real world exposures, studies yet to be conducted. Recently, Setyawati et al. (2015) published a review detailing the differences in properties and behavior of the various types of endothelial cells found in the human body, particularly as they relate to interaction with NP with diverse physico-chemical properties. The authors highlighted the importance in considering the extensive variation in endothelial cell characteristics when evaluating the biological potential of NP in the field of nanomedicine, especially as it refers to pharmacokinetics and drug targeting. Particularly, it was found that PM from classrooms led to significantly more cytotoxicity and leakiness in human microvascular endothelial cells than that of the corridor due to the markedly high content of endotoxin found in the indoor PM sample (Chua et al. 2016).
Evaluation of a relevant dose range that reflects realistic human exposures and data-driven tissue dosimetry for neurons in the brain of humans (or animals for that matter) is extremely difficult at present, because reliable data are scarce and the data on biokinetics of nanoparticles to the brain are nanomaterial and system dependent. In all likelihood, unrealistically high doses are being used in such systems, including in this study.
Human studies
Medical case reports
Relevant, high quality studies in humans are limited. Here, we review evidence from human medical case reports, controlled human studies with well-documented exposure information, and studies that incorporate biomolecular markers along well established disease mechanisms induced by airborne particles. Some landmark studies have been summarized in Figure 1, bottom panel. In an early medical case report (MCR) to link work-related TPE exposure to clinical observations, Zina et al. (2000) reported an otherwise healthy 30-year old male presented with rash on the arms, neck and upper trunk. Symptoms were reported to resolve when the subject was removed from the PC environment for several days and would recur upon return to work, even for a short period of time. Whilst patch tests of toner material were unclear, formaldehyde and quaterinium-15 were found to be in the used toner, and becoming airborne during operation. The examiner concluded the observed symptoms were caused by exposure to PC emissions.
D’Alessandro et al. (2013) reported a case of a 46-year-old worker with no history of smoking or allergies who exhibited chronic coughing caused by exposure to PC emissions. Bronchoscopy and BAL biopsy found a significant increase in neutrophils and lymphocytes, and biopsy of the bronchial mucosa suggested moderate signs of inflammation. The authors conducted a controlled challenge test where the subject was exposed to TPE emissions for one hour after four weeks of no workplace exposure and no symptoms. The test was conducted in a 63-m3 room with normal ventilation and the exposure resulted in immediate and severe coughing, which provided additional evidence that TPE emissions may have a negative impact on workers, patrons, and occupants of the indoor space where TPE are operated without any type of exposure control.
Another published case is that of a worker occupationally exposed to more than 3 years of emissions from a LP that averaged approximately 70 prints per day. The worker presented to medical personnel with intermittent abdominal pain, gastrointestinal distress and weight loss. Large agglomerates of NP, with primary sizes in the 30-70 nm range and consistent in size with PEPs, was found in the peritoneum of the subject, which was confirmed by SEM with EDX analysis. Upon auscultation, there were no abnormalities observed in lung function; therefore, no further investigation was performed. The authors from the study believed that the deposition of the carbon NP and translocation via the lymph nodes was a contributory agent in this work-related illness (Theegarten et al. 2010).
Epidemiological studies
Beyond MCR, at least one cross sectional survey of PC workers shows an increase of self-reported symptoms that include rhinorrhea, allergic rhinitis, cough and sinusitis (Dutta and Deka 2012). The results are consistent with our observations through casual communication with PC workers and managers that the most common complaints from this group are headache, upper respiratory irritation, and epiphora (overflow of tears onto the face) (Khatri et al. 2017, Luca and Maes, 2013). Workplace studies, such as that by Goud et al. (2001) reported a significant increase in DNA damage measured by the comet assay in photocopy center workers compared to unexposed controls. In a follow-up study, Goud et al. studied the genotoxic effects of PC emissions on 98 healthy full-time PC center workers. The authors found a significant increase of micronuclei in buccal epithelial cell and blood lymphocytes in addition to increased frequency in chromosomal aberrations among exposed workers compared to study controls (Goud et al. 2004). Studies published soon after Goud’s arrived to similar conclusions (Gadhia et al. 2005). Further, other studies found a potential synergistic relationship between PC emissions and smoking, and that chromosomal aberrations are related to the duration of exposure and years of service (Balakrishnan and Das 2010). An investigation targeted to oxidative and genotoxic damage in workers at photocopy centers processing 32,000 sheets of paper each 8-hour working day was done by (Kleinsorge et al. 2011). The authors measured catalase activity (CAT), reduced vs. oxidized glutathione ratio (GSH/GSSG), level of lipid peroxidation (TBARS), damage index by Comet assay (DICA), and buccal cells with micronuclei (BCMN). Results showed that exposed PC operators exhibited increased TBARS, DICA and BCMN numbers, consistent with earlier studies on oxidative stress.
It is important to emphasize that all these studies provided no quantitative exposure information, other than a categorical classification ‘yes/no’ to working in a photocopy center. Therefore, it is difficult to ascertain if effects were caused by NP from PC or other exposures, even though such as assumption is not unreasonable.
Khatri et al. (2013) conducted a controlled study where 9 healthy volunteers, who served as their own controls, were exposed to emissions from PC for a day (6 hours). Several biomolecular markers of inflammation were measured in the nasal lavage and urine, before exposure, at the end of exposure, as well as 24- and 36 hours pre-exposure. Authors measured PM, VOC and O3 concentrations during the exposure and observed a significant increase for several pro-inflammatory markers in nasal lavage, total protein (2.25 fold), infiltrated neutrophils (2.66 fold), as well as 10 pro-inflammatory cytokines (IL-6, IL-8, TNF, IL-1β, GC-CSF, EGF, IL-10, MCP-1, fractalkine, VEGF) in post-exposure measurements when compared to pre-exposure measurements. While most markers would return to baseline pre-exposure levels within 24 hours, 4 cytokines (IL-6, IL-8, EGF, fractalkine) remained significantly higher 36 hours post-exposure than pre-exposure measurements. Similarly, a significant increase in the level of 8-oxodG concentrations in urine was observed post-exposure relative to controls and pre-exposure, which returned to baseline levels after 24 hours. These markers did not change with time in the control group and were not significantly different from the pre-exposure levels. The study overall established that emissions from photocopiers induced upper airway inflammation and systemic oxidative stress.
The marker 8-oxodG is commonly regarded in the published literature as a biomarker of oxidatively damaged DNA and assumed to originate from excise repair of damaged DNA. Its precise origin is not fully documented, and diet and cell turnover have been ruled out (Evans et al. 2016). The authors could not establish whether 8-oxodG derives from the 2′-deoxyribonucleotide pool, and conclude that: “8-ox-odGuo is most accurately described as a non-invasive biomarker of oxidative stress derived from oxidatively generated damage to 2′-deoxyguanosine.” It should be further noted that for obvious reasons (ease of use and low cost), 8-oxodG in urine is often measured with commercially available ELISA kits and this includes almost all studies mentioned above. Such kits are susceptible to interferences and tend to generate much more variable and higher results relative to the more robust liquid chromatography/tandem mass spectrometry techniques, which should be the preferred analytical method for this 8-oxodG (Barregard et al. 2013, Ellegaard and Poulsen 2016) and other biomarkers.
Elango et al. (2013) conducted a more detailed survey in copier operators in India. The authors collected information on the respiratory symptoms (via symptoms questionnaires), measured lung function by spirometry, and conducted comprehensive blood biochemistry. Among various markers in blood, they measured hematocrit, total protein, oxidative stress (Ferric Reducing Antioxidant Capacity of Serum (FRAC), serum TBARS, glutathione peroxidase and myeloperoxidase), as well as several inflammatory and cardiovascular markers, including leukotriene B4 (LTB4), 8-Isoprostane, C-Reactive protein (CRP), IL-8, Intercellular Adhesion Molecule 1 (ICAM-1), Clara cell protein (CC-16), and Eosinophilic Cationic Protein (ECP). The authors reported significantly higher prevalence of nasal blockage, cough, excessive sputum production, and breathing difficulties in copier operators relative to controls. Several serum markers confirmed elevated oxidative stress in copier operators. Additionally, serum TBARS were significantly higher in copier operators than controls. Similarly, the FRAC was lower in copier operators than controls. Plasma ICAM, IL-8, and LTB4 were also higher in copier operators relative to controls. Among several blood parameters, authors also found higher hematocrit values for copier operators, and a lower albumin to globin ratio. However, lung function tests and other biomarkers in plasma/serum were not statistically different from controls. Although authors measured numerous air pollutants, including PM2.5 and PM1.0, they did not measure the most important exposure component - PC-emitted nanoparticles and their chemistry. In 2015, Awodele et al. performed a study in Nigeria evaluating the level of oxidative stress markers, PAH and other hematological parameters in PC operators. The authors concluded there was a significant increase in the levels of various oxidative stress markers in the blood of PC operators when compared to unexposed controls. However, white blood cell differentials remained unchanged across the two subject groups. Additionally, Karimi et al. (2016)_recently published a cross-sectional study of respiratory symptoms and lung function in 150 copier operators and 114 controls in Iran. The respiratory symptoms were measured via a questionnaire, whereas spirometry was used to assess lung function using forced expiratory volume in 1 second (FEV1), forced vital capacity (FVC), and FEV1/FVC ratio. The authors found significantly higher cough (odds ratio, OR, of 2.6) and wheezing (OR 3) in copier operators relative to controls. All other respiratory symptoms, except for shortness of breath, were also more prevalent in copier operators. Lung function capacity (FEV1 and FVC) was also reduced in copier operators relative to controls. Of note, this study lacked any quantitative exposure information or exposure histories.
A relevant cross-sectional epidemiological study is one performed by Yang and Haung (2008) in Taiwan, which investigated the prevalence of chronic respiratory symptoms and acute irritative symptoms among 74 photocopy workers (exposure group) and 69 controls (employees of optical stores). The authors reported a higher, albeit statistically insignificant, rates of chronic cough (adjusted OR 2.9), wheezing (adjusted OR 1.9), chronic bronchitis (adjusted OR 2.2), and dyspnea (3.1) in the copy center workers. It must be noted, however, that the study had no exposure information available since the objective of the study was solely on identifying whether VOC was the trigger agent, rather than the emitted NP.
There is a need for a large-scale human epidemiological or mechanistic study assessing exposures from engineered nanomaterials released from TPE. Such comprehensive studies can enhance our understanding on nano-bio interactions and the potential environmental implications of exposure to emissions from this unique NEP. Further, it is worth highlighting the observed agreement amongst the toxicological findings described in this review despite of the experimental model used, which points to a common outcome: upper airway inflammation, that could potentially lead to exacerbation of existing asthma in addition to potential cardiovascular effects.
Discussion
Potential health risks
There are dozens of reports in the literature documenting high exposure to nano-sized particles emitted from LP and PC in both consumer and occupational settings. Toxicological studies conducted across different test platforms-cell monoculture, cell co-culture, animal intratracheal instillation studies, human case reports, and limited epidemiological studies to date, provide compelling evidence in our opinion that emissions from LP and PC are indeed biologically active in that at the molecular/cellular level they trigger oxidative stress, inflammatory responses, likely DNA damage, and possible epigenetic effects. While such effects have been documented in cellular and animal studies, at somewhat high doses and possible dose rates (Baisch et al. 2014), similar effect have been documented using transcriptomics and cell co-cultures in a few studies even at low doses, comparable to doses currently experienced by workers and users of these technologies over a day or week. More importantly, studies from our group have shown good agreement in the inflammatory, oxidative stress, and cellular damage endpoints between in vitro, in vivo (rats) and in humans. Good concordance also exists in the biomolecular endpoints of systemic oxidative stress, inflammation, and respiratory symptoms (nasal blockage, cough, excessive sputum production, breathing difficulties, irritation of eyes and upper airways, headaches, dizziness, irritant and allergic rhinitis), and in some cases these symptoms were correlated in a quantitative fashion with duration of employment (Table 3). Elevated cardiovascular markers in one study (Elango et al. 2013, Table 3) also raise the possibility of cardiovascular disease, but this has not been looked at closely yet.
Familiarity with this technology seems to feed a sense of safety, one that is not supported by the existing exposure and toxicological findings: that exposures can be at times quite high; that exposure controls are practically non-existent, and indoor ventilation insufficient; and that the exposures are not benign, as we have discussed earlier. As air pollution research reminds us, one does not need continuous high exposures to become ill. Instead, chronic exposures, at low to moderate levels (averages of 10-30 particles/cm3), may be sufficient. Martin et al. (2017) documented 13 out of the 15 commercial photocopy centers in the greater Boston area have workstations that were positioned less than approximately 3 meters from the nearest TPE. Justified concern for exposure to PM and gaseous pollutants released during a print/photocopy job warrants both the design and implementation of both engineered and administrative controls, as well as the development of regulatory limits governing policy to mitigate exposures to building occupants and patrons.
To-date, risk assessments of inhaled NP from LP and PC are lacking, in part because the necessary data were not available. Hanninen et al. (2010) conducted a risk assessment of exposure to PM0.1 released by LP based on particle number and mass concentration, in addition to size distributions reported in a previous publication. The authors did not conduct their own physico-chemical analysis of TPE emissions, and such characterization became available years later. This was done at a time when the chemistry of these emissions was not understood and the black color of emissions and toners feed the assumption (we hear this often) that such emissions are carbon black. The authors made assumptions that LP emissions are expected to exhibit similar toxicological responses to CB or (urban) soot particles, which is not accurate. In fact, such risk assessment exercises could be quite problematic, because they make several inaccurate assumptions (chemical composition is inaccurate and disease endpoints may not be the more sensitive ones), which may lead to wrong conclusions - with bias in either direction (safe or not safe). The recently published (Sisler et al. 2015, Lu et al. 2015, Pirela et al. 2016) toxicological profiles of LP-emitted PM point to biological activity that is higher to that of mild steel welding fumes, as well as other metal oxide NP. Nevertheless, the authors found that using the relative added mortality risks based on particle number concentration and mass concentration as separate metrics corresponded to 34 and 14 excess annual deaths/million users in an office environment, respectively. Similarly, for home offices and casual consumer uses, the mortality risks were found to be 12 and 4 excess deaths/million users, respectively. The calculated excess mortality surpasses the acceptable risk level (1 death/million users) presently held by USEPA for hazardous waste sites. The excess mortality found in the Hanninen et al. (2009) study may be an underestimate given the limited available data at the time as well as the erroneous assumptions about the chemical composition of and toxicological properties of nanoscale emissions from LP.
Policy or regulations on laser-based printing technology
The authors are unaware of any existing policy, regulation or standard at the local, state or federal level that address PM emissions, emissions control, or emissions exposure to workers or the general public for such printing technology. Based on the increasing evidence in the medical case reports, toxicological and epidemiological literature, there is an emerging and apparent need to develop awareness programs informing workers, managers and patrons of the hazards; emissions controls for existing TPE; new printing technology; and possibly new indoor air quality guidelines that are protective to worker and public health in indoor micro-environments that house TPE (i.e., photocopy centers).
The exposure characterization data that have aggregated in the literature thus far paints a reasonably clear picture of the complex chemistry of TPE PM0.1 emissions. However, several reports indicate a large, yet unresolved, fraction of organic compounds that remain to be fully characterized. Based on this missing data, additional analytical assessment with a particular focus on the sVOC fraction of TPE PM0.1 is warranted. Filling in the organic data gap would enable researchers to construct a complete risk assessment using data collected within actual working offices and commercial PC centers.
There is a notable absence of data with respect to available and emerging control technology to mitigate PM emissions. To date, the authors are aware of only one study to evaluate controls that may be available to managers/owners, hygienists and health and safety practitioners. Wensing et al. (2008) showed commercially available filters retrofitted to the LP can reduce emissions to the indoor environment of up to 84%. Moreover, other controls such as local exhaust ventilation and isolation have not been evaluated in the LP or PC micro-environment as means to minimize exposures. Similarly, reformulation of toners to reduce toxicological properties of PM emissions might offer the toner industry a safer by design approach to address this issue.
The regulatory environment and indoor occupational exposure guidelines present in the United States, and presumably elsewhere, with respect to PM0.1 emissions from TPE are lacking. Generally speaking, both OSHA and USEPA have adopted provisions and recommendations developed by the American Society of Heating, Refrigerating, and Air-Conditioning Engineers (ASHRAE) with respect to indoor air quality, ventilation and comfort. Similarly, state and local agencies generally adopt ASHRAE standards on ventilation (ASHRAE 62.2-2010). The ASHRAE standard merely mentions PM as PM10 as a selected contaminant with a concentration of interest threshold of 50 μg/m3. Failing to bring attention to nano-sized PM fractions, particularly PM0.1, in the ASHRAE standards is a clear indication that ultrafine particles do not seem to be a priority pollutant in the indoor environment.
Conclusions
Presently, the available information clearly indicates substantial exposures to NP due to LP and PC use. Although toxicology and molecular epidemiology of these emissions warrants further research as outlined below, current state of evidence also warrants efforts towards exposure mitigation strategies. Martin et al. (2017) outlines a number of strategies and options to achieve this. The knowledge base for developing engineering solutions and the necessary tools are available. In the case of TPE emissions, besides developing effective control technologies on existing devices as outlined above, promotion of a new generation of clean printing and photocopying technologies, which are now commercially available, must be encouraged. Moreover, an awareness campaign to inform workers and the general public of the potential hazards associated with TPE use is also important. The indoor air quality guidelines for indoor spaces, which even when met don’t provide sufficient ventilation, should be revised to address this pollution source. Likewise, further research is needed to untangle contribution of the various organic and inorganic components of the TPE-emitted PM, as well as to identify possible chemical signature patterns and exposure markers for organics in the released pollutants. The catalytic role of metal oxide ENM in the formation of other pollutants is also suspected, given that such effects are known in air pollution research. Furthermore, these metal oxides may play an important role in the formation of ROS and oxidative stress, as well as in serving as condensation nuclei for organics. Transition metals corresponding to metal oxide ENM in toners may account from 2-10% of the airborne PM0.1 fraction.
Despite there being a growing database on in vitro and in vivo adverse effects (oxidative stress, inflammation, DNA damage, and respiratory disease such as cough, wheeze, increased sputum production, etc.) following exposure to emissions from TPE, there are still several questions regarding the toxicological mechanism/s of action of these particles, metal oxide ENM, and gaseous co-pollutants. Lastly, large-scale toxicological and epidemiological studies are warranted to understand potential disease development in chronically exposed populations of workers and consumers. Such studies should assess the impact of emissions from TPE on the respiratory (e.g., lung function, rhinitis), immune (allergies), cardiovascular, nervous system, and possibly liver.
It is of critical important that future studies do not repeat the same mistakes of past studies. With regards to cellular and animal testing, these include the use of TPE-emitted nanoparticles and not toners, dispersion and dosimetry considerations, in vitro and in vivo dose equivalency calculations, realistic dose ranges and dose rates, true sub-chronic and chronic inhalation studies in animals and a combination of biomolecular markers and histopathology of the target organs. The studies should also attempt to address directly quantitative links between biomolecular markers and disease development. As mentioned earlier, the use of ELISA kits for urinary 8- oxodG and other analytes, as well as global/non-specific assays such as TBAR and FRAC should be substituted with more specific markers, and measured whenever possible with liquid chromatography-mass spectrometry techniques.
Large-scale human epidemiological studies should first and foremost ensure good quality quantitative exposure assessment, lack of which has been one of the most common limitations of most studies to date. Personal nanoparticle monitors are now encouraged because they are now available. Furthermore, they should collect and report contextual information on exposures and activities; and quantify and verify health effects in a more objective manner rather than rely on self-reported symptoms. Most importantly, these studies should quantify prevalence of disease in such populations and strive to provide quantitate exposure-response analysis.
Acknowledgments
The authors would like to acknowledge the usefulness of the comments of the five reviewers who were selected by the editor and anonymous to the authors.
This work was supported in part by the National Institute for Occupational Safety and Health and the Consumer Protection Safety Commission (Grant 212-2012-M-51174), and the National Institute of Health (Grant HL007118). The authors have sole responsibility for the writing and content of the paper. The authors have sole responsibility for the conceptualization and conduct of the study and the conclusions and recommendations contained therein. None of the authors has appeared during the past 5 years in any legal or regulatory proceedings related to the contents of the paper.
List of abbreviations
- A549
Adenocarcinomic human alveolar basal epithelial cells
- ACH
Air changes per hour
- APS
Aerodynamic particle sizer
- ASHRAE
American Society of Heating, Refrigerating, and Air-Conditioning Engineers
- BCMN
Buccal cells with micronuclei
- bw
Body weight
- CAS8
Clustered Regularly Interspaced Short Palindromic Repeat-associated protein 8
- CAT
Catalase activity
- CB
Carbon black
- CC-16
Clara cell protein 16
- CMD
Count median diameter
- CPC
Condensation particle counter
- Cpd
Compound
- Cr
Chromium
- CRP
C-reactive protein
- DICA
Damage index by Comet assay
- Dnmt3a
DNA methylation machinery
- EC
Elemental carbon
- ECP
Eosinophilic Cationic Protein
- EDX
Energy dispersive x-ray spectroscopy
- EGF
Epidermal growth factor
- ELCR
Excess lifetime cancer risk
- ENM
Engineered nanomaterial
- Fe
Iron
- FEV1
Forced expiratory volume in 1 sec
- FGF
Fibroblast growth factor
- FRAC
Ferric Reducing Antioxidant Capacity of Serum
- FVC
Forced vital capacity
- GM-CSF
Granulocyte-macrophage colony-stimulating factor
- GSH/GSSG
Reduced vs. oxidized glutathione ratio
- GPX1
Glutathione Peroxidase 1
- HO1
Heme oxygenase 1
- IAQ
Indoor air quality
- ICAM-1
Intercellular Adhesion Molecule 1
- IFN
Interferon
- IL
Interleukin
- IP
Interferon γ-induced protein
- LDH
Lactate dehydrogenase
- LINE
Long interspersed nuclear element
- LP
Laser printer
- LTB4
Leukotriene B4
- MCP
Monocyte chemoattractant protein
- MCR
Medical case report
- MFP
Multifunction printer
- MTP
Macrophage inflammatory protein
- Mn
Manganese
- MPPD
Multiple particle path dosimetry
- NEP
Nano-enabled product
- Ni
Nickel
- NP
Nanoparticle
- O3
Ozone
- OC
Organic carbon
- OR
Odds ratio
- PAH
Polycyclic aromatic hydrocarbons
- PC
Photocopier
- PCM
Physico-chemical and morphological
- PEPs
Laser printer-emitted particles
- PM
Particulate matter
- PM0.1
Particulate matter <0.1 μm in diameter
- RANTES
Regulated on Activation, Normal T cell Expressed and Secreted
- RR
Risk ratio
- SDS
Safety data sheets
- Si
Silicon
- SOA
Secondary organic aerosols
- SOD1
Superoxide Dismutase 1
- STEM
Scanning and transmission electron microscopy
- SVOC
Semi-volatile organic compounds
- TBARS
Thiobarbituric acid reactive substances
- TD
Thermo-denuder
- TE
Transposable element
- THP-1
Human acute monocytic leukemia cell line
- Ti
Titanium
- TNC
Total number concentration
- TNF
Tumor necrosis factor
- TPE
Toner-based printing equipment
- tVOC
Total volatile organic compound
- UFP
Ultrafine particle (<0.1 μm in diameter)
- USEPA
United States Environmental Protection Agency
- VEGF
Vascular endothelial growth factor
- VOC
Volatile organic compound
- WHO
World Health Organization
- Zn
Zinc
Footnotes
Declaration of Interest
The authors report no conflict of interest relevant to this review article. The author’s affiliation is as shown on the cover page.
References
- Amaral S, de Carvalho J, Costa M, Pinheiro C. An Overview of Particulate Matter Measurement Instruments. Atmosphere. 2015 Sep;6:1327–1345. [Google Scholar]
- American Society of Heating R, and Air-Conditioning Engineers (ASHRAE) ASHRAE standard 62.2-2010. The Standards For Ventilation And Indoor Air Quality 2010 [Google Scholar]
- Anjilvel S, Asgharian B. A multiple-path model of particle deposition in the rat lung. Fundam Appl Toxicol. 1995 Nov;28:41–50. doi: 10.1006/faat.1995.1144. [DOI] [PubMed] [Google Scholar]
- Awodele O, Akindele AJ, Adebowale GO, Adeyemi OO. Polycyclic Aromatic Hydrocarbon, Haematological and Oxidative Stress Levels in Commercial Photocopier Operators In Lagos, Nigeria. Ghana Med J. 2015 Mar;49:37–43. doi: 10.4314/gmj.v49i1.7. [DOI] [PMC free article] [PubMed] [Google Scholar]
- Bai R, Zhang L, Liu Y, Meng L, Wang L, Wu Y, Li W, Ge C, Le Guyader L, Chen C. Pulmonary responses to printer toner particles in mice after intratracheal instillation. Toxicol Lett. 2010 Dec 15;199:288–300. doi: 10.1016/j.toxlet.2010.09.011. [DOI] [PubMed] [Google Scholar]
- Baisch BL, Corson NM, Wade-Mercer P, Gelein R, Kennell AJ, Oberdorster G, Elder A. Equivalent titanium dioxide nanoparticle deposition by intratracheal instillation and whole body inhalation: the effect of dose rate on acute respiratory tract inflammation. Part Fibre Toxicol. 2014 Jan 24;11:5. doi: 10.1186/1743-8977-11-5. [DOI] [PMC free article] [PubMed] [Google Scholar]
- Balakrishnan M, Das A. Chromosomal aberration of workers occupationally exposed to photocopying machines in Sulur, South India. International Journal of Pharma and Biosciences. 2010:1. [Google Scholar]
- Barregard L, Moller P, Henriksen T, Mistry V, Koppen G, Rossner P, Jr, Sram RJ, Weimann A, Poulsen HE, Nataf R, et al. Human and methodological sources of variability in the measurement of urinary 8-oxo-7,8-dihydro-2′-deoxyguanosine. Antioxid Redox Signal. 2013 Jun 20;18:2377–2391. doi: 10.1089/ars.2012.4714. [DOI] [PMC free article] [PubMed] [Google Scholar]
- Barrero-Moreno JM, Tirendi S, Reniero F, Giordano G, Kotzias D. Identification of 2,3-dimethyl-2,3-diisobutyl succinonitrile in laser printer emissions. Rapid Commun Mass Spectrom. 2008;22:471–476. doi: 10.1002/rcm.3386. [DOI] [PubMed] [Google Scholar]
- Barrese E, Gioffre A, Scarpelli M, Turbante D, Trovato R, Iavicoli S. Indoor Pollution in Work Office: VOCs, Formaldehyde and Ozone by Printer. Occupational Diseases and Environmental Medicine. 2014;2:49–55. [Google Scholar]
- Barthel M, Pedan V, Hahn O, Rothhardt M, Bresch H, Jann O, Seeger S. XRF-analysis of fine and ultrafine particles emitted from laser printing devices. Environ Sci Technol. 2011 Sep 15;45:7819–7825. doi: 10.1021/es201590q. [DOI] [PubMed] [Google Scholar]
- Bellmann B, Muhle H, Creutzenberg O, Dasenbrock C, Kilpper R, MacKenzie JC, Morrow P, Mermelstein R. Lung clearance and retention of toner, utilizing a tracer technique, during chronic inhalation exposure in rats. Fundam Appl Toxicol. 1991 Aug;17:300–313. doi: 10.1016/0272-0590(91)90220-x. [DOI] [PubMed] [Google Scholar]
- Bello D, Martin J, Santeufemio C, Sun Q, Lee Bunker K, Shafer M, Demokritou P. Physicochemical and morphological characterisation of nanoparticles from photocopiers: implications for environmental health. Nanotoxicology. 2013 Aug;7:989–1003. doi: 10.3109/17435390.2012.689883. [DOI] [PubMed] [Google Scholar]
- Burns P, Gerroir P, Mahabadi H, Patel R, Vanbesien D. Emulson/Aggregation Technology: A Process for PReparing Microspheres of Narro Polydispersity. European Cells and Materials. 2002;2002(3 Suppl 2):148–150. [Google Scholar]
- Byeon JH, Kim JW. Particle emission from laser printers with different printing speeds. Atmospheric Environment. 2012 Jul;54:272–276. [Google Scholar]
- Chua ML, Setyawati MI, Li H, Fang CH, Gurusamy S, Teoh FT, Leong DT, George S. Particulate matter from indoor environments of classroom induced higher cytotoxicity and leakiness in human microvascular endothelial cells in comparison with those collected from corridor. Indoor Air. 2016 Sep;23 doi: 10.1111/ina.12341. [DOI] [PubMed] [Google Scholar]
- Cohen J, Deloid G, Pyrgiotakis G, Demokritou P. Interactions of engineered nanomaterials in physiological media and implications for in vitro dosimetry. Nanotoxicology. 2013 Jun;7:417–431. doi: 10.3109/17435390.2012.666576. [DOI] [PMC free article] [PubMed] [Google Scholar]
- Cohen JM, DeLoid GM, Demokritou P. A critical review of in vitro dosimetry for engineered nanomaterials. Nanomedicine (Lond) 2015 Sep 30; doi: 10.2217/nnm.15.129. [DOI] [PubMed] [Google Scholar]
- Cohen JM, Derk R, Wang L, Godleski J, Kobzik L, Brain J, Demokritou P. Tracking translocation of industrially relevant engineered nanomaterials (ENMs) across alveolar epithelial monolayers in vitro. Nanotoxicology. 2014 Aug;8(Suppl 1):216–225. doi: 10.3109/17435390.2013.879612. [DOI] [PMC free article] [PubMed] [Google Scholar]
- D’Alessandro AD, Waldburg N, Boeckelmann I, Schreiber J. Coughing from Copiers? Workplace Induced Chronic Cough after Exposure to Laser Printer Exhaust. J Allergy Ther. 2013;4:2. [Google Scholar]
- DeLoid G, Cohen JM, Darrah T, Derk R, Rojanasakul L, Pyrgiotakis G, Wohlleben W, Demokritou P. Estimating the effective density of engineered nanomaterials for in vitro dosimetry. Nat Commun. 2014 Mar 28;5:3514. doi: 10.1038/ncomms4514. [DOI] [PMC free article] [PubMed] [Google Scholar]
- DeLoid GM, Cohen JM, Pyrgiotakis G, Demokritou P. Preparation, characterization, and in vitro dosimetry of dispersed, engineered nanomaterials. Nat Protoc. 2017 Feb;12:355–371. doi: 10.1038/nprot.2016.172. [DOI] [PMC free article] [PubMed] [Google Scholar]
- DeLoid GM, Cohen JM, Pyrgiotakis G, Pirela SV, Pal A, Liu J, Srebric J, Demokritou P. Advanced computational modeling for in vitro nanomaterial dosimetry. Part Fibre Toxicol. 2015 Oct 24;12:32. doi: 10.1186/s12989-015-0109-1. [DOI] [PMC free article] [PubMed] [Google Scholar]
- Demokritou P, Gass S, Pyrgiotakis G, Cohen JM, Goldsmith W, McKinney W, Frazer D, Ma J, Schwegler-Berry D, Brain J, et al. An in vivo and in vitro toxicological characterisation of realistic nanoscale CeO(2) inhalation exposures. Nanotoxicology. 2013 Dec;7:1338–1350. doi: 10.3109/17435390.2012.739665. [DOI] [PMC free article] [PubMed] [Google Scholar]
- Demokritou P, Kavouras IG, Harrison D, Koutrakis P. Development and evaluation of an impactor for a PM2.5 speciation sampler. J Air Waste Manag Assoc. 2001 Apr;51:514–523. doi: 10.1080/10473289.2001.10464296. [DOI] [PubMed] [Google Scholar]
- Dutta U, Deka M. Case studies on the risk assessment of hazardous effect of photocopier machine in Guwahati city, India. The Clarion. 2012;1 [Google Scholar]
- Elango N, Kasi V, Vembhu B, Poornima J. Chronic exposure to emissions from photocopiers in copy shops causes oxidative stress and systematic inflammation among photocopier operators in India. Environmental Health. 2013;12:78. doi: 10.1186/1476-069X-12-78. [DOI] [PMC free article] [PubMed] [Google Scholar]
- Ellegaard PK, Poulsen HE. Tobacco smoking and oxidative stress to DNA: a meta-analysis of studies using chromatographic and immunological methods. Scand J Clin Lab Invest. 2016;76:151–158. doi: 10.3109/00365513.2015.1127407. [DOI] [PubMed] [Google Scholar]
- Evans MD, Mistry V, Singh R, Gackowski D, Rozalski R, Siomek-Gorecka A, Phillips DH, Zuo J, Mullenders L, Pines A, et al. Nucleotide excision repair of oxidised genomic DNA is not a source of urinary 8-oxo-7,8-dihydro-2′-deoxyguanosine. Free Radic Biol Med. 2016 Oct;99:385–391. doi: 10.1016/j.freeradbiomed.2016.08.018. [DOI] [PubMed] [Google Scholar]
- Furukawa Y, Aizawa Y, Okada M, Watanabe M, Niitsuya M, Kotani M. Negative effect of photocopier toner on alveolar macrophages determined by in vitro magnetometric evaluation. Ind Health. 2002 Apr;40:214–221. doi: 10.2486/indhealth.40.214. Epub 2002/06/18. [DOI] [PubMed] [Google Scholar]
- Gadhia PK, Patel D, Solanki KB, Tamakuwala DN, Pithawala MA. A preliminary cytogenetic and hematological study of photocopying machine operators. Indian Journal of Occupational and Environmental Medicine. 2005;9:22. [Google Scholar]
- Géhin E, Ramalho O, Kirchner S. Size distribution and emission rate measurement of fine and ultrafine particle from indoor human activities. Atmospheric Environment. 2008;42:8341–8352. 11// [Google Scholar]
- Gminski R, Decker K, Heinz C, Seidel A, Konczol M, Goldenberg E, Grobety B, Ebner W, Giere R, Mersch-Sundermann V. Genotoxic effects of three selected black toner powders and their dimethyl sulfoxide extracts in cultured human epithelial A549 lung cells in vitro. Environ Mol Mutagen. 2011;52:296–309. doi: 10.1002/em.20621. [DOI] [PubMed] [Google Scholar]
- Goud KI, Hasan Q, Balakrishna N, Rao KP, Ahuja YR. Genotoxicity evaluation of individuals working with photocopying machines. Mutat Res. 2004 Oct 10;563:151–158. doi: 10.1016/j.mrgentox.2004.07.001. [DOI] [PubMed] [Google Scholar]
- Goud KI, Shankar B, Vijayashree B, Ahuja YR. DNA damage and repair studies in individuals working with photocopying machines. Int J Hum Genet. 2001;1:139–143. [Google Scholar]
- Grassian VH, Haes AJ, Mudunkotuwa IA, Demokritou P, Kane AB, Murphy CJ, Hutchison JE, Isaacs JA, Jun Y-S, Karn B, et al. NanoEHS - defining fundamental science needs: no easy feat when the simple itself is complex. Environ Sci: Nano. 2016;3:15–27. [Google Scholar]
- Hanninen O, Bruske-Hohlfeld I, Loh M, Stoeger T, Kreyling W, Schmid O, Peters A. Occupational and consumer risk estimates for nanoparticles emitted by laser printers. Journal of Nanoparticle Research. 2009;12:91–99. [Google Scholar]
- Harrison J, Pickering CAC, Faragher EB, Austwick PKC, Little SA, Lawton L. An investigation of the relationship between microbial and particulate indoor air pollution and the sick building syndrome. Respiratory Medicine. 1992;86:225–235. doi: 10.1016/s0954-6111(06)80060-0. [DOI] [PubMed] [Google Scholar]
- He C, Morawska L, Taplin L. Particle emission characteristics of office printers. Environ Sci Technol. 2007 Sep 01;41:6039–6045. doi: 10.1021/es063049z. [DOI] [PubMed] [Google Scholar]
- He C, Morawska L, Wang H, Jayaratne R, McGarry P, Richard Johnson G, Bostrom T, Gonthier J, Authemayou S, Ayoko G. Quantification of the relationship between fuser roller temperature and laser printer emissions. Journal of Aerosol Science. 2010;41:523–530. [Google Scholar]
- Hsieh SF, Bello D, Schmidt DF, Pal AK, Stella A, Isaacs JA, Rogers EJ. Mapping the biological oxidative damage of engineered nanomaterials. Small. 2013 May 27;9:1853–1865. doi: 10.1002/smll.201201995. [DOI] [PubMed] [Google Scholar]
- Hsu DJ, Huang HL, Chien CH, Lin TS. Potential exposure to VOCs caused by dry process photocopiers: results from a chamber study. Bull Environ Contam Toxicol. 2005 Dec;75:1150–1155. doi: 10.1007/s00128-005-0869-7. [DOI] [PubMed] [Google Scholar]
- Jayaratne ER, Ling X, He C, Morawska L. Monitoring charged particle and ion emissions from a laser printer. Journal of Electrostatics. 2012;70:333–338. [Google Scholar]
- Jones AP. Indoor air quality and health. Atmospheric Environment. 1999;33:4535–4564. [Google Scholar]
- Kagi N, Fujii S, Horiba Y, Namiki N, Ohtani Y, Emi H, Tamura H, Kim YS. Indoor air quality for chemical and ultrafine particle contaminants from printers. Building and Environment. 2007;42:1949–1954. [Google Scholar]
- Karimi A, Eslamizad S, Mostafaee M, Momeni Z, Ziafati F, Mohammadi S. Restrictive Pattern of Pulmonary Symptoms among Photocopy and Printing Workers: A Retrospective Cohort Study. J Res Health Sci. 2016 Spring;16:81–84. [PMC free article] [PubMed] [Google Scholar]
- Khatri M, Bello D, Gaines P, Martin J, Pal AK, Gore R, Woskie S. Nanoparticles from photocopiers induce oxidative stress and upper respiratory tract inflammation in healthy volunteers. Nanotoxicology. 2013 Aug;7:1014–1027. doi: 10.3109/17435390.2012.691998. [DOI] [PubMed] [Google Scholar]
- Khatri M, Bello D, Pal AK, Cohen JM, Woskie S, Gassert T, Lan J, Gu AZ, Demokritou P, Gaines P. Evaluation of cytotoxic, genotoxic and inflammatory responses of nanoparticles from photocopiers in three human cell lines. Part Fibre Toxicol. 2013 Aug 22;10:42. doi: 10.1186/1743-8977-10-42. [DOI] [PMC free article] [PubMed] [Google Scholar]
- Khatri M, Bello D, Pal AK, Woskie S, Gassert TH, Demokritou P, Gaines P. Toxicological effects of PM0.25-2.0 particles collected from a photocopy center in three human cell lines. Inhal Toxicol. 2013 Sep;25:621–632. doi: 10.3109/08958378.2013.824525. [DOI] [PubMed] [Google Scholar]
- Kleinsorge EC, Erben M, Galan MG, Barison C, Gonsebatt ME, Simoniello MF. Assessment of oxidative status and genotoxicity in photocopier operators: a pilot study. Biomarkers. 2011 Dec;16:642–648. doi: 10.3109/1354750X.2011.620744. [DOI] [PubMed] [Google Scholar]
- Konczol M, Weiss A, Gminski R, Merfort I, Mersch-Sundermann V. Oxidative stress and inflammatory response to printer toner particles in human epithelial A549 lung cells. Toxicol Lett. 2013 Feb 04;216:171–180. doi: 10.1016/j.toxlet.2012.11.018. [DOI] [PubMed] [Google Scholar]
- Konduru NV, Jimenez RJ, Swami A, Friend S, Castranova V, Demokritou P, Brain JD, Molina RM. Silica coating influences the corona and biokinetics of cerium oxide nanoparticles. Part Fibre Toxicol. 2015 Oct 12;12:31. doi: 10.1186/s12989-015-0106-4. [DOI] [PMC free article] [PubMed] [Google Scholar]
- Konduru NV, Murdaugh KM, Sotiriou GA, Donaghey TC, Demokritou P, Brain JD, Molina RM. Bioavailability, distribution and clearance of tracheally-instilled and gavaged uncoated or silica-coated zinc oxide nanoparticles. Part Fibre Toxicol. 2014 Sep 03;11:44. doi: 10.1186/s12989-014-0044-6. [DOI] [PMC free article] [PubMed] [Google Scholar]
- Konduru NV, Murdaugh KM, Swami A, Jimenez RJ, Donaghey TC, Demokritou P, Brain JD, Molina RM. Surface modification of zinc oxide nanoparticles with amorphous silica alters their fate in the circulation. Nanotoxicology. 2016 Aug;10:720–727. doi: 10.3109/17435390.2015.1113322. [DOI] [PMC free article] [PubMed] [Google Scholar]
- Kreyling WG, Möller W, Semmler-Behnke M, Oberdörster G. Particle Toxicology. Boca Raton: Francis Croup; 2007. Particle dosimetry: deposition and clearance from the respiratory tract and translocation towards extra-pulmonary sites. [Google Scholar]
- Kreyling WG, Semmler-Behnke M, Seitz J, Scymczak W, Wenk A, Mayer P, Takenaka S, Oberdorster G. Size dependence of the translocation of inhaled iridium and carbon nanoparticle aggregates from the lung of rats to the blood and secondary target organs. Inhal Toxicol. 2009 Jul;21(Suppl 1):55–60. doi: 10.1080/08958370902942517. [DOI] [PubMed] [Google Scholar]
- Lee C-W, Hsu DJ. Measurements of fine and ultrafine particles formation in photocopy centers in Taiwan. Atmospheric Environment. 2007;41:6598–6609. 10// [Google Scholar]
- Lee CW, Dai YT, Chien CH, Hsu DJ. Characteristics and health impacts of volatile organic compounds in photocopy centers. Environ Res. 2006 Feb;100:139–149. doi: 10.1016/j.envres.2005.05.003. [DOI] [PubMed] [Google Scholar]
- Lee S, Sohal IS, Therrien MA, Pal AK, Bello D, Shea TB. Additive Impairment of Synaptic Signaling in Cultured Cortical Neurons by Exogenously-Applied Oligomerized Amyloid-beta and Airborne Nanoparticles Generated during Photocopying. Journal of Alzheimer’s disease: JAD. 2015;47:49–54. doi: 10.3233/JAD-150099. Epub 2015/09/25. [DOI] [PubMed] [Google Scholar]
- Lee SC, Lam S, Kin Fai H. Characterization of VOCs, ozone, and PM10 emissions from office equipment in an environmental chamber. Building and Environment. 2001;36:837–842. 8// [Google Scholar]
- Lin GH, Mermelstein R. Acute toxicity studies of Xerox reprographic toners. International Journal of Toxicology. 1994;13:2–20. [Google Scholar]
- Lu X, Miousse IR, Pirela SV, Melnyk S, Koturbash I, Demokritou P. Short-term exposure to engineered nanomaterials affects cellular epigenome. Nanotoxicology. 2016;10:140–150. doi: 10.3109/17435390.2015.1025115. [DOI] [PMC free article] [PubMed] [Google Scholar]
- Martin J, Bello D, Bunker K, Shafer M, Christiani D, Woskie S, Demokritou P. Occupational exposure to nanoparticles at commercial photocopy centers. J Hazard Mater. 2015 Nov 15;298:351–360. doi: 10.1016/j.jhazmat.2015.06.021. [DOI] [PubMed] [Google Scholar]
- Martin J, Demokritou P, Woskie S, Bello D. Indoor Air Quality in Photocopy Centers, Nanoparticle Exposures at Photocopy Workstations, and the Need for Exposure Controls. The Annals of Occupational Hygiene. 2017;61:110–122. doi: 10.1093/annweh/wxw016. Epub 01 January 2017. [DOI] [PubMed] [Google Scholar]
- Morawska L, He C, Johnson G, Jayaratne R, Salthammer T, Wang H, Uhde E, Bostrom T, Modini R, Ayoko G, et al. An Investigation into the Characteristics and Formation Mechanisms of Particles Originating from the Operation of Laser Printers. Environmental Science & Technology. 2009;43:1015–1022. doi: 10.1021/es802193n. 2011/10/14. [DOI] [PubMed] [Google Scholar]
- Morimoto Y, Oyabu T, Horie M, Kambara T, Izumi H, Kuroda E, Creutzenberg O, Bellmann B, Pohlmann G, Schuchardt S, et al. Pulmonary toxicity of printer toner following inhalation and intratracheal instillation. Inhal Toxicol. 2013 Oct;25:679–690. doi: 10.3109/08958378.2013.835010. [DOI] [PubMed] [Google Scholar]
- Muhle H, Bellmann B, Creutzenberg O, Dasenbrock C, Ernst H, Kilpper R, MacKenzie J, Morrow P, Mohr U, Takenaka S. Pulmonary response to toner upon chronic inhalation exposure in rats. Fundam Appl Toxicol. 1991;17:280–299. doi: 10.1016/0272-0590(91)90219-t. [DOI] [PubMed] [Google Scholar]
- Muhle H, Mermelstein R, Dasenbrock C, Takenaka S, Möhr U, Kilpper R, MacKenzie J, Morrow P. Lung response to test toner upon 2-year inhalation exposure in rats. Experimental pathology. 1989;37:239–242. doi: 10.1016/s0232-1513(89)80059-3. [DOI] [PubMed] [Google Scholar]
- Mullins BJ, Bertolatti D, Mead-Hunter R. Assessment of polyaromatic hydrocarbon emissions from laser printers. Atmospheric Environment. 2013;79:428–432. [Google Scholar]
- O’Rourke J, AuClair C, Renault J, Mahabadi H, Kmiecik-Lawrynowicz G, Lyons C. Xerox Corporation White Paper: Xerox Technology EA (Emulsion Aggregation) Toner. Rochester, New York: 2003. Nanotechnology; [cited October 20, 2011 2011]. Available from http://www.osha.gov/dsg/nanotechnologv/nanotechnology.html. [Google Scholar]
- Pal AK, Bello D, Cohen J, Demokritou P. Implications of in vitro dosimetry on toxicological ranking of low aspect ratio engineered nanomaterials. Nanotoxicology. 2015;9:871–885. doi: 10.3109/17435390.2014.986670. [DOI] [PMC free article] [PubMed] [Google Scholar]
- Pal AK, Watson CY, Pirela SV, Singh D, Chalbot MC, Kavouras I, Demokritou P. Linking Exposures of Particles Released From Nano-Enabled Products to Toxicology: An Integrated Methodology for Particle Sampling, Extraction, Dispersion, and Dosing. Toxicol Sci. 2015 Aug;146:321–333. doi: 10.1093/toxsci/kfv095. [DOI] [PMC free article] [PubMed] [Google Scholar]
- Pirela S, Molina R, Watson C, Cohen JM, Bello D, Demokritou P, Brain J. Effects of copy center particles on the lungs: a toxicological characterization using a Balb/c mouse model. Inhal Toxicol. 2013 Aug;25:498–508. doi: 10.3109/08958378.2013.806614. [DOI] [PMC free article] [PubMed] [Google Scholar]
- Pirela SV, Lu X, Miousse I, Sisler JD, Qian Y, Guo N, Koturbash I, Castranova V, Thomas T, Godleski J, et al. Effects of intratracheally instilled laser printer-emitted engineered nanoparticles in a mouse model: A case study of toxicological implications from nanomaterials released during consumer use. NanoImpact. 2016 Jan;1:1–8. doi: 10.1016/j.impact.2015.12.001. [DOI] [PMC free article] [PubMed] [Google Scholar]
- Pirela SV, Miousse IR, Lu X, Castranova V, Thomas T, Qian Y, Bello D, Kobzik L, Koturbash I, Demokritou P. Effects of Laser Printer-Emitted Engineered Nanoparticles on Cytotoxicity, Chemokine Expression, Reactive Oxygen Species, DNA Methylation, and DNA Damage: A Comprehensive in Vitro Analysis in Human Small Airway Epithelial Cells, Macrophages, and Lymphoblasts. Environ Health Perspect. 2016 Feb;124:210–219. doi: 10.1289/ehp.1409582. [DOI] [PMC free article] [PubMed] [Google Scholar]
- Pirela SV, Pyrgiotakis G, Bello D, Thomas T, Castranova V, Demokritou P. Development and characterization of an exposure platform suitable for physico-chemical, morphological and toxicological characterization of printer-emitted particles (PEPs) Inhal Toxicol. 2014 Jun;26:400–408. doi: 10.3109/08958378.2014.908987. [DOI] [PMC free article] [PubMed] [Google Scholar]
- Pirela SV, Sotiriou GA, Bello D, Shafer M, Bunker KL, Castranova V, Thomas T, Demokritou P. Consumer exposures to laser printer-emitted engineered nanoparticles: A case study of life-cycle implications from nano-enabled products. Nanotoxicology. 2015;9:760–768. doi: 10.3109/17435390.2014.976602. [DOI] [PMC free article] [PubMed] [Google Scholar]
- Rappaport SM, Kupper LL. Quantitative exposure assessment El Cerrito, CA 2008 [Google Scholar]
- Reilly ED. Milestones in Computer Science and Information Technology. Greenwood Publishing; Group Inc: 2003. [Google Scholar]
- Salthammer T, Schripp T, Uhde E, Wensing M. Aerosols generated by hardcopy devices and other electrical appliances. Environ Pollut. 2012 Oct;169:167–174. doi: 10.1016/j.envpol.2012.01.028. [DOI] [PubMed] [Google Scholar]
- Schripp T, Wensing M, Uhde E, Salthammer T, He C, Morawska L. Evaluation of Ultrafine Particle Emissions from Laser Printers Using Emission Test Chambers. Environmental Science & Technology. 2008;42:4338–4343. doi: 10.1021/es702426m. 2011/10/14. [DOI] [PubMed] [Google Scholar]
- Semmler-Behnke M, Fertsch S, Schmid O, Wenk A, Kreyling WG. Uptake of 1.4 mm versus 18 mm gold particles by secondary target organs is size dependent in control and pregnants rats after intertracheal or intravenoiz application. Euro Nanoforum - Nanotechnology in Industrial Applications 2007 [Google Scholar]
- Semmler-Behnke M, Kreyling WG, Lipka J, Fertsch S, Wenk A, Takenaka S, Schmid G, Brandau W. Biodistribution of 1.4- and 18-nm gold particles in rats. Small. 2008 Dec;4:2108–2111. doi: 10.1002/smll.200800922. [DOI] [PubMed] [Google Scholar]
- Setyawati MI, Tay CY, Docter D, Stauber RH, Leong DT. Understanding and exploiting nanoparticles’ intimacy with the blood vessel and blood. Chem Soc Rev. 2015 Nov 21;44:8174–8199. doi: 10.1039/c5cs00499c. [DOI] [PubMed] [Google Scholar]
- Sisler JD, Pirela SV, Friend S, Farcas M, Schwegler-Berry D, Shvedova A, Castranova V, Demokritou P, Qian Y. Small airway epithelial cells exposure to printer-emitted engineered nanoparticles induces cellular effects on human microvascular endothelial cells in an alveolar-capillary co-culture model. Nanotoxicology. 2015;9:769–779. doi: 10.3109/17435390.2014.976603. [DOI] [PMC free article] [PubMed] [Google Scholar]
- Sotiriou GA, Singh D, Zhang F, Chalbot MC, Spielman-Sun E, Hoering L, Kavouras IG, Lowry GV, Wohlleben W, Demokritou P. Thermal decomposition of nano-enabled thermoplastics: Possible environmental health and safety implications. J Hazard Mater. 2016 Mar 15;305:87–95. doi: 10.1016/j.jhazmat.2015.11.001. [DOI] [PMC free article] [PubMed] [Google Scholar]
- Sotiriou GA, Singh D, Zhang F, Wohlleben W, Chalbot MG, Kavouras IG, Demokritou P. An integrated methodology for the assessment of environmental health implications during thermal decomposition of nano-enabled products. Environ Sci Nano. 2015 Jun 01;2:262–272. doi: 10.1039/C4EN00210E. [DOI] [PMC free article] [PubMed] [Google Scholar]
- Stefaniak AB, Breysse PN, Murray MP, Rooney BC, Schaefer J. An evaluation of employee exposure to volatile organic compounds in three photocopy centers. Environ Res. 2000 Jun;83:162–173. doi: 10.1006/enrs.2000.4061. [DOI] [PubMed] [Google Scholar]
- Takenaka S, Karg E, Kreyling WG, Lentner B, Moller W, Behnke-Semmler M, Jennen L, Walch A, Michalke B, Schramel P, et al. Distribution pattern of inhaled ultrafine gold particles in the rat lung. Inhal Toxicol. 2006 Sep;18:733–740. doi: 10.1080/08958370600748281. [DOI] [PubMed] [Google Scholar]
- Tang T, Gminski R, Konczol M, Modest C, Armbruster B, Mersch-Sundermann V. Investigations on cytotoxic and genotoxic effects of laser printer emissions in human epithelial A549 lung cells using an air/liquid exposure system. Environ Mol Mutagen. 2012 Mar;53:125–135. doi: 10.1002/em.20695. [DOI] [PubMed] [Google Scholar]
- Tang T, Hurrabeta J, Gminski R, Mersch-Sundermann V. Fine and ultrafine particles emitted from laser printers as indoor air contaminants in German offices. Environ Sci Poll Res. 2011 doi: 10.1007/s11356-011-0647-5. [DOI] [PubMed] [Google Scholar]
- Theegarten D, Boukercha S, Philippou S, Anhenn O. Diagn Pathol. Vol. 5. Washington, DC: USEPA; 2010. Dec 02, Submesothelial deposition of carbon nanoparticles after toner exposition: case report; p. 77. Epub 2010/12/04. Building Assessment Survey and Evaluation (BASE) Study. Available from http://www.epa.gov/iaq/base/ [DOI] [PMC free article] [PubMed] [Google Scholar]
- Wang H, He C, Morawska L, McGarry P, Johnson G. Ozone-initiated particle formation, particle aging, and precursors in a laser printer. Environ Sci Technol. 2012 Jan 17;46:704–712. doi: 10.1021/es203066k. [DOI] [PubMed] [Google Scholar]
- Wang Z-M, Wagner J, Wall S. Characterization of Laser Printer Nanoparticle and VOC Emissions, Formation Mechanisms, and Strategies to Reduce Airborne Exposures. Aerosol Science and Technology. 2011;45:1060–1068. 2012/09/12. [Google Scholar]
- Watson-Wright C, Singh D, Demokritou P. Toxicological implications of released particulate matter during thermal decomposition of nano-enabled thermoplastics. NanoImpact. 2017;5:29–40. doi: 10.1016/j.impact.2016.12.003. 1// [DOI] [PMC free article] [PubMed] [Google Scholar]
- Wensing M, Schripp T, Uhde E, Salthammer T. Ultra-fine particles release from hardcopy devices: sources, real-room measurements and efficiency of filter accessories. Sci Total Environ. 2008 Dec 15;407:418–427. doi: 10.1016/j.scitotenv.2008.08.018. Epub 2008/09/24. Nanotechnology; [cited October 20, 2011 2011]. Available from http://www.who.int/foodsafety/biotech/nano/en/ [DOI] [PubMed] [Google Scholar]
- Yang CY, Haung YC. A cross-sectional study of respiratory and irritant health symptoms in photocopier workers in Taiwan. J Toxicol Environ Health. 2008;A.71:1314–1317. doi: 10.1080/15287390802240785. Epub 2008/08/08. [DOI] [PubMed] [Google Scholar]
- Yokel RA, Hussain S, Garantziotis S, Demokritou P, Castranova V, Cassee FR. The Yin: An adverse health perspective of nanoceria: uptake, distribution, accumulation, and mechanisms of its toxicity. Environ Sci Nano. 2014 Oct 01;1:406–428. doi: 10.1039/C4EN00039K. [DOI] [PMC free article] [PubMed] [Google Scholar]
- Zhou EH, Watson C, Pizzo R, Cohen J, Dang Q, Ferreira de Barros PM, Park CY, Chen C, Brain JD, Butler JP, et al. Assessing the impact of engineered nanoparticles on wound healing using a novel in vitro bioassay. Nanomedicine (Lond) 2014 Dec;9:2803–2815. doi: 10.2217/nnm.14.40. [DOI] [PMC free article] [PubMed] [Google Scholar]
- Zina AM, Fanan E, Bundino S. Allergic contact dermatitis from formaldehyde and quaternium-15 in photocopier toner. Contact Dermatitis. 2000 Oct;43:241–242. [PubMed] [Google Scholar]