

Abstract
Bacterial communities in the mouse caecum and faeces are known to be altered by changes in dietary fat. The microbiota of the mouse small intestine, by contrast, has not been extensively profiled and it is unclear whether small intestinal bacterial communities shift with dietary fat levels. We compared the microbiota in the small intestine, caecum and colon in mice fed a low-fat (LF) or high-fat (HF) diet using 16S rRNA gene sequencing. The relative abundance of major phyla in the small intestine, Bacteriodetes, Firmicutes and Proteobacteria, was similar to that in the caecum and colon; the relative abundance of Verrucomicrobia was significantly reduced in the small intestine compared to the large intestine. Several genera were uniquely detected in the small intestine and included the aerotolerant anaerobe, Lactobacillus spp. The most abundant genera in the small intestine were accounted for by anaerobic bacteria and were identical to those identified in the large intestine. An HF diet was associated with significant weight gain and adiposity and with changes in the bacterial communities throughout the intestine, with changes in the small intestine differing from those in the caecum and colon. Prominent Gram-negative bacteria including genera of the phylum Bacteroidetes and a genus of Proteobacteria significantly changed in the large intestine. The mechanistic links between these changes and the development of obesity, perhaps involving metabolic endotoxemia, remain to be determined.
Keywords: gut microbiome, mouse diet-induced obesity model, 16S rRNA gene sequencing, high-fat diet, metabolic endotoxaemia
Introduction
An emerging concept in obesity research is that the intestinal microbiota plays an important role in the development of obesity. Much of our understanding today rests on numerous studies involving the use of freshly passed faecal material from both humans and mice [1]. Indeed, rodent models have historically played a crucial role in understanding numerous aspects of human health and disease [2].
The bacterial content in the human intestine ranges from approximately 108 bacteria per gram dry weight in the ileal portion of the small intestine to more than 1010–11 bacteria per gram of faeces [3, 4]. The bacteria in the small intestine may be involved in nutrient sensing that potentially affects various host functions [5]. In humans, the predominant phyla in duodenal samples were accounted for by Firmicutes and Actinobacteria, while Bacteroidetes were not detected [6]. This distribution of phyla is distinctly different from the phyla found in both human and mouse faeces, which are mainly accounted for by Firmicutes and Bacteroidetes [7]. A second human study profiled bacterial communities in human ileostomy fluid and reported the presence of Streptococcus and Clostridium spp., members of the Firmicutes, and Escherichia coli, a member of the Proteobacteria [8]. There is only one description of bacterial communities in the small intestine of the mouse [9]. Firmicutes and Bacteroidetes were identified as the major phyla in the small intestine of the mouse; Verrucomicrobia were detected in the small intestine but only in irradiated mice.
In this study we compared the microbiota in the small intestine to that found in the caecum and colon. Mice are coprophagic and it is not known how this animal behaviour affects the distribution of intestinal microbiota in the intestinal tract. Additionally, we used the diet-induced obesity (DIO) mouse model to compare the microbiome in the small intestine to that found in two sections of the large intestine, the caecum and colon. Changes in faecal pellets have been described in mice fed a high-fat (HF) diet compared to controls [10, 11], and changes in the microbiota in caecal fluid are also reported in HF-fed mice [12]. Unlike earlier studies [10–12], the mice in the present study were fed matched semi-purified diets in terms of fat, carbohydrate and protein sources, varying only in fat and carbohydrate concentrations.
Methods
Animal and diets
Wild-type C57BL/6 male mice were obtained from Taconic Biosciences (Hudson, NY) at the age of 4 weeks. The animals were housed using conventional conditions with open shoe box cages and were provided with tap water and corn cob bedding (Bed O' Cob; Anderson’s Laboratory Bedding). The mice were placed in an animal room containing 350–400 mice. This room housed mice of various genotypes and multiple studies involving different diets. The mice were maintained on a 12 h light/dark cycle and allowed ab libitum access to standard rodent chow (Purina Laboratory Rodent Diet 5015). After a 1-week adaptation period, the mice were shifted to one of the following semipurified diets for 12 weeks: a low-fat (LF), high-carbohydrate diet (n=6) containing 10 kcal% fat or an HF, lower-carbohydrate diet (n=6) containing 45 kcal % fat. The fat sources in both diets were soybean oil and lard, and carbohydrate in the diets was supplied as cornstarch, maltodextrin and sucrose. Product numbers are D12450H (LF) and D12451 (HF), respectively (Research Diets, New Brunswick, NJ). Diet compositions are listed in Table S1 (available with the online Supplementary Material). The diets were balanced so that the differences between the LF and HF diets were the fat and carbohydrate levels, but the macronutrient sources were identical. The level of fat chosen, 45 kcal %, is used to promote obesity in mice [13] using physiologically relevant fat levels and without lowering carbohydrate to an extent that could promote ketogenesis [14]. The body weights were measured weekly, daily food intake and whole-body fat mass determined, and euthanasia performed as described [15]. The studies were approved by and conducted in accordance with Rutgers University Institutional Animal Care and Use Committee policies.
Preparation of intestinal contents
The intestine from the stomach to the anus was removed intact and placed on a sterile Petri plate. Using sterile instruments and starting at the stomach, the intestine was cut into three portions consisting of the entire small intestine, caecum and colon. The contents of each section were collected by manually massaging the intestine, collecting the contents into DNase, RNase-free tubes. Immediately after collection, the tubes were flash-frozen in liquid nitrogen and stored at −80 °C for further analysis.
16S rRNA gene library preparation, sequencing and bioinformatics
To standardize post-necropsy variables which might affect sequencing results [16], protocols to extract the bacterial DNA from the intestinal samples, the sequencing and bioinformatics protocols used to analyse samples are described. Bacterial DNA was isolated from the intestinal samples using a QIAamp DNA Stool Mini Kit’s Stool Pathogen detection protocol (Qiagen, Valencia, CA) with mechanical breakage. Extractions were performed in batches of 24 samples. The following alterations were applied in order to increase DNA yield: (1) samples were incubated at 95 °C for 5 min in Qiagen ASL lysis buffer, provided with the kit. In order to avoid popping of the lids during 95 °C incubation, weight was applied to the tubes using metal heating blocks. The suspension was subjected to vortexing at maximum speed every 2 min for 5 min during incubation to improve cell lysis. All samples were tightly secured between two plastic tube racks and vortexed simultaneously using a benchtop vortexer. (2) Elution buffer was heated at 55 °C and DNA elution was performed in two steps of 100 µl each. Extracted DNA was concentrated by bead purification using 1.8× volume RNA Clean XP beads (Beckman Coulter) and re-eluted in 60 µl of 10 mM TE buffer, pH 8.5. PCR assays were performed to verify the presence of bacterial DNA in the extracts using ‘all bacteria' primers as described previously [17].
Sequencing libraries were constructed using a two-stage PCR approach [18] with 40 ng DNA from colon and caecum samples, and 100 ng from small intestine samples. The amplicon primers utilized in stage 1 contained both a gene-specific sequence as well as an Illumina overhang adapter sequence. The gene-specific sequence, designed to amplify the V3 and V4 hypervariable regions of the 16S rRNA gene, were chosen as suitable primers for diversity studies [19]. Illumina overhangs created universal binding sites for the stage 2 PCR, which attached dual indices and Illumina sequencing adapters using the Illumina Nextera XT Index Kit. Final library constructs were suitable for multiplexed sequencing on the Illumina MiSeq platform.
Bacterial DNA from the three sections of the intestine was tested for reactivity with a universal bacterial primer [20] and the V3_V4 sequencing primer. All DNA extracts from the samples yielded a PCR product of the correct size with the universal bacterial primers, as well as with the sequencing primer in the case of the extracts produced from the caecum and colon (data not shown). The samples generated from the small intestine exhibited different responses to the sequencing primers; only four out of six samples from the LF- and HF-fed animals yielded PCR products of the expected size (data not shown).
The generated sequences were evaluated using the Illumina MiSeq Reporter Metagenomics Workflow version 2 (analysis software version: 2.4.60.8; reference taxonomy file: gg_13_5_species_32 bp.dat) [21]. The identification step used the Classify Reads algorithm developed by Illumina that provides taxa level classification for paired-end reads. This process involves matching short subsequences of the reads (called words) against the Greengenes database of 16S rRNA gene reference sequences. The accumulated word matches for each read were used to assign reads to the taxonomic classification. The similarity cut-offs of the matches at the taxa levels were 98.24 % at species, 99.65 % at genus and 100 % at phylum [22]. Any sequences remaining unmatched were labelled as unclassified. Sequence data have been uploaded to the NCBI Short Read Archive (SRA) database under accession number SRP066846.
The number of reads passing quality filtering showed that, within each set of samples generated from the three intestinal sections, the number of accepted reads did not differ significantly between LF- and HF-fed animals (Table S2). The average number of reads passing quality filter in all samples was 77 %, and was used to classify the reads to the phylum, genus and species taxon level. The number of reads classified to the phylum, genus and species level was 97, 86 and 46 %, respectively. The relative abundance of the operational taxonomic units (OTUs) identified to the phylum and genus levels in the individual mice is presented in Table S3(a–b).
Analysis of taxa output data
The Illumina Workflow system provides numeric results listing the taxa identification associated with the number of reads detected and the percentage of total reads. At the phylum and genus level, assigned reads reaching ≥0.1 % of the total reads were selected for analysis. For specific genera identified, species were identified. For the HF-fed mice, an average value of the percentage of total reads was determined and compared to the corresponding value from the LF-fed mice. Average values with differences of ≥twofold were analysed for statistical significance using Student's t-test [17].
Statistical analysis
Student's t-test was performed using the numeric values representing weight gained, the percentage of classified sequence reads and the plasma biomarker, leptin. The statistical software in Sigma Plot version 11.0 was used (Systat Software, San Jose, CA). Normality was investigated using the Shapiro–Wilk test; in cases where the test for normality passed, the mean was determined and the values of the control, LF-fed mice and HF-fed mice were compared. A difference of mean with a P-value ≤0.05 was considered statistically significant. The Shannon–Wiener index for genus-level diversity was calculated in Microsoft Excel, where p represents the number of genera in a sample divided by a total number of genera in a sample [23].
Plasma biomarker measurements
Plasma samples were screened for leptin as a marker of obesity using an immunoassay [24]. The modified mouse metabolic hormone kit, MMHMAG-44K, on a Millipore MagPix (Life Technologies, Grand Island, NY) system was used according to the manufacturer’s protocols.
Results
Effect of HF diet on weight gain and adiposity
Mice fed an HF diet over 12 weeks gained significantly more weight compared to those fed a matched LF diet (Fig. S1) (weight gain±standard deviation: LF 12.5±2.54 g; HF 23.4±1.9 g; P=0.0008). The two sets of animals consumed identical amounts of food (Fig. S2). Following 12 weeks of HF feeding, mice had a significantly greater fat mass percentage compared to LF-fed mice (means of % fat mass: LF 25; HF 42; P<0.001). Blood levels of leptin were significantly higher in HF-fed compared to LF-fed mice (mean pg ml−1 blood: LF 4.6±1.72; HF 16.8±6.5; P=0.0001).
Bacterial phyla in the small intestine compared to the large intestine
The intestinal microbiota at the phylum level included Actinobacteria, Bacteroidetes, Chloroflexi, Cyanobacteria, Deferribacteres, Firmicutes, Proteobacteria, Synergistetes, Tenericutes and Verrucomicrobia. Sequences that accounted for ≥1 % of the total reads in the intestinal tract from the LF-fed mice were accounted for by the Gram-negative Bacteroidetes, Verrucomicrobia and Proteobacteria and the Gram-positive Firmicutes. The relative abundance ranging from highest to lowest in the small intestine was Bacteroidetes, Firmicutes, Proteobacteria and Verrucomicrobia. Comparison of the relative abundance for each of the most dominant phyla in the small intestine to those in the caecum and colon showed no significant differences in LF-fed mice except for Verrucomicrobia (Fig. 1) where the relative abundance of Verrucomicrobia in the caecum was eightfold higher than in the small intestine (P=0.004). Shannon–Wiener diversity indices (H) trended toward higher values in the caecum and colon compared to the small intestine (Table S2). In HF-fed mice, the relative abundance of Bacteroidetes in the small intestine compared to the colon was reduced 2.7-fold (P=0.008) while Proteobacteria in the small intestine compared to the caecum was reduced 2.8-fold (P=0.005) (Fig. 1).
Fig. 1.
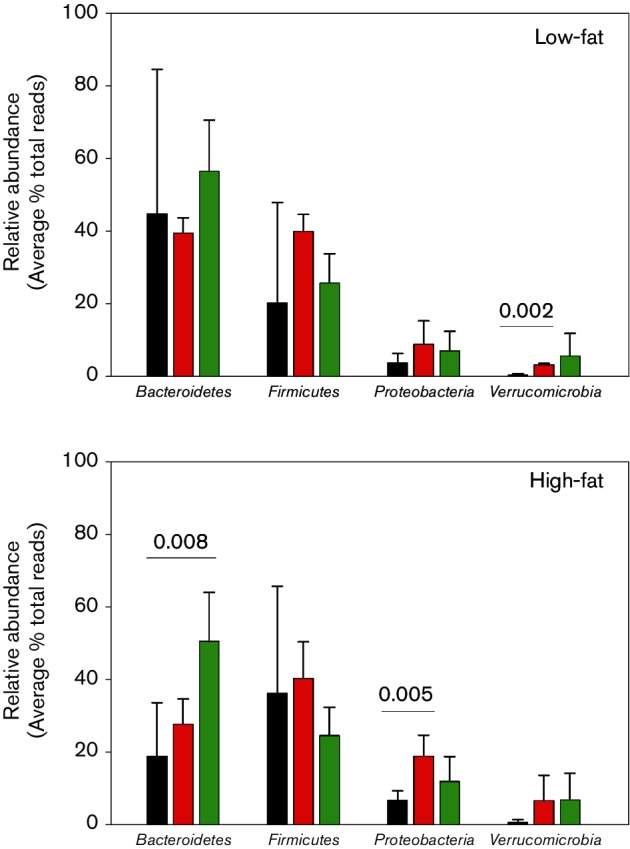
Comparison of the phyla present at ≥1 % of the relative abundance in the small intestine, caecum and colon in low- and high-fat-fed mice. Significant differences defined as P<0.05 are noted, with a numeric value in parentheses placed over the sections of the intestine showing significant differences. Small intestine ■, Caecum ■, Colon ■.
No significant changes in the phyla were detected in the small intestine or colon in HF- compared to LF-fed mice. In contrast, in the caecum, the relative abundance of Bacteroidetes decreased 2.7-fold (P=0.005) while the relative abundance of Proteobacteria increased 2.8-fold (P=0.017) (Fig. 1) in HF- compared to LF-fed mice. As a result of the reduction in relative abundance in Bacteroidetes in HF-fed mice, the Firmicutes to Bacteroidetes ratio increased significantly in the caecum in HF- compared to LF-fed mice (Fig. 2). This increase was accounted for by a significant decrease in the relative abundance of Bacteroidetes; the relative abundance of Firmicutes was not altered in HF- compared to LF-fed mice. In the colon, the relative abundance of Firmicutes was significantly lower than Bacteroidetes and the ratio did not change in HF- compared to LF-fed mice. In the small intestine, the variation in the relative abundance of Firmicutes and Bacteroidetes was too large between replicates to make accurate conclusions on the effect of dietary fat on the Firmicutes to Bacteroidetes ratio.
Fig. 2.

Comparison of relative abundance of Firmicutes to Bacteroidetes in the small intestine, caecum and colon in low- and high-fat-fed mice. Significant differences (P<0.05) are indicated, with numeric values printed above the phyla showing significant differences.
Bacterial genera in the small intestine compared to the large intestine
The genera identified in the dominant phyla in LF- and HF-fed mice of the small intestine compared to those identified in the caecum and colon are shown in Fig. 3. There were several genera uniquely found in the small intestine, and these included the Gram-positive bacteria Alkaliphilus, Turicibacter, Lachnospira and Lactobacillus spp. Among the Gram-negative bacteria, Sphingobacterium, Olivibacter, Parapedobacter and Polaribacter, and Thiothrix spp. were uniquely detected in the small intestine (Fig. 3). Alkaliphilus spp. accounted for the most dominant Gram-positive bacterium, followed by Clostridium, Turicibacter and Lachnospira spp. in the small intestine, while the most dominant Gram-negative bacteria were accounted for by Parabacteroides and Butyricimonas spp.
Fig. 3.

Comparison of the genera present at ≥1 % of the relative abundance in the small intestine, caecum and colon in low- and high-fat-fed mice. Small intestine ■, Caecum ■, Colon ■.
Examination of the genera in the large intestine showed that a number of bacteria were unique to the caecum or colon relative to the small intestine (Fig. 3). Bacteria uniquely identified in the large intestine in LF-fed mice included Peptococcus, Sedimentibacter, Dysgonomonas, Helicobacter, Bilophilia, Luteolibacter and Rubritales spp. In the HF-fed mice, genera uniquely identified in either caecum or colon included Acetobacterium, Anaerotruncus, Oribacterium, Peptoniphilus, Sedimentibacter, Dysgonomonas, Flavobacterium and Bilophila spp. All other genera identified in either the caecum or colon in LF- or HF-fed mice were also detected in the small intestine.
Significant changes in the relative abundance of the intestinal microbiota at the genus level were detected in bacteria identified in the phyla Bacteroidetes, Proteobacteria and Firmicutes (Table 1). The shifts involved reductions and increases in relative abundance of multiple genera within the Bacteroidetes throughout the intestinal tract. Reductions in the relative abundance of Pedobacter, Butyricimonas and Parabacteroides spp. and increases in Sphingobacterium and Bacteroides spp. were observed. The increase in Proteobacteria was associated with a significant increase in the relative abundance of Desulfobvibrio spp. in the caecum. Although the relative abundance of Firmicutes did not change with dietary fat, significant shifts in several genera within the taxa were detected and included increases in relative abundance of Oscillopsira and Sedimentibacter spp., and a decrease in Oribacterium spp. Except for Butyricimonas spp., the shifts in relative abundance in the various genera were detected in only one section of the intestinal tract. The relative abundance of Butyricimonas spp. decreased in both the caecum and colon in HF- relative to LF-fed mice.
Table 1. Shifts in intestinal microbiome associated with changes in dietary fat. Average of % of total reads is presented, with the P-values showing significant changes with dietary fat.
| Phyla | Genera | Low-fat | High-fat | P |
|---|---|---|---|---|
| Small intestine | ||||
| Decrease | ||||
| Bacteroidetes | Pedobacter spp. | 0.28 | 0.13 | 0.01 |
| Increase | ||||
| Firmicutes | Oscillospira spp. | 0.34 | 4.22 | 0.03 |
| Caecum | ||||
| Decrease | ||||
| Bacteroidetes | Butyricimonas spp. | 2.10 | 0.62 | <0.001 |
| Firmicutes | Oribacterium spp. | 0.50 | 0.13 | 0.03 |
| Increase | ||||
| Deltaproteobacteria | Desulfovibrio spp. | 4.46 | 15.67 | 0.006 |
| Firmicutes | Sedimentibacter spp. | 0.33 | 1.86 | 0.041 |
| Colon | ||||
| Decrease | ||||
| Bacteroidetes | Butyricimonas spp. | 3.19 | 1.15 | 0.006 |
| Bacteroidetes | Parabacteroides spp. | 18.61 | 6.67 | 0.003 |
| Bacteroidetes | Sphingobacterium spp. | 0.48 | 0.22 | 0.023 |
| Increase | ||||
| Bacteroidetes | Bacteroides spp. | 3.23 | 7.46 | 0.04 |
Discussion
Although far less studied than those in the large intestine, bacteria of the small intestine may also be presumed to play a role in health and disease. Compared to the colon, bacteria in the small intestine are thought to be enriched with those capable of aerobic growth [4]. In this study, Lactobacillus spp., a Gram-positive aero-tolerant anaerobe [25], was uniquely detected in the small intestine. Gram-negative bacteria uniquely detected in the small intestine included five genera belonging to the Bacteroidetes. The five genera identified, Olivibacter, Parapedobacter, Polaribacter, Sphingobacterium and Thiothrix spp., have been identified in various environmental samples such as water and soil samples [26–30]. Since aerobic growth is reported for several of these genera, e.g. Parapedobacter, Polaribacter and Sphingobacterium spp., it is important to ascertain whether these bacteria colonize and persist in the small intestine or are simply detected as a result of exposure to environmental sources such as water and bedding. The genera detected with the highest relative abundance in the small intestine were accounted for by anaerobic bacteria, including Alkaliphilus, Butyricimonas, Clostridium and Parabacteroides spp. Except for Alkaliphilus, these bacteria were also present in the large intestine. A limitation of the present study was that the contents of the small intestine, from the duodenum through the ileum, were combined and compared to the luminal contents collected from the caecum and colon. To accurately profile the bacterial communities in the mouse proximal small intestine, a future study should separate the duodenum and jejunum from the ileum. It is unclear whether the high relative abundance of anaerobes detected in the small intestine in this study occurs as a result of coprophagy or back-wash of caecal fluid into the ileum [31]. Further investigation of this question, using mesh-bottom cages to prevent coprophagy, is warranted.
The small intestine is the intestinal site where lipid levels are highest following consumption of dietary fats and where fat absorption occurs [32]. Blooms of bacteria capable of transporting and oxidizing exogenous fatty acids [33, 34] might be expected to occur in the small intestine under conditions of high dietary fat. Using the mouse model of DIO, we compared the microbiota in the mouse small and large intestine to explore the effects of matched LF and HF diets on the intestinal microbiota; earlier studies did not utilize matched control and test diets such that the fat, protein and carbohydrate sources were not identical [10, 11]. Other studies in mice used a diet very high in fat (72 % kcal as fat) containing extremely low levels of carbohydrate (<1 % kcal) [12]; such macronutrient levels result in ketogenesis [35]. Control and test diet compositions are listed in Table S4. In the current study, the HF, low-carbohydrate-fed mice gained significantly more weight over 12 weeks than the LF, high-carbohydrate-fed mice and developed significantly greater adiposity as measured by both fat mass measurements and blood leptin levels [36, 37]. The latter two measurements indicate development of obesity.
The intestinal microbiota is different in LF- compared to HF-fed mice in the present study, and the microbiota in the small intestine responded differently to those in the caecum and colon. The genera present at the highest relative abundance that changed with dietary fat were identified in the caecum and colon, not the small intestine, and were accounted for by Gram-negative bacteria. The genera that changed with dietary fat included Parabacteroides and Butyricimonas spp., which were highest in LF-fed mice, while Desulfovibrio and Bacteroides spp. were the highest in HF-fed mice. Increases in the relative abundance of Desulfovibrio spp. and shifts in Bacteroidetes genera secondary to HF feeding have been described in earlier studies using faecal samples [10, 11]. We speculate that, under conditions of high dietary fat, excess fat is not quantitatively absorbed in the small intestine and flows into the large intestine to support enhanced growth of some bacteria. It will be of interest to evaluate the effect of high dietary fat on the microbiota in the proximal and distal portion of the small intestine in a future study.
Our results show that dietary fat-driven shifts in Gram-negative intestinal bacterial communities occur throughout the intestine and are associated with the development of obesity. One current hypothesis, called metabolic endotoxemia, is that obesity is driven by leakage of minute levels of endotoxin from the intestine [12]. Endotoxin is a lipopolysaccaride produced by Gram-negative bacteria [38]. Structural variants exist and the immunological properties of lipopolysaccaride are structure dependent [39, 40]. Those with proinflammatory activity are called endotoxins. Clinical research has thus far failed to clearly elucidate a mechanism by which endotoxins might drive the development of obesity; metabolic endotoxaemia, however, remains an interesting hypothesis requiring new approaches to study the phenomena [41, 42]. Understanding exactly which bacteria are present in the proximal and distal portions of the mouse small intestine is important to begin to understand the role that diet-induced intestinal dysbiosis and, perhaps, lipopolysaccharide sources, play in obesity development. It is important to ascertain whether the proximal portion of the small intestine of mice, like humans, is enriched with Gram-positive bacteria and whether the distal section more resembles caecal fluid and responds metabolically to dietary factors in a manner similar to the caecum.
Obesity has been associated with a high Firmicutes to Bacteroidetes ratio. The ratio increased by more than 20-fold in a study in which mice were fed chow compared to a Western diet, where differences in macronutrient sources were almost certainly present [43]. In that study, caecal samples showed a significant decrease in Bacteroidetes and an increase in Mollicutes, a class within the Firmicutes [43]. The results of the present study showed that a significant increase in the Firmicutes to Bacteroidetes ratio of less than twofold occurred in the caecum of HF-fed mice. The increase was not accounted for by a bloom in Gram-positive bacteria but rather by a reduction in relative abundance of Bacteroidetes. Others have also reported an increase in the Firmicutes to Bacteroidetes ratio in faecal samples collected from mice fed an HF diet [10, 11]. In both of the latter studies, the increase was associated with an increase in Firmicutes and a decrease in Bacteroidetes, although the specific quantitative shifts in ratios of Firmicutes to Bacteroidetes were not provided. It is unclear whether the Firmicutes to Bacteroidetes ratio varies in lean and obese humans; discrepant results are published [44, 45]. Different conclusions may arise as a result of different methodologies used to analyse intestinal microbiome, as well as differences in diets.
With a future study separating the proximal and distal portion of the small intestine, the effect of dietary fat on the Firmicutes to Bacteroidetes ratio can be more accurately determined in the small intestine and compared to the caecum and colon. In all future experiments, the intestinal microbiome at the start of the study should be profiled so that microbiome changes occurring during the course of a study can be compared to the initial microbiome. This information could be particularly important when follow-up experiments are designed requiring new batches of research animals. It is unclear whether there might be batch-to-batch variation in the intestinal microbiome in research animals, although it is known that faecal microbiomes vary in mice purchased from different vendors [46]. With carefully described studies designed to compare the effect of obesogenic diets on the microbiome in the small and large intestine, a better understanding of the effects of diet on the Firmicutes to Bacteroidetes ratio and changes in the intestinal bacterial communities will be developed and applied towards solving the public health issue of global obesity.
Funding information
The research was funded by grants from the Center for Environmental Exposures and Disease Pilot Project Award (NIH-NIEHS P30 ES005022) and The New Jersey Institute for Food, Nutrition and Health.
Acknowledgements
The technical assistance provided by Adam Kandil and Sarala Kodukula is acknowledged. Discussions with veterinarians in the Department of Comparative Medicine Resources, Rutgers University, Drs Robert Harris and David Reimer, were thought-provoking and helpful.
Conflicts of interest
The authors declare that there are no conflicts of interest.
Supplementary Data
Footnotes
Abbreviations: DIO, diet induced obesity; HF, high fat; LF, low fat.
Sequence data have been uploaded to the NCBI Short Read Archive (SRA) database under accession number SRP066846.
Four supplementary tables and two supplementary figures are available with the online Supplementary Material.
Edited by: K. P. Scott and D. Grainger
References
- 1.Lee JE, Lee S, Sung J, Ko G. Analysis of human and animal fecal microbiota for microbial source tracking. Isme J. 2011;5:362–365. doi: 10.1038/ismej.2010.120. [DOI] [PMC free article] [PubMed] [Google Scholar]
- 2.Nguyen TL, Vieira-Silva S, Liston A, Raes J. How informative is the mouse for human gut microbiota research? Dis Model Mech. 2015;8:1–16. doi: 10.1242/dmm.017400. [DOI] [PMC free article] [PubMed] [Google Scholar]
- 3.Canny GO, McCormick BA. Bacteria in the intestine, helpful residents or enemies from within? Infect Immun. 2008;76:3360–3373. doi: 10.1128/IAI.00187-08. [DOI] [PMC free article] [PubMed] [Google Scholar]
- 4.Berg RD. The indigenous gastrointestinal microflora. Trends Microbiol. 1996;4:430–435. doi: 10.1016/0966-842X(96)10057-3. [DOI] [PubMed] [Google Scholar]
- 5.Breen DM, Rasmussen BA, Côté CD, Jackson VM, Lam TK. Nutrient-sensing mechanisms in the gut as therapeutic targets for diabetes. Diabetes. 2013;62:3005–3013. doi: 10.2337/db13-0523. [DOI] [PMC free article] [PubMed] [Google Scholar]
- 6.Angelakis E, Armougom F, Carrière F, Bachar D, Laugier R, et al. A metagenomic investigation of the duodenal microbiota reveals links with obesity. PLoS One. 2015;10:e0137784. doi: 10.1371/journal.pone.0137784. [DOI] [PMC free article] [PubMed] [Google Scholar]
- 7.Turnbaugh PJ, Ridaura VK, Faith JJ, Rey FE, Knight R, et al. The effect of diet on the human gut microbiome: a metagenomic analysis in humanized gnotobiotic mice. Sci Transl Med. 2009;1:6ra14. doi: 10.1126/scitranslmed.3000322. [DOI] [PMC free article] [PubMed] [Google Scholar]
- 8.Zoetendal EG, Raes J, van den Bogert B, Arumugam M, Booijink CC, et al. The human small intestinal microbiota is driven by rapid uptake and conversion of simple carbohydrates. Isme J. 2012;6:1415–1426. doi: 10.1038/ismej.2011.212. [DOI] [PMC free article] [PubMed] [Google Scholar]
- 9.Kim YS, Kim J, Park SJ. High-throughput 16S rRNA gene sequencing reveals alterations of mouse intestinal microbiota after radiotherapy. Anaerobe. 2015;33:1–7. doi: 10.1016/j.anaerobe.2015.01.004. [DOI] [PubMed] [Google Scholar]
- 10.Hildebrandt MA, Hoffmann C, Sherrill-Mix SA, Keilbaugh SA, Hamady M, et al. High-fat diet determines the composition of the murine gut microbiome independently of obesity. Gastroenterology. 2009;137:1716–1724. doi: 10.1053/j.gastro.2009.08.042. [DOI] [PMC free article] [PubMed] [Google Scholar]
- 11.Zhang C, Zhang M, Pang X, Zhao Y, Wang L, et al. Structural resilience of the gut microbiota in adult mice under high-fat dietary perturbations. Isme J. 2012;6:1848–1857. doi: 10.1038/ismej.2012.27. [DOI] [PMC free article] [PubMed] [Google Scholar]
- 12.Cani PD, Amar J, Iglesias MA, Poggi M, Knauf C, et al. Metabolic endotoxemia initiates obesity and insulin resistance. Diabetes. 2007;56:1761–1772. doi: 10.2337/db06-1491. [DOI] [PubMed] [Google Scholar]
- 13.Van Heek M, Compton DS, France CF, Tedesco RP, Fawzi AB, et al. Diet-induced obese mice develop peripheral, but not central, resistance to leptin. J Clin Invest. 1997;99:385–390. doi: 10.1172/JCI119171. [DOI] [PMC free article] [PubMed] [Google Scholar]
- 14.Douris N, Melman T, Pecherer JM, Pissios P, Flier JS, et al. Adaptive changes in amino acid metabolism permit normal longevity in mice consuming a low-carbohydrate ketogenic diet. Biochim Biophys Acta. 2015;1852:2056–2065. doi: 10.1016/j.bbadis.2015.07.009. [DOI] [PMC free article] [PubMed] [Google Scholar]
- 15.Gajda AM, Zhou YX, Agellon LB, Fried SK, Kodukula S, et al. Direct comparison of mice null for liver or intestinal fatty acid-binding proteins reveals highly divergent phenotypic responses to high fat feeding. J Biol Chem. 2013;288:30330–30344. doi: 10.1074/jbc.M113.501676. [DOI] [PMC free article] [PubMed] [Google Scholar]
- 16.Delmont TO, Simonet P, Vogel TM. Describing microbial communities and performing global comparisons in the 'omic era. Isme J. 2012;6:1625–1628. doi: 10.1038/ismej.2012.55. [DOI] [PMC free article] [PubMed] [Google Scholar]
- 17.Moreau MM, Eades SC, Reinemeyer CR, Fugaro MN, Onishi JC. Illumina sequencing of the V4 hypervariable region 16S rRNA gene reveals extensive changes in bacterial communities in the cecum following carbohydrate oral infusion and development of early-stage acute laminitis in the horse. Vet Microbiol. 2014;168:436–441. doi: 10.1016/j.vetmic.2013.11.017. [DOI] [PubMed] [Google Scholar]
- 18.Illumina: 16S Metagenomic Sequencing Library Preparation, Part # 15044223 Rev. A.
- 19.Klindworth A, Pruesse E, Schweer T, Peplies J, Quast C, et al. Evaluation of general 16S ribosomal RNA gene PCR primers for classical and next-generation sequencing-based diversity studies. Nucleic Acids Res. 2013;41:e1. doi: 10.1093/nar/gks808. [DOI] [PMC free article] [PubMed] [Google Scholar]
- 20.Milinovich GJ, Burrell PC, Pollitt CC, Klieve AV, Blackall LL, et al. Microbial ecology of the equine hindgut during oligofructose-induced laminitis. Isme J. 2008;2:1089–1100. doi: 10.1038/ismej.2008.67. [DOI] [PubMed] [Google Scholar]
- 21.Illumina: MiSeq Reporter Metagenomics Workflow Reference Guide, Part # 15042317 Rev.C.
- 22.Illumina: 16S Metagenomics App; 15055860 A.
- 23.Dean-Ross D, Mills AL. Bacterial community structure and function along a heavy metal gradient. Appl Environ Microbiol. 1989;55:2002–2009. doi: 10.1128/aem.55.8.2002-2009.1989. [DOI] [PMC free article] [PubMed] [Google Scholar]
- 24.Campbell SC, Wisniewski PJ, Noji M, Mcguinness LR, Häggblom MM, et al. The effect of diet and exercise on intestinal integrity and microbial diversity in mice. PLoS One. 2016;11:e0150502. doi: 10.1371/journal.pone.0150502. [DOI] [PMC free article] [PubMed] [Google Scholar]
- 25.Yanke LJ, Cheng KJ. A method for the selective enumeration and isolation of ruminal Lactobacillus and Streptococcus. Lett Appl Microbiol. 1998;26:248–252. doi: 10.1046/j.1472-765X.1998.00310.x. [DOI] [PubMed] [Google Scholar]
- 26.Ali N, Dashti N, Salamah S, Sorkhoh N, Al-Awadhi H, et al. Dynamics of bacterial populations during bench-scale bioremediation of oily seawater and desert soil bioaugmented with coastal microbial mats. Microb Biotechnol. 2016;9:157–171. doi: 10.1111/1751-7915.12326. [DOI] [PMC free article] [PubMed] [Google Scholar]
- 27.Zhang J, Cai X, Qi L, Shao C, Lin Y, et al. Effects of aeration strategy on the evolution of dissolved organic matter (DOM) and microbial community structure during sludge bio-drying. Appl Microbiol Biotechnol. 2015;99:7321–7331. doi: 10.1007/s00253-015-6640-z. [DOI] [PubMed] [Google Scholar]
- 28.Wang Y, Gao L, Ming H, Zhang P, Zhu W. Polaribacter marinaquae sp. nov., isolated from seawater. Int J Syst Evol Microbiol. 2016;66:4594–4599. doi: 10.1099/ijsem.0.001396. [DOI] [PubMed] [Google Scholar]
- 29.Gupta A, Logan J, Elhag N, Almond M. Sphingobacterium spiritivorum infection in a patient with end stage renal disease on haemodialysis. Ann Clin Microbiol Antimicrob. 2016;15:25. doi: 10.1186/s12941-016-0141-5. [DOI] [PMC free article] [PubMed] [Google Scholar]
- 30.Deepnarain N, Kumari S, Ramjith J, Swalaha FM, Tandoi V, et al. A logistic model for the remediation of filamentous bulking in a biological nutrient removal wastewater treatment plant. Water Sci Technol. 2015;72:391–405. doi: 10.2166/wst.2015.181. [DOI] [PubMed] [Google Scholar]
- 31.Calabuig R, Weems WA, Moody FG. Ileo-cecal junction: a valve or a sphincter? An experimental study in the opossum. Rev Esp Enferm Dig. 1996;88:828–839. [PubMed] [Google Scholar]
- 32.Brannon P, Tso P, Jandacek RJ. Digestion and absorption of lipids. In: Stipanuk M, editor. Biochemical, Physiological, and Molecular Aspects of Human Nutrition. 3rd ed. St. Louis: Saunders Elsevier; 2012. pp. 179–191. (editor) [Google Scholar]
- 33.Dirusso CC, Black PN. Long-chain fatty acid transport in bacteria and yeast. Paradigms for defining the mechanism underlying this protein-mediated process. Mol Cell Biochem. 1999;192:41–52. doi: 10.1023/A:1006823831984. [DOI] [PubMed] [Google Scholar]
- 34.Nunn WD. A molecular view of fatty acid catabolism in Escherichia coli. Microbiol Rev. 1986;50:179–192. doi: 10.1128/mr.50.2.179-192.1986. [DOI] [PMC free article] [PubMed] [Google Scholar]
- 35.Kennedy AR, Pissios P, Otu H, Roberson R, Xue B, et al. A high-fat, ketogenic diet induces a unique metabolic state in mice. Am J Physiol Endocrinol Metab. 2007;292:E1724. doi: 10.1152/ajpendo.00717.2006. [DOI] [PubMed] [Google Scholar]
- 36.Ghibaudi L, Cook J, Farley C, van Heek M, Hwa JJ. Fat intake affects adiposity, comorbidity factors, and energy metabolism of Sprague-Dawley rats. Obes Res. 2002;10:956–963. doi: 10.1038/oby.2002.130. [DOI] [PubMed] [Google Scholar]
- 37.Tinsley FC, Taicher GZ, Heiman ML. Evaluation of a quantitative magnetic resonance method for mouse whole body composition analysis. Obes Res. 2004;12:150–160. doi: 10.1038/oby.2004.20. [DOI] [PubMed] [Google Scholar]
- 38.Raetz CR, Whitfield C. Lipopolysaccharide endotoxins. Annu Rev Biochem. 2002;71:635–700. doi: 10.1146/annurev.biochem.71.110601.135414. [DOI] [PMC free article] [PubMed] [Google Scholar]
- 39.Munford RS. Sensing gram-negative bacterial lipopolysaccharides: a human disease determinant? Infect Immun. 2008;76:454–465. doi: 10.1128/IAI.00939-07. [DOI] [PMC free article] [PubMed] [Google Scholar]
- 40.Munford RS, Varley AW. Shield as signal: lipopolysaccharides and the evolution of immunity to gram-negative bacteria. PLoS Pathog. 2006;2:e67. doi: 10.1371/journal.ppat.0020067. [DOI] [PMC free article] [PubMed] [Google Scholar]
- 41.Boutagy NE, Mcmillan RP, Frisard MI, Hulver MW. Metabolic endotoxemia with obesity: Is it real and is it relevant? Biochimie. 2016;124:11–20. doi: 10.1016/j.biochi.2015.06.020. [DOI] [PMC free article] [PubMed] [Google Scholar]
- 42.Munford RS. Endotoxemia-menace, marker, or mistake? J Leukoc Biol. 2016;100:687–698. doi: 10.1189/jlb.3RU0316-151R. [DOI] [PMC free article] [PubMed] [Google Scholar]
- 43.Turnbaugh PJ, Bäckhed F, Fulton L, Gordon JI. Diet-induced obesity is linked to marked but reversible alterations in the mouse distal gut microbiome. Cell Host Microbe. 2008;3:213–223. doi: 10.1016/j.chom.2008.02.015. [DOI] [PMC free article] [PubMed] [Google Scholar]
- 44.Turnbaugh PJ, Ley RE, Mahowald MA, Magrini V, Mardis ER, et al. An obesity-associated gut microbiome with increased capacity for energy harvest. Nature. 2006;444:1027–1131. doi: 10.1038/nature05414. [DOI] [PubMed] [Google Scholar]
- 45.Duncan SH, Lobley GE, Holtrop G, Ince J, Johnstone AM, et al. Human colonic microbiota associated with diet, obesity and weight loss. Int J Obes. 2008;32:1720–1724. doi: 10.1038/ijo.2008.155. [DOI] [PubMed] [Google Scholar]
- 46.Ericsson AC, Davis JW, Spollen W, Bivens N, Givan S, et al. Effects of vendor and genetic background on the composition of the fecal microbiota of inbred mice. PLoS One. 2015;10:e0116704. doi: 10.1371/journal.pone.0116704. [DOI] [PMC free article] [PubMed] [Google Scholar]
Associated Data
This section collects any data citations, data availability statements, or supplementary materials included in this article.