Abstract
The mammalian brain contains diverse neuronal types, yet we lack single-cell epigenomic assays able to identify and characterize them. DNA methylation is a stable epigenetic mark that distinguishes cell types and marks regulatory elements. We generated >6,000 methylomes from single neuronal nuclei and used them to identify 16 mouse and 21 human neuronal subpopulations in the frontal cortex. CG and non-CG methylation exhibited cell type-specific distributions and we identified regulatory elements with differential methylation across neuron types. Methylation signatures identified a layer 6 excitatory neuron subtype and a unique human parvalbumin-expressing inhibitory neuron subtype. We observed stronger cross-species conservation of regulatory elements in inhibitory compared with excitatory neurons. Single-nucleus methylomes expand the atlas of brain cell types and identify regulatory elements that drive conserved brain cell diversity.
Mammalian neuron types are identified by their structure, electrophysiology and connectivity (1). The difficulty of scaling traditional cellular and molecular assays to whole neuronal populations has prevented comprehensive analysis of brain cell types. Sequencing mRNA transcripts from single cells or nuclei has identified cell types with unique transcriptional profiles in the mouse (2, 3) and human brain (4). However, these methods are restricted to RNA signatures, which are influenced by the environment. Epigenomic marks, such as DNA methylation (mC), are cell-type specific and developmentally regulated, yet stable across individuals and over the lifespan (5–7). We theorized that epigenomic profiles utilizing single-cell DNA methylomes could enable the identification of neuron subtypes in the mammalian brain.
During postnatal synaptogenesis, neurons accumulate substantial DNA methylation at non-CG sites (mCH) and reconfigure patterns of CG methylation (mCG, (7)). Patterns of mCG and mCH at gene bodies, promoters and enhancers are specific to neuronal types (5–8). Gene body mCH is more predictive of gene expression than mCG or chromatin accessibility (5). Because mCH is modulated over large domains, single neuron methylomes with sparse coverage can be used to accurately estimate mCH levels for over 90% of the genome by using coarse-grained bins (100kb) (Fig. S1). Whereas single cell RNA-Seq mainly informs about highly expressed transcripts, single neuron methylome sequencing assays any gene or non-gene region long enough to have sufficient coverage.
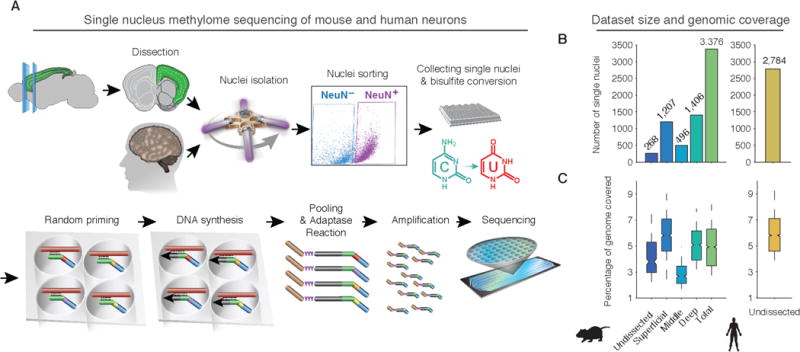
We developed a protocol for single nucleus methylcytosine sequencing (snmC-seq) and applied it to neurons from young adult mouse (8 week) and human (25 year) frontal cortex (FC) (Fig. 1A, (9)). snmC-seq provides a high rate of read mapping compared with published protocols (10–12) and allows multiplex reactions for large-scale cell type classification (Fig. S2,(9)). Like other bisulfite sequencing techniques (13), snmC-seq measures the sum of 5-methyl- and 5-hydroxymethylcytosines. Single neuronal nuclei labeled with anti-NeuN antibody were isolated by fluorescence-activated cell sorting (FACS) from human FC and from dissected superficial, middle and deep layers of mouse FC. We generated methylomes from 3,377 mouse and 2,784 human neurons with an average of 1.4 (1.8) million stringently filtered reads per cell in mouse (human), covering 4.7% (5.7%) of the genome (Fig. 1B–C, Table S1–2).
Fig. 1. High-throughput single nucleus methylome sequencing (snmC-seq) of mouse and human frontal cortex (FC) neurons.

(A) Workflow of snmC-seq. (B,C) Number of single neuron methylomes (B) and distribution of genomic coverage per dataset (C).
We calculated the mCH level for each neuron in nonoverlapping 100kb bins across the genome followed by dimensionality reduction and visualization using t-Stochastic Neighbor Embedding (t-SNE, (14)). The 2-dimensional tSNE representation was largely invariant over a wide range of experimental and analysis parameters (Fig. S3). A substantially similar tSNE representation was obtained using CG methylation levels in 100 kb bins, suggesting snmC-seq could be effective for cell-type classification of non-brain tissues without high levels of mCH (Fig. S3F).
The mammalian cortex arises from a conserved developmental program that adds excitatory neuron classes in an inside-out fashion, progressing from deep layers (L5,L6) to middle (L4) and superficial layers (L2/3) (1). Inhibitory interneurons arise from distinct progenitors in the ganglionic eminences and migrate transversely to their cortical locations (15). We used mCH patterns to identify a conservative and unbiased clustering of nuclei for each species (9). Cluster robustness was validated by shuffling, down-sampling and comparison to density-based clustering (Fig. S3–4, (9, 16)). In addition, clustering was not significantly associated with experimental factors (e.g. batches, q > 0.1, chi-squared test, Fig. S5).
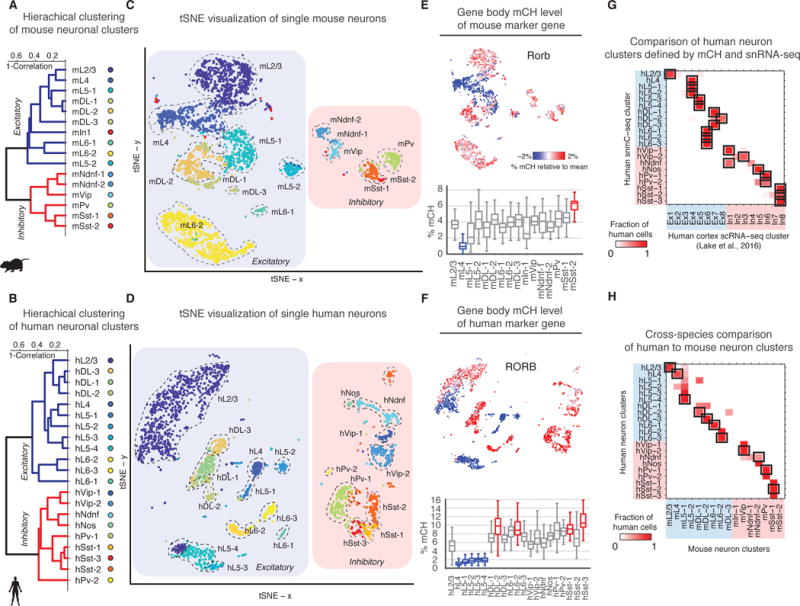
We applied identical clustering parameters to mouse and human cortical neuron mCH data and identified 16 mouse and 21 human neuron clusters (Fig. 2A–D). Assuming an inverse relationship between gene body mCH (average mCH across annotated genic region) and gene expression (7), we annotated each cluster on the basis of depletion of mCH at known cortical glutamatergic or GABAergic neuron markers (e.g. Satb2, Gad1, Slc6a1), cortical layer markers (e.g. Cux2, Rorb, Deptor, Tle4), or inhibitory neuron subtype markers (e.g. Pvalb, Lhx6, Adarb2) (1, 15, 17) (Fig. 2E–F, Fig. S6–7). For most clusters, mCH depletion at multiple marker genes (Fig. S6–7) allowed us to assign cluster labels indicating the putative cell type. For example, we found a cluster of mouse neurons with ultra-low mCH at Rorb (Fig. 2E, S6), a known marker of L4 and L5a excitatory pyramidal cells (17). Combining this information with markers such as Deptor (Fig. S6), which marks L5 but not L4 neurons, we labeled the cluster by species and layer, e.g. mL4 for mouse L4. Similarly, we used classical markers for inhibitory neurons such as Pvalb to label corresponding clusters, e.g. mPv for putative mouse Pvalb+ fast-spiking interneurons (15). We confirmed the accuracy of these classifications by comparing to layer dissected cortical neurons (Fig. S8A–B) and co-clustering with high-coverage methylC-seq data from purified populations of PV+ and VIP+ (5), as well as SST+ inhibitory neurons (Fig. S8C). Aggregated single neuron methylomes showed consistent mCH and mCG profiles compared to bulk methylomes of matching cell populations (Fig. S8D–E, S15F). Neuronal cluster classification for each of the major cell subtypes in mouse and human cortex based on single nuclei methylomes (Fig. 2G, S9A–B) was in good agreement with annotations based on single cell RNA-seq (2–4). Gene body mCH was anti-correlated with expression levels for corresponding clusters (Fig. S9C–E), validating our mCH marker-gene based annotation.
Fig. 2. Non-CG methylation (mCH) signatures identify distinct neuron populations in mouse and human FC.

(A,B) Hierarchical clustering of neuron types using gene body mCH level. (C,D) Two-dimensional visualization of single neuron clusters (tSNE (9)). Mouse and human homologous clusters are labeled with similar colors. (E,F) Gene body mCH at Rorb for each single neuron (top), and the distribution for each cluster (bottom) with hyper/hypo-methylated clusters highlighted in red/blue. (G) Comparison of human neuron clusters defined by mCH with clusters from single nucleus RNA-Seq (4, 9). (H) Fraction of cells in each human cluster assigned to each mouse cluster based on mCH correlation at orthologous genes (9). Mutual best matches are highlighted with black rectangles.
We found a greater diversity of excitatory neurons in deep layers compared to superficial layers for both mouse and human (Fig. 2). In both species, we identified one neuronal cluster for cortical L2/3 (mL2/3, hL2/3) and L4 (mL4, hL4), whereas L5 and L6 contained seven clusters in mouse (mL5, mL6 and mDL, where DL denotes deep layer neurons) and ten clusters in human (hL5, hL6 and hDL). Mouse L5 excitatory clusters (mL5-1, mL5-2) were hypomethylated at Deptor and Bcl6, which mark cortical L5a and L5b, respectively (Fig. S6, (18)). L6 excitatory clusters included subtypes with low mCH at the L6 excitatory neuron marker Tle4 (mL6-1, mL6-2; hL6-1, hL6-2, hL6-3, (1)). Interestingly, several deep layer neuron clusters (mDL-2, hDL-1, hDL-2, hDL-3) were not hypomethylated at Tle4. We identified marker genes for each neuron type based on cell type-specific mCH depletion (Table S3) (9). While many marker genes were either classically established (1, 17) or recently identified neuron-type markers (Fig. S10A–B, (2–4)), we identified a significant number with no prior association to neuronal cell types (Fig. S10D–E, Table S3). mCH signature genes were hypomethylated in homologous clusters in mouse and human, with a few notable exceptions. For example, the mouse L5a marker Deptor showed no specificity for human L5 neurons (Fig. S6–7, S10A–B).
Most clusters associated with classical cell type markers, but the identity of some clusters such as mDL-2 was less clear. We found that mDL-2 shares 24 marker genes with mL6-2, while 93 marker genes distinguish these clusters (Table S3). To validate the distinction between the two cell types, we selected a shared marker (Sulf1) and one unique to mL6-2 (Tle4) and performed double in situ RNA hybridization experiments in mouse FC (Fig. S11). The result confirmed the mCH-based prediction of a substantial proportion of L6 neurons expressing Sulf1 but not Tle4, which likely correspond to mDL-2 (Fig. S11A–D). The proportion of L6 neurons expressing both Sulf1 and Tle4 likely represents a subset of mL6-2 (Fig. S11A–D). Tle4-expressing neurons in somatosensory cortex project to thalamus while Sulf1 is expressed by both cortico-thalamic and cortico-cortical projecting neurons (18), suggesting neurons in cluster mDL-2 may have different projection targets compared to clusters showing hypomethylation of Tle4 (e.g. mL6-2). We also observed extensive overlap of in situ hybridization signals using probes for a classical inhibitory neuron marker gene, Pvalb, and Adgra3, a predicted mCH signature of PV inhibitory neurons (Fig. S11E–G), further validating the specificity of marker prediction using mCH.
We paired homologous mouse and human neuron clusters using the correlation of mCH levels at homologous genes and found expanded neuronal diversity in the human FC compared with mouse (Fig. 2H, S12A, (19)). Multiple human neuron clusters showed homology to mouse L5a excitatory neurons (mL5-1), L6a pyramidal neuron (mL6-2), or to VIP, PV, and SST inhibitory neurons (Fig. 2H). We found unique gene-specific mCH pattern and super-enhancer-like mCG signatures in a potential human specific inhibitory population (hPv-2, Fig. S12B, S16H (9)).
Though we detected substantial mCH in all human and mouse neurons, cell types varied over a wide range in terms of their genome-wide mCH level (1.3–3.4% in mouse, 2.8–6.6% in human) (Fig. S13A–F). The sequence context of mCH was similar across all neuron types and consistent with previous reports (Fig. S13I,J, (5, 7)). Interestingly, global and gene specific mCH differences were found in PV and SST inhibitory neurons located in different cortical layers (Fig. S14, (9)). Genes with low mCH in superficial layer PV+ neurons are enriched in functional annotations including neurogenesis, axon guidance functions and synapse part (Fig. S14F–H, (9)), suggesting layer-specific epigenetic regulation of synaptic functions in inhibitory neurons.
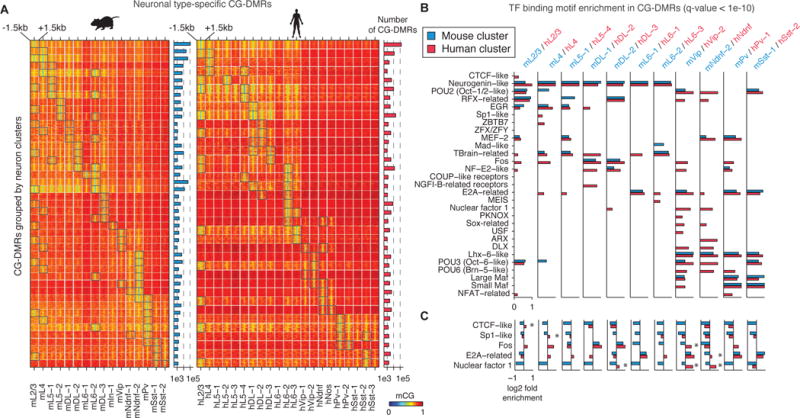
A key advantage of single cell methylome analysis is the ability to obtain regulatory information from the vast majority of the genome (>97%, (19)) not directly assessed by RNA-Seq. By pooling reads from all neurons in each cluster, we could find statistically significant differentially methylated regions with low mCG in specific neuronal populations (CG-DMRs), which are reliable markers for regulatory elements (5). We found 575,524 mouse (498,432 human) CG-DMRs with average size of 263.6 bp (282.8 bp), covering 5.8% (5.0%) of the genome (Fig. 3A and S15A, Table S5–6). Most CG-DMRs (73.2% in mouse, 68.6% in human) are located >10 kb from the nearest annotated transcription start site (Fig. S15B–E). mPv and mVip CG-DMRs showed strongest overlap with ATAC-seq peaks and putative enhancers identified from purified PV+ and VIP+ populations, respectively (Fig. S15G–H,(9, 20)). Hierarchical clustering of mCG levels at CG-DMRs grouped neuron-types by cortical layer and inhibitory neuron subtypes (Fig.S15I–J). Thus, neuron-type classification is supported by the epigenomic state of regulatory sequences.
Fig. 3. Conserved and divergent neuron type-specific gene regulatory elements.

(A) Heatmap showing differentially methylated regions (CG-DMRs) hypomethylated in one or two neuron clusters; categories of DMRs containing >1,000 regions are shown. (B) Transcription factor binding motif enrichment in CG-DMRs of homologous mouse and human clusters (FDR<10−10). (C) Mouse or human specific enrichment/depletion of TF binding motifs. Asterisks indicate TF binding motifs that are significantly enriched in one species but depleted in the other.
We inferred transcription factors (TFs) that play roles in neuron-type specification by identifying enriched TF-binding DNA sequence motifs in CG-DMRs (Fig. 3B–C and Fig. S15K). We identified known transcriptional regulators and observed that several TF-binding motifs were enriched in human but depleted in mouse CG-DMRs in homologous clusters (Fig. 3C). The binding motif of Nuclear Factor 1 (NF1) was enriched in CG-DMRs for two human inhibitory neuron subtypes (hVip-2, hNdnf) but was depleted in homologous mouse clusters (mVip, mNdnf-2), suggesting a specific involvement of NF1 in human inhibitory neuron specification. Thus, although the TF regulatory circuits governing tissue types are conserved between mouse and human (21), fine-grained distinctions between neuronal cell types may be shaped by species-specific TF activity.
Super-enhancers are clusters of regulatory elements, marked by large domains of mediator binding and/or the enhancer histone mark H3K27ac, that control genes with cell-type specific roles (22). Extended regions of depleted mCG (large CG-DMRs) are also reliable markers of super-enhancers (Fig. S16A–C, (9, 23)). Therefore, we used our neuron type specific methylomes to predict super-enhancers for each mouse and human neuron type (Fig. 16D–I, Table S7–8). For example, super-enhancer activity was indicated by a large CG-DMRs at Bcl11b (Ctip2) in a subset of deep layer neurons (Fig. S16F–G), and supported by broad H3K27ac enrichment in mouse excitatory neurons (Fig. S16F). Super-enhancers overlap with key regulatory genes in the associated cell type, such as Prox1 in VIP+ and NDNF+ neurons (Fig. S16H–I).
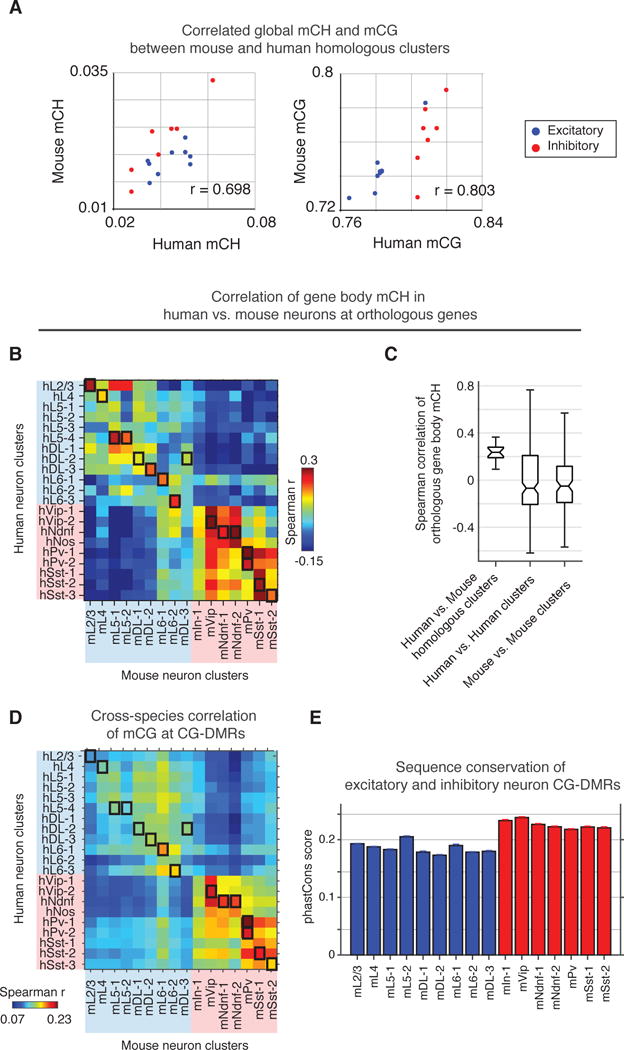
Global mCH and mCG levels were correlated between homologous clusters across mouse and human (Pearson r = 0.698 for mCH, and r = 0.803 for mCG, p< 0.005), suggesting evolutionary conservation of cell type specific regulation of mC (Fig. 4A, S13G–H). Examining 12,157 orthologous gene pairs, we found stronger correlation of gene body mCH between homologous clusters in mouse and human (median Spearman r = 0.236; Fig. 4B,C) than between different cell types within the same species (r = −0.050, mouse; r = −0.068, human). We found shared and species-specific CG-DMRs for homologous clusters based on sequence conservation (liftover; Fig. S17A–B). Cross-species correlation of mCG at CG-DMRs was significantly greater for inhibitory compared to excitatory neurons (p< 0.001 Wilcoxon rank sum test, Fig. 4D and S17C,(9)). Greater sequence conservation at inhibitory neuron CG-DMRs could partly explain the greater regulatory conservation (Wilcoxon rank sum test, p<0.001, Fig. 4E). Sequence conservation was only observed within 1kb of the center of inhibitory neuron CG-DMRs, but did not extend to the flanking regions (Fig. S17G). These results support conservation of neuron type-specific DNA methylation, with greater conservation of inhibitory compared with excitatory neuron regulatory elements.
Fig. 4. Conserved gene body mCH and CG-DMRs between mouse and human.

(A) Global mCH and mCG levels are strongly conserved within homologous cell types between mouse and human. (B) Cross-species correlation of gene body mCH at orthologous genes shows cell type-specific conservation. Black boxes denote homologous neuron clusters. (C) The median correlation of gene body mCH for homologous clusters is higher than the within-species correlation for distinct clusters. (D) Cross-species correlation of mCG at neuron-type-specific CG-DMRs. (E) Sequence conservation at neuron-type-specific DMRs.
Single cell methylomes contain rich information enabling high-throughput neuron type classification, marker gene prediction and identification of regulatory elements. Applying a uniform experimental and computational pipeline to mouse and human allowed unbiased comparison of neuronal epigenomic diversity in the two species. The expanded neuronal diversity in human, revealed by DNA methylation patterns, is consistent with more complex human neurogenesis, such as the presence of outer radial glia and the potential dorsal origin of certain interneuron subtypes (15, 24, 25). Further immunological, physiological and functional experiments are needed to characterize the DNA methylation based neuronal populations defined by our study. Single neuron epigenomic profiling allowed the identification of regulatory elements with neuron type specific activity outside of protein-coding regions of the genome. We expect that the single nucleus methylome approach can be applied to studies of disease, drug exposure or cognitive experience, to examine the role of cell type-specific epigenomic alteration in neurological/neuropsychiatric disorders.
Supplementary Material
One Sentence Summary.
Single-nucleus cytosine DNA methylomes distinguish neuron types and predict conserved gene regulatory elements in mouse and human cortex.
Acknowledgments
We thank Dr. C.O’Connor and C. Fitzpatrick at Salk Institute Flow Cytometry Core for sorting of nuclei; Drs. U. Manor and T. Zhang at Salk Institute Waitt Advanced Biophotonics Core for assisting with imaging; R. Loughnan for assistance of data analysis; J. Simon for assisting with illustration. The project is funded by the NIH BRAIN initiative 5U01MH105985 and 1R21MH112161 (J.R.E and M.M.B.) and 1R21HG009274 (J.R.E). T.J.S and J.R.E are investigators of the Howard Hughes Medical Institute. C.L.K was supported by NIH 2T32MH020002. Data can be downloaded from NCBI GEO (GSE97179) and http://brainome.org. The source code for bioinformatic analyses are available at https://github.com/mukamel-lab/snmcseq and https://github.com/yupenghe/methylpy.
Footnotes
Supplementary Materials:
Materials and Methods
References (26–44)
This manuscript has been accepted for publication in Science. This version has not undergone final editing. Please refer to the complete version of record at http://www.sciencemag.org/. The manuscript may not be reproduced or used in any manner that does not fall within the fair use provisions of the Copyright Act without the prior, written permission of AAAS.
References and Notes
- 1.Molyneaux BJ, Arlotta P, Menezes JRL, Macklis JD. Neuronal subtype specification in the cerebral cortex. Nat Rev Neurosci. 2007;8:427–437. doi: 10.1038/nrn2151. [DOI] [PubMed] [Google Scholar]
- 2.Zeisel A, et al. Brain structure. Cell types in the mouse cortex and hippocampus revealed by single-cell RNA-seq. Science. 2015;347:1138–1142. doi: 10.1126/science.aaa1934. [DOI] [PubMed] [Google Scholar]
- 3.Tasic B, et al. Adult mouse cortical cell taxonomy revealed by single cell transcriptomics. Nat Neurosci. 2016;19:335–346. doi: 10.1038/nn.4216. [DOI] [PMC free article] [PubMed] [Google Scholar]
- 4.Lake BB, et al. Neuronal subtypes and diversity revealed by single-nucleus RNA sequencing of the human brain. Science. 2016;352:1586–1590. doi: 10.1126/science.aaf1204. [DOI] [PMC free article] [PubMed] [Google Scholar]
- 5.Mo A, et al. Epigenomic Signatures of Neuronal Diversity in the Mammalian Brain. Neuron. 2015;86:1369–1384. doi: 10.1016/j.neuron.2015.05.018. [DOI] [PMC free article] [PubMed] [Google Scholar]
- 6.Kozlenkov A, et al. Substantial DNA methylation differences between two major neuronal subtypes in human brain. Nucleic Acids Res. 2016;44:2593–2612. doi: 10.1093/nar/gkv1304. [DOI] [PMC free article] [PubMed] [Google Scholar]
- 7.Lister R, et al. Global epigenomic reconfiguration during mammalian brain development. Science. 2013;341:1237905. doi: 10.1126/science.1237905. [DOI] [PMC free article] [PubMed] [Google Scholar]
- 8.Mo A, et al. Epigenomic landscapes of retinal rods and cones. Elife. 2016;5:e11613. doi: 10.7554/eLife.11613. [DOI] [PMC free article] [PubMed] [Google Scholar]
- 9.Materials and methods are available as supplementary materials on Science Online.
- 10.Smallwood SA, et al. Single-cell genome-wide bisulfite sequencing for assessing epigenetic heterogeneity. Nat Methods. 2014;11:817–820. doi: 10.1038/nmeth.3035. [DOI] [PMC free article] [PubMed] [Google Scholar]
- 11.Farlik M, et al. Single-cell DNA methylome sequencing and bioinformatic inference of epigenomic cell-state dynamics. Cell Rep. 2015;10:1386–1397. doi: 10.1016/j.celrep.2015.02.001. [DOI] [PMC free article] [PubMed] [Google Scholar]
- 12.Angermueller C, et al. Parallel single-cell sequencing links transcriptional and epigenetic heterogeneity. Nat Methods. 2016;13:229–232. doi: 10.1038/nmeth.3728. [DOI] [PMC free article] [PubMed] [Google Scholar]
- 13.Huang Y, et al. The behaviour of 5-hydroxymethylcytosine in bisulfite sequencing. PLoS One. 2010;5:e8888. doi: 10.1371/journal.pone.0008888. [DOI] [PMC free article] [PubMed] [Google Scholar]
- 14.van der Maaten L, Hinton G. Visualizing Data using t-SNE. J Mach Learn Res. 2008;9:2579–2605. [Google Scholar]
- 15.Wonders CP, Anderson SA. The origin and specification of cortical interneurons. Nat Rev Neurosci. 2006;7:687–696. doi: 10.1038/nrn1954. [DOI] [PubMed] [Google Scholar]
- 16.Ester M, Kriegel H, Sander J, Xu X. Proc 2nd Int Conf Knowl Discov Data Mining. 1996:226–231. [Google Scholar]
- 17.Lein ES, et al. Genome-wide atlas of gene expression in the adult mouse brain. Nature. 2007;445:168–176. doi: 10.1038/nature05453. [DOI] [PubMed] [Google Scholar]
- 18.Sorensen SA, et al. Correlated gene expression and target specificity demonstrate excitatory projection neuron diversity. Cereb Cortex. 2015;25:433–449. doi: 10.1093/cercor/bht243. [DOI] [PubMed] [Google Scholar]
- 19.Yue F, et al. A comparative encyclopedia of DNA elements in the mouse genome. Nature. 2014;515:355–364. doi: 10.1038/nature13992. [DOI] [PMC free article] [PubMed] [Google Scholar]
- 20.He Y, et al. Improved regulatory element prediction based on tissue-specific local epigenomic signatures. Proc Natl Acad Sci U S A. 2017;114:E1633–E1640. doi: 10.1073/pnas.1618353114. [DOI] [PMC free article] [PubMed] [Google Scholar]
- 21.Stergachis AB, et al. Conservation of trans-acting circuitry during mammalian regulatory evolution. Nature. 2015;515:365–370. doi: 10.1038/nature13972. [DOI] [PMC free article] [PubMed] [Google Scholar]
- 22.Whyte WA, et al. Master transcription factors and mediator establish super-enhancers at key cell identity genes. Cell. 2013;153:307–319. doi: 10.1016/j.cell.2013.03.035. [DOI] [PMC free article] [PubMed] [Google Scholar]
- 23.Schultz MD, et al. Human body epigenome maps reveal noncanonical DNA methylation variation. Nature. 2015;523:212–216. doi: 10.1038/nature14465. [DOI] [PMC free article] [PubMed] [Google Scholar]
- 24.Hansen DV, Lui JH, Parker PRL, Kriegstein AR. Neurogenic radial glia in the outer subventricular zone of human neocortex. Nature. 2010;464:554–561. doi: 10.1038/nature08845. [DOI] [PubMed] [Google Scholar]
- 25.Pollen AA, et al. Molecular identity of human outer radial glia during cortical development. Cell. 2015;163:55–67. doi: 10.1016/j.cell.2015.09.004. [DOI] [PMC free article] [PubMed] [Google Scholar]
- 26.Rompala GR, Zsiros V, Zhang S, Kolata SM, Nakazawa K. Contribution of NMDA receptor hypofunction in prefrontal and cortical excitatory neurons to schizophrenia-like phenotypes. PLoS One. 2013;8:e61278. doi: 10.1371/journal.pone.0061278. [DOI] [PMC free article] [PubMed] [Google Scholar]
- 27.Martin M. Cutadapt removes adapter sequences from high-throughput sequencing reads. EMBnet journal. 2011;17:10–12. [Google Scholar]
- 28.Krueger F, Andrews SR. Bismark: a flexible aligner and methylation caller for Bisulfite-Seq applications. Bioinformatics. 2011;27:1571–1572. doi: 10.1093/bioinformatics/btr167. [DOI] [PMC free article] [PubMed] [Google Scholar]
- 29.Li H, et al. The Sequence Alignment/Map format and SAMtools. Bioinformatics. 2009;25:2078–2079. doi: 10.1093/bioinformatics/btp352. [DOI] [PMC free article] [PubMed] [Google Scholar]
- 30.Urich MA, Nery JR, Lister R, Schmitz RJ, Ecker JR. MethylC-seq library preparation for base-resolution whole-genome bisulfite sequencing. Nat Protoc. 2015;10:475–483. doi: 10.1038/nprot.2014.114. [DOI] [PMC free article] [PubMed] [Google Scholar]
- 31.Li H. A statistical framework for SNP calling, mutation discovery, association mapping and population genetical parameter estimation from sequencing data. Bioinformatics. 2011;27:2987–2993. doi: 10.1093/bioinformatics/btr509. [DOI] [PMC free article] [PubMed] [Google Scholar]
- 32.Tsafrir D, et al. Sorting points into neighborhoods (SPIN): data analysis and visualization by ordering distance matrices. Bioinformatics. 2005;21:2301–2308. doi: 10.1093/bioinformatics/bti329. [DOI] [PubMed] [Google Scholar]
- 33.Hubert L, Arabie P. Comparing partitions. J Classification. 1985;2:193–218. [Google Scholar]
- 34.Vinh NX, Epps J, Bailey J. Information Theoretic Measures for Clusterings Comparison: Variants, Properties, Normalization and Correction for Chance. J Mach Learn Res. 2010;11:2837–2854. [Google Scholar]
- 35.Davies DL, Bouldin DW. A cluster separation measure. IEEE Trans Pattern Anal Mach Intell. 1979;1:224–227. [PubMed] [Google Scholar]
- 36.Rousseeuw PJ. Silhouettes: A graphical aid to the interpretation and validation of cluster analysis. J Comput Appl Math. 1987;20:53–65. [Google Scholar]
- 37.Caliński T, Harabasz J. A dendrite method for cluster analysis. Commun Stat Simul Comput. 1974;3:1–27. [Google Scholar]
- 38.Li B, Dewey CN. RSEM: accurate transcript quantification from RNA-Seq data with or without a reference genome. BMC Bioinformatics. 2011;12:323. doi: 10.1186/1471-2105-12-323. [DOI] [PMC free article] [PubMed] [Google Scholar]
- 39.Schindelin J, et al. Fiji: an open-source platform for biological-image analysis. Nat Methods. 2012;9:676–682. doi: 10.1038/nmeth.2019. [DOI] [PMC free article] [PubMed] [Google Scholar]
- 40.Daley T, Smith AD. Predicting the molecular complexity of sequencing libraries. Nat Methods. 2013;10:325–327. doi: 10.1038/nmeth.2375. [DOI] [PMC free article] [PubMed] [Google Scholar]
- 41.Luo C, et al. Cerebral Organoids Recapitulate Epigenomic Signatures of the Human Fetal Brain. Cell Rep. 2016;17:3369–3384. doi: 10.1016/j.celrep.2016.12.001. [DOI] [PMC free article] [PubMed] [Google Scholar]
- 42.Wingender E, Schoeps T, Dönitz J. TFClass: an expandable hierarchical classification of human transcription factors. Nucleic Acids Res. 2013;41:D165–70. doi: 10.1093/nar/gks1123. [DOI] [PMC free article] [PubMed] [Google Scholar]
- 43.Zhang Y, et al. Model-based analysis of ChIP-Seq (MACS) Genome Biol. 2008;9:R137. doi: 10.1186/gb-2008-9-9-r137. [DOI] [PMC free article] [PubMed] [Google Scholar]
- 44.Karolchik D, et al. The UCSC Table Browser data retrieval tool. Nucleic Acids Res. 2004;32:D493–6. doi: 10.1093/nar/gkh103. [DOI] [PMC free article] [PubMed] [Google Scholar]
Associated Data
This section collects any data citations, data availability statements, or supplementary materials included in this article.


