

Abstract
Undifferentiated nasopharyngeal carcinoma (NPC) is 100% associated with Epstein‐Barr virus (EBV). Expression of viral proteins in the tumor cells is highly restricted. EBV reactivation by CytoLytic Virus Activation (CLVA) therapy triggers de novo expression of early viral kinases (PK and TK) and uses antiviral treatment to kill activated cells. The mechanism of tumor elimination by CLVA was analyzed in NPC mouse model using C666.1 cells. Valproic acid (VPA) was combined with gemcitabine (GCb) to stimulate EBV reactivation, followed by antiviral treatment with ganciclovir (GCV). A single cycle of CLVA treatment resulted in specific tumor cell killing as indicated by reduced tumor volume, loss of EBV‐positive cells in situ, and paralleled by decreased EBV DNA levels in circulation, which was more pronounced than treatment with GCb alone. In vivo reactivation was confirmed by presence of lytic gene transcripts and proteins in tumors 6 days after GCb/VPA treatment. Virus reactivation was visualized by [124I]‐FIAU accumulation in tumors using PET‐scan. This studied showed that CLVA therapy is a potent EBV‐specific targeting approach for killing tumor cells. The [124I]‐FIAU appears valuable as PET tracer for studies on CLVA drug dosage and kinetics in vivo, and may find clinical application in treatment monitoring.
Keywords: cytolytic virus activation therapy, EBV DNA load, Epstein‐Barr virus, nasopharyngeal carcinoma, PET‐scan, targeted cancer therapy, treatment monitoring
1. INTRODUCTION
Undifferentiated nasopharyngeal carcinoma (NPC) is 100% associated with Epstein‐Barr virus (EBV), also called human herpesvirus 4 (HHV‐4).1 In NPC, the EBV is expressing characteristic latency type II gene products in all tumor cells, which contribute to viral maintenance and tumor behavior.2, 3, 4 NPC cells actively evade immune elimination despite abundant antiviral T cells in the tumor.5, 6 Serological studies indicate an early role of aberrant EBV activity in NPC pathogenesis (Ng et al., 2006).7, 8 Currently most NPC patients present at late tumor stage, requiring intensive chemo‐radiation therapy.3, 9 Alternative treatments targeting EBV in the tumor cells are under development.9, 10 We recently applied a CytoLytic Virus Activation (CLVA) therapy in patients with recurrent NPC.10 CLVA treatment combines the cytostatic drug gemcitabine (GCb) with histone deacetylase inhibitor (HDACi) valproic acid (VPA) to trigger reactivation of latent EBV into the lytic cycle.10, 11, 12 The induced expression of early viral kinases TK (BXLF1) and PK (BGLF4) sensitizes tumor cells to the antiviral compound ganciclovir (GCV) providing increased cytotoxicity.11 EBV immediate early (IE) gene products Zebra or Zta, and Rta play a central role in triggering the latency‐to‐lytic switch and block G1/S transition, thus limiting cell growth.13 Moreover, tumor cells switched to the viral lytic phase become targets for abundant cytotoxic T‐cell directed toward lytic gene products.6 Therefore, in recent years an increasing effort is made in finding novel compounds and drug combinations that can efficiently trigger EBV lytic reactivation. GCb is an effective single agent for treatment of NPC14, 15 and capable of reactivating EBV in epithelial cells. This activity is enhanced by the chromatin remodeling activity of histon deacetylase inhibitors (HDACi‐s) and DNA demethylating agents.12, 16, 17 Initial studies on CLVA were pioneered in treating EBV‐positive lymphomas in transplant recipients.18, 19 Recently, CLVA therapy was administered to end‐stage NPC patients showing promising results.10, 20 To investigate biological effects of CLVA therapy and the in vivo kinetics of virus reactivation in more detail we used an EBV‐positive NPC mouse model. The in vivo efficacy of individual versus combined drugs at different time points was assessed by viral markers in blood and tissue and visualized by positron emission tomography (PET) using [124I]‐FIAU (2′‐fluoro‐2′‐deoxy‐β‐D‐5‐iodouracil‐arabinofuranoside) as tracer, which is phosphorylated by early lytic‐phase kinases (TK and PK) and used for in vivo imaging and ex vivo bio‐distribution.21 [124I]‐FIAU‐PET/CT is approved for clinical use in musculoskeletal bacterial infections22 and might be translated for monitoring CLVA treatment in NPC patients.
2. MATERIALS AND METHODS
2.1. Establishment of NPC mouse model and CLVA treatment
The EBV‐positive carcinoma cell line C666.1 was cultured as described before.10 Balb/c nude mice (Harlan, Zeist, the Netherlands) were injected sub‐cutaneously (s.c.) with three million C666.1 cells in matrigel (BD Biosciences, Erembodegem, Belgium) in left and right flank. Tumor volume (TV) was measured twice weekly and blood sampling (50–100 μL) from the tail vein was done weekly. Animal experiments were conducted in accordance with the Dutch law and the protocol was approved by the VUMC committee on animal experimentation. Drugs were administered when tumor size reached 100–300 mm2, or 300–500 mm2 for Positron Emission Tomography (PET) scan experiments. Animals were randomized before treatment. Drug doses were based on prior in vivo studies10, 11, 23 and the administration schedule mimicked a single cycle of human CLVA therapy.10, 20 CLVA treatment consisted of daily 300 mg/kg VPA (Sigma‐Aldrich, Zwijndrecht, the Netherlands) in fresh drinking water and 120 mg/kg GCb (Fresenius Kabi Oncology Plc., Bordon, UK) administered i.p., followed after 4 days by daily i.p. treatment with 100 mg/kg GCV (Sigma‐Aldrich) (Fig. 1A). All groups (n = 5 per group) were treated for 15 days and subsequently animals were sacrificed and tumors harvested. Half of the tumor was snap frozen in liquid nitrogen and half was formalin fixed, paraffin‐embedded (FFPE) for histopathology, and immunohistochemistry examinations.
Figure 1.

(A) Time schedule of drug(s) administration: Gemcitabine (GCb) treatment was started on day 15 (D15) after tumor inoculation (D0) and 4 days later (D19) animals received a 2nd dose of GCb (n = 15). Valproic acid (VPA) was given to GCb‐treated animals (n = 10) from D15 and one group was treated with VPA‐only (n = 5). Ganciclovir (GCV) was administered daily starting on D19 from tumor inoculation in GCb/VPA treated mice (n = 5) and one group was treated only with GCV (n = 5). (B) Scheme of [124I]‐FIAU administration before PET‐scan and ex vivo tissue distribution in GCb/VPA treated mice (n = 8); only one dose of GCb was administered (D19)
For PET‐scan and tissue bio‐distribution analyses, two groups of mice (n = 4) were treated with one dose of GCb and daily VPA. After 6 and 9 days, 1 group of animals was used for PET analysis (Fig. 1B). In parallel one group received GCb and VPA but no PET tracer and were sacrificed after 6 days of treatment and tumor tissue was harvested for molecular and histological analyses.
2.2. EBV DNA load in whole blood before and during treatment
Every week starting from day 6 after tumor inoculation, 50 μL whole blood (WB) was collected mixed well with 450 μL NucliSens lysisbuffer (ioMérieux, Marcy‐l'Étoile, France). DNA was isolated and viral DNA load was measured as described before.10, 24 All samples were spiked with 1000 copies of EBV plasmid to analyze potential PCR inhibition. The amount of C666.1 cells per sample was defined by PCR for the human β‐globin gene.24
2.3. EBV‐RNA profiling in tumor tissue
Snap‐frozen tumor tissues were sliced in 5 × 10 mm sections and homogenized in 1 mL Trizol (Life Technologies, Waltham, MA). RNA was treated with RQ RNase‐free DNase (Promega, Madison, WI) followed by target‐specific cDNA synthesis as described in detail recently.25 cDNA was diluted 10 times or higher for use in SYBR Green based Real‐Time PCR quantification of each target gene (LightCycler480, Roche, Almere, the Netherlands). Quantification was calculated via a dilution curve of a plasmid pool containing all target genes and specificity was confirmed by melting curve analysis. Cellular housekeeping gene (U1A) was used as RNA quality control and for normalizing transcript levels.25 Correction for remaining viral DNA in the DNase‐I treated RNA extracts was done for all non‐spliced targets (Rta, PK, TK, VCA‐p18) to exclude genomic EBV DNA contamination. For this the viral load PCR was used targeting a genomic region not included in the cDNA target sequences.24
2.4. Immunohistochemistry and EBER‐RISH
Tumor FFPE sections were deparafinized and pre‐treated with H2O2 and 10 mM citrate buffer containing 0.05% Tween 20, pH 6.0 for 10 min at 98°C. The primary antibody (anti‐BZLF1, BZ‐1, 1: 200, kindly provided by Prof. Farrell or anti‐mouse CD68, 1: 500, Monosan, Uden, the Netherlands) was applied for 1 h at RT in a humidified chamber or over‐night at 4°C. Envision HRP anti‐rabbit/anti‐mouse (Dakopatts, Glostrup, Denmark) was followed by diaminobenzidine tetrachloride (DAB) substrate (Vector Laboratories, Burlingame, CA) and Hematoxylin‐Eosin staining. B95.8 cells induced for EBV lytic gene expression were fixed by 1% formalin in 2% agar, paraffin embedded, and used as positive control. EBER‐RISH was performed on 3 μm FFPE tumor tissue sections using a EBER peptide nucleic acid (PNA) probe (DAKO) as described.26
2.5. Western blot
C666.1 cells were lysed in RIPA buffer (50 mM Tris/HCl pH 7.5, 150 mM NaCl, 2 mM EDTA, 1% Na‐DOC, 1% Triton‐X‐100) in the presence of a protease inhibitor cocktail (Roche) for 30 min at 4°C and total protein concentration determined with a BCA protein assay kit (Pierce, Waltham, MA). Western blotting using the BZ‐1, anti‐PK (mAb2616, kind gift of J.T. Wang), and anti‐β‐Actin HRP (C4; Santa Cruz, Dallas, TX) antibodies was performed as described earlier.10
2.6. Radio‐synthesis of [124I]‐FIAU
[124I]‐FIAU was synthesized via its trimethyltin precursor (ABX, Dresden, Germany), by dissolving 40 µg of precursor in 0.2 mL acetic acid and transfer to alkaline (∼150 µL NaOH) Na [124I] (Cyclotron BV, VU, Amsterdam) solution.27
Afterwards, adding two times 20 µL of H2O2 (30% solution—at 0 and 4 min) the reaction was stopped at 8 min by adding 0.8 mL of sulfite in alkaline solution (0.5 mol · L−1 in 4 mol · L−1 NaOH). Purification was done by HPLC (RP Select B; 250 × 4 mm, 10 µ—with a 10−3 mol · L−1 aqueous NaHSO4/MeOH eluent, 85/15—flow 1.2 mL/min−Rt 15 min) and concentrated on a guard column. The collected [124I]‐FIAU was further diluted with NaOH and concentrated in 96% EtOH by reversed‐elution using a RP‐18 Classic Sep‐Pak®. For in vivo injection of [124I]‐FIAU in mice, the volume of EtOH was further reduced by evaporation at 45°C under a gentle N2‐stream and subsequently diluted with saline to an end‐activity concentration of 10‐15 MBq/10 µL, containing ≤10 vol% EtOH. Quality control analysis of [124I]‐FIAU revealed a chemical pure product with radiochemical purity higher than 99.5%, and an overall yield of 65‐70%.
2.7. In vitro [124I]‐FIAU accumulation assay
C666.1 cells (1 × 10⁶/well) were seeded on fibronectin pre‐coated dishes and left to adhere 24 h. Cells were treated with 3 μM GCb and 0.3 mM VPA. After 5 days 0.025 MBq/well of [124I]‐FIAU was added. After 2 h incubation (5% CO2, 37°C), the culture medium was collected and floating cells were pelleted by centrifugation (1720 rpm, 5 min), washed with PBS, centrifuged again, and the pellet was lysed in RIPA buffer. Adhered cells were PBS washed and lysed on ice with 100 μL RIPA buffer containing pelleted floating cells. Radioactivity in the supernatant and cell pellet was determined using a LKB 1282 Compugamma CS counter (LKB Wallac, Turku, Finland). Separate samples were prepared to assess the protein concentration by BCA Protein Kit (Pierce) for normalization. Radioactivity accumulation was calculated as percent of cell bound cpm/μg protein.
2.8. Positron Emission Tomography
Mice were anesthetized with 2% isofluran under oxygen flow and positioned on a temperature controlled pad in a double‐layer LSO high resolution research tomograph (HRRT) (Siemens/CTI, Knoxville), a small animal 3D scanner.28 First, a 6 min transmission scan was acquired using a 740 MBq 137Cs rotating point source.29 Next, 5 days post‐GCb treatment with daily VPA oral administration animals received 9.21 ± 0.29 MBq of [124I]‐FIAU by retro‐orbital injection. After 24 h, a 1 h the emission scan was started. PET‐scan data were corrected for scatter, random noise, attenuation, decay, and dead time using iterative 3D ordinary Poisson ordered‐subsets expectation maximization (OSEM).
2.9. Ex vivo tissue distribution
Immediately after PET, blood was obtained by heart puncture of anesthetized animals. Urine, tumors, thyroid, liver, spleen, kidney, skeletal muscle, stomach, ileum, bladder, brain, and lymph nodes were harvested from four mice. Tissues were weighed and the amount of radioactivity determined using a gamma counter (LKB Wallac). Results were expressed as percentage injected dose per gram of tissue (% ID/g).
3. RESULTS
3.1. CLVA treatment reduces tumor volume
The NPC mouse model was used to investigate the biological effects of single or combined agents of CLVA (GCb/VPA/GCV) treatment for EBV lytic induction in tumor cells in vivo, to show additive cytotoxicity of the antiviral compound GCV, and to visualize virus reactivation in tumor cells by IHC and PET. Drugs were well tolerated and no significant loss of body weight was observed. From day 6 after C666.1 cell inoculation, tumor volumes (TV) increased rapidly in all animals (Fig. 2A). Treatment was started in randomly selected animals on day 15. Fluctuations in TV were observed during treatment and even in the same animal because overall 3D tumor growth was not always uniform (Supplementary Table S1A). Separate daily administration of VPA and GCV did not result in decline of tumor growth as expected. On day 20, a clear decrease in TV was measured in the GCb‐only treated group and the tumors decreased further in size until day 30 (15 days after 1st dose). Subsequently, a small outgrowth was observed in both tumors of one animal. Combined GCb/VPA treatment reduced TV to levels lower than in the GCb‐only group. The complete CLVA treatment had a strong effect on TV resulting in the near absence of tumor tissue on day 30.
Figure 2.

(A) Tumor volumes represented as average per group (n = 5) of left (full circle) and right (open circle) tumors. In mice treated with GCb, GCb/VPA, and GCb/VPA/GCV tumor volumes decreased in time. Arrows represent administration of GCb, that is, 15 and 19 days after tumor inoculation. Numeric details of mean tumor volumes and standard deviations (SD) are presented in Supplemental Table S1. (B) EBV DNA load in circulation calculated as mean value plus SD (n = 5). Note the continued increase in untreated mice, while in VPA and GCV‐only treated mice a plateau was reached and high levels were measured. Combined/complete treatment reduced the EBV DNA load (starting from day 20) to virtually negative values at end of treatment, and the level in GCb‐only treated mice later raised again in time. Arrows represent administration of GCb, that is, 15 and 19 days after tumor inoculation. Upper bold line (purple) denotes timeframe of VPA administration and the line beneath (green) duration of GCV administration
3.2. EBV DNA load in mouse whole blood reflects tumor volume
Viral DNA levels in WB monitored in parallel to the treatment response (Fig. 2B) gradually increased with tumor volume until the start of treatment (day 13). The levels continued to rise in untreated, as well as in VPA‐only and GCV‐only treated groups reaching a plateau of 1 × 10⁵ copies/mL, while in GCb‐only, GCb/VPA, and complete CLVA treated groups, a steep decrease of viral load was observed at 5 days from treatment initiation (Fig. 2B), which remained negative in GCb/VPA and complete CLVA treated groups during follow‐up. In the GCb‐only treated group three animals showed a rise in EBV DNA load on day 30 (3 × 10² copies/mL blood), suggesting tumor regrowth. No such increase was observed in the complete CLVA treated animals.
3.3. The kinetics of lytic virus induction in vitro
EBV reactivation in C666.1 cells treated with GCb/VPA (1‐8 days) was analyzed to determine optimal timing for administration of radiolabeled FIAU. EBV‐mRNA profiling revealed significant upregulation of all lytic targets starting after 3 days of treatment (Fig. 3A). Lytic induction was also assessed based on appearance of IE‐Zebra and early lytic PK proteins by immunoblot analysis of parallel samples (Fig. 3B). Zebra expression increased after 24 h of GCb/VPA treatment and reached a plateau level after 3 days, decreasing thereafter. PK appeared after 3 days of treatment and expression increased in time to stable levels throughout.
Figure 3.

The kinetics of lytic induction of EBV in C666.1 cells treated with combination of GCb and VPA for 1‐8 days. (A) EBV RNA profiling revealed strong upregulation of all lytic transcripts after 3 days of treatment. Transcripts were calculated as target molecules/cell and normalized to human cellular housekeeping U1A. The fold change was determined by normalization to the level in the untreated cells. (B) Western blot analysis shows a typical example of lytic induction profiling in cultured C666.1 cells detecting Zebra and PK proteins, using cellular β‐actin as a loading control
3.4. Lytic transcripts detected after 6 and 9 days GCb and VPA treatment in vivo
Based on the in vitro mRNA expression kinetics in vivo EBV‐RNA profiling was performed in extracts of frozen tumors from GCb/VPA treated animals harvested at 6 and 9 days following treatment and from untreated mice 30 days after tumor inoculation. In the untreated control group only negative or very low base‐levels of lytic transcripts were detectable. In 6‐days, CLVA treated mice transcripts of Zebra, Rta, PK, TK, and VCA‐p18 appeared to be present in high numbers indicating viral lytic induction due to GCb/VPA treatment (Fig. 4). The levels decreased in tumors of day 9 treated mice, except for the late VCA‐p18 transcripts. Latent‐phase specific EBV RNA transcripts were detected in all tumor tissues, and the expression pattern corresponded to the NPC‐specific EBV latency type‐II (data not shown).
Figure 4.

Lytic transcripts of EBV detected in tumors of 6 (D6) and 9 (D9) days GCb/VPA treated mice (n = 4); the immediate early Zebra, Rta, early PK, TK, and late VCA‐p18 transcripts were calculated as target molecules/cell and normalized to human cellular housekeeping U1A. Fold change was determined by normalization of the average level of each specific mRNA per treated group to the level of that mRNA in the untreated group
3.5. CLVA treatment results in strong reduction of EBER‐positive tumor cells
Tumor tissues collected after treatment were examined for the presence of EBV‐positive cells using the EBER‐RNA in situ hybridization assay (EBER‐RISH) and tissue architecture was inspected by routine HE staining (Fig. 5). In the untreated group of animals, large fields of tightly packed vital tumor cells were surrounded by tumor stroma and as indicated by strong EBER‐positive staining (Fig. 5A,D). This pattern was similar in tumors from animals treated with VPA and GCV‐only (Supplementary Fig. S1A‐C). In GCb‐only treated animals, tumor tissue architecture was clearly different, with less compact fields of tumor cells and wide areas of apoptosis and necrosis, while the number of EBER‐positive tumor cells was drastically reduced (Figs. 5B,E and S1D). The GCb/VPA combination resulted in further reduction of EBER‐positive cells (Supplementary Fig. S1E), whereas complete CLVA treatment, including GCb/VPA plus GCV resulted in an even more pronounced decrease of tumor cells leaving only few residual EBER‐positive cells to be detected (Figs. 5C,F and S1F). Correspondingly, the most significant tissue architecture changes were observed in complete CLVA treated group and the EBER‐positive signals appeared to be associated with phagocytic cells rather than tumor cells.
Figure 5.

Hematoxylin and eosin (HE) staining (A‐C) and EBER in situ hybridization (D‐F) were performed on tumors from control, GCb‐only, and complete CLVA treated mice for 15 days. In untreated tumors, a high density fields of EBER‐positive tumor cells were detected (D), which correspond to the architecture of HE stained tumor (A). GCb‐only treatment reduced the number of tumor cells (E). In the complete CLVA treated tumors only few residual tumor cells remained (F) and phagocytosis by activated macrophages was observed (illustrated by arrowheads). Detection of Zebra‐positive cells in tumor tissues of control and 6, 9, and 15 days GCb/VPA treated mice (G‐J; respectively). CD68 staining was performed to confirm the presence of infiltrated macrophages in 6 (L) and 9 days (M) treated tumors, while the untreated tumors were entirely negative (K). Macrophages in mouse lung alveoli (N) were stained as a positive control. Note the apoptotic cells (indicated by arrow) and tumor cells digested by macrophages (arrowhead). 40× magnification
3.6. Lytic EBV reactivation in tumors of mice treated with GCb and VPA
To investigate EBV lytic induction in tumor tissues, we performed IHC staining for IE lytic protein Zebra for all animals treated with GCb/VPA combination, after 6, 9, and 15 days and non‐treated controls. Histopathological analyses revealed most abundant Zebra expression at 6 days after start of treatment, and less at day 9, whereas almost no EBV lytic cells were observed in tumor tissues from untreated mice (Fig. 5G‐J). Occasionally single Zebra positive cells were observed in untreated mice, indicating low level spontaneous lytic activation. In treated mice cells expressing Zebra protein were detected within fields of vital tumor cells (Fig. 5G).
3.7. Clearance of lytically‐induced tumor cells by mouse macrophages
Mouse CD68 positive macrophages were abundant in tumors of animals treated with GCb/VPA and CLVA at 6 and 15 days whereas no macrophages were observed in tumor fields of control animals (Fig. 5K‐M). In collapsing tumors, occasionally fields of tumor cells formed belt‐like structures around macrophages (data not shown). The presence of macrophages indicates the active clearance of apoptotic lytic‐induced cells within treated tumors.
3.8. [124I]‐FIAU accumulation in C666.1 cells induced with GCb and VPA
Based on the in vitro kinetics of EBV mRNA expression (Fig. 3), we argued that FIAU should be administered, after 4‐5 days following the first administration of GCb/VPA, in order to achieve optimal PK/TK mediated conversion and cellular accumulation. Accumulation of [124I]‐FIAU in GCb/VPA treated and untreated C666.1 cells was measured at day 5 and calculated as percentage of cell bound cpm/μg protein, revealing a threefold increase in treated compared to untreated cells (Fig. 6A).
Figure 6.
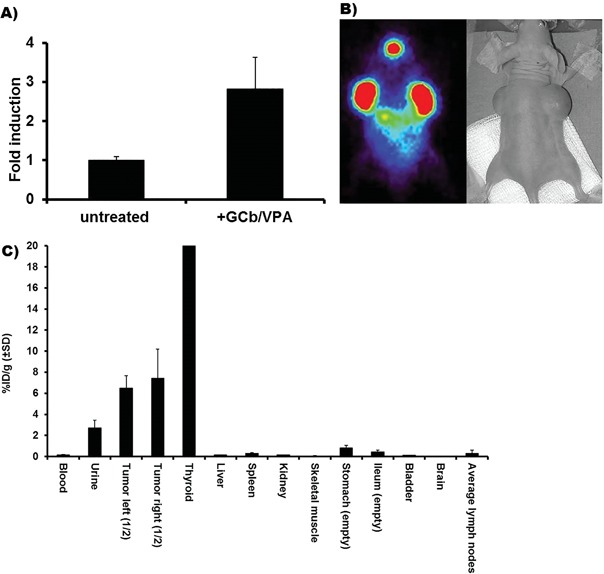
(A) In vitro assay showing accumulation of [124I]‐FIAU in C666.1 cells after 5 days induction by GCb/VPA. (B) PET image 6 days after GCb/VPA treatment. (C) Ex vivo tissue distribution demonstrating tumor specific uptake of [124I]‐FIAU after 9 days of GCb/VPA treatment presented as average %ID/g in four animals. Note the high unspecific [124I]‐FIAU accumulation in thyroid
3.9. Positron Emission Tomography and [124I]‐FIAU tissue distribution
Administration of [124I]‐FIAU tracer was performed 5 days after initiation of treatment and PET was performed 20 h after i.v. injection of [124I]‐FIAU. PET images provided direct evidence of CLVA‐induced EBV‐specific reactivation in tumors of treated mice: GCb/VPA combined treatment triggered accumulation of [124I]‐FIAU, exclusively in the induced NPC tumor cells (Fig. 6B). Accumulation of tracer was also observed in the thyroid, as blocking of physiological iodine uptake was not done in these experiments. Increased tumor accumulation (7.0 ± 2.0% ID/g) of [124I]‐FIAU was observed in the tumors of all GCb/VPA treated animals, and as observed in the PET images, a physiological iodine accumulation was seen in the unblocked thyroid. Other tissues were negative or showed minimal accumulation of [124I]‐FIAU (Fig. 6C).
4. DISCUSSION
The concept of CLVA treatment for targeting EBV‐carrying carcinoma was analyzed in detail for treatment efficacy and direct monitoring of virus reactivation in vivo. The nude mouse model with human C666.1 naturally EBV‐infected NPC tumor cells was establish and exposed to single and combined CLVA agents, mimicking one of the six cycles of treatment used in the human clinical setting.10, 20 In this model, we were able to investigate CLVA‐mediated effect on EBV lytic induction at different time points and compare effectiveness of single and combined drugs, which would not be possible in NPC patients. Clearly, tumor growth was limited as a result of GCb‐only administration, but the combination of GCb with VPA or complete CLVA treatment however resulted in more pronounced reduction of tumor growth after 15 days of treatment. In the group treated with GCb‐only a small regrowth of a tumor was observed after treatment, in contrast to GCb/VPA or complete CLVA treatment. The tumor regrowth was indicated as well by a pronounced rise in viral DNA load in blood. DNA load measured in WB paralleled the growth and treatment‐induced reduction of tumors in all tumor bearing mice, supporting its use as marker for monitoring treatment results in NPC patients.10, 23, 30, 31, 32, 33
The additional cytotoxic effect of antiviral compound GCV was best visualized by EBER‐RISH staining, revealing a dramatic reduction of EBV‐positive tumor fields with only a few residual tumor cells remaining after a single CLVA dosage as compared to the GCb‐only treatment (Figs. 5D‐F and S1A‐F). The distinct tissue morphology of CLVA treated tumors, with barely detectable EBER‐positive tumor cells clearly indicated the superior efficacy of tumor cell killing by the complete CLVA combination, which supports with previous in vitro studies.10, 11, 12 The abundant infiltration of active mouse macrophages in these tissues supports a role of phagocytic cells in apoptotic tumor cell clearance (Fig. 5K‐M). In patients, the viral neo‐antigens after EBV reactivation are considered to be crucial for triggering EBV‐specific activation of T‐cell mediated immune response.6 This aspect however cannot be assessed in this nude‐mouse model. One of the highly immunogenic EBV products, IE protein Zebra was detected in tumor tissues of 6 days treated mice, indicating a single dosage of CLVA induced reactivation of virus in NPC tumor cells (Fig. 5G‐J). The fact that we detected sporadic single Zebra‐positive cells in untreated tumors suggests a spontaneous EBV‐reactivation. This is in agreement with in vitro findings,17 indicating that a subset of cells can be induced for strong Zebra expression by a single‐dose treatment whereas multiple cells are weakly induced, which may remain undetectable by immunohistochemistry in vivo. Apparently the process is highly dynamic, since only 3 days later (9 days treated mice), the expression of Zebra dropped significantly which was in line with the lytic mRNA profiles showing a peak of EBV‐reactivation after 6 days of treatment followed by a decreases in time.
GCV alone is not effective for treating EBV‐positive tumors,11, 16 since tumor cells do not express viral kinases to convert GCV into its cytotoxic tri‐phosphate form. In the NPC mouse model of Sides et al,31 a small reduction in TV of GCV‐only treated mice was found, due to mild pro‐apoptotic properties of this compound. We did not observe any inhibition of tumor growth by GCV‐only treatment, similar to findings in a B‐cell lymphoma mouse model.12 However, the low level of spontaneous Zebra‐positive cells by immunohistochemistry in untreated tumors may explain such a finding.
FIAU (1‐[2‐deoxy‐2‐fluoro‐1‐D‐arabinofyranosyl]‐5‐iodouracil) is a substrate of thymidine kinase (TK) used and first described for visualizing of virus reactivation in EBV‐positive Burkitt's lymphoma xenografts treated with Bortezomib.21 Here, we demonstrated radiolabeled [124I]‐FIAU as marker to visualize EBV lytic activity in NPC tumor cells following CLVA treatment. Entrapment of [124I]‐FIAU in PK/TK‐expressing tumor cells has a potential clinical application for in vivo monitoring of CLVA therapy responses in human trials.
5. CONCLUSIONS
Overall the data presented here provide direct evidence of EBV lytic induction in vivo as a result of virus‐targeted therapy in a NPC model system. A single round of CLVA treatment induced lytic gene expression in NPC tumor tissue in vivo and proved most efficient in reducing tumor volume, eliminating circulating EBV‐DNA load, and was most effective in clearing EBER‐positive cells in situ as compared to the controls. We suggest that virus‐targeted tumor therapy and virus‐specific monitoring by EBV‐marker profiling and [124I]‐FIAU PET‐scan can be used for multiple EBV‐positive malignancies, but further studies are needed to validate this.
Supporting information
Additional Supporting Information may be found online in the supporting information tab for this article.
Table S1. (A) Mean tumor volumes in mm3 (TV) per group (n = 5) separately for left and right side with standard deviation (SD). Grey box indicate days after treatment. Note that in the group to be treated with VPA alone, mean TV was somewhat larger than average (232 and 186 mm3, respectively).
Figure S1. Overview of EBER‐positive tumor cells in untreated tumors (A), GCb‐only treated (B), VPA‐only treated (C), GCV‐only treated (D), GCb/VPA treated (E), and complete CLVA‐treated tumors (F). Arrowheads indicate remaining EBER+ tumor cells. 40× magnification.
ACKNOWLEDGMENTS
We greatly acknowledge H. van der Laan, C. Prins and R. Bergstra for technical assistance with in vivo and ex vivo mouse studies. M. Hulsman is acknowledged for experiments on kinetics of EBV lytic induction. We thank R. Emmens for providing the anti‐CD68 antibody, prof. Dr. E. Bloemena and Dr. N. van Grieken for histopathology analyses, W. Vos for assistance with immune‐histochemical stainings and J.W.M. Plevier for technical support. This study was financially supported by ZonMW translational research project (95110069) and Dutch Cancer Society grants (KWF‐VU 2010‐4809, KWF‐VU 2012‐5554).
CONFLICTS OF INTEREST
None.
Novalić Z, Verkuijlen SAWM, Verlaan M, et al. Cytolytic virus activation therapy and treatment monitoring for Epstein‐Barr virus associated nasopharyngeal carcinoma in a mouse tumor model. J Med Virol. 2017;89: 2207–2216. https://doi.org/10.1002/jmv.24870
REFERENCES
- 1. Pathmanathan R, Prasad U, Chandrika G, Sadler R, Flynn K, Raab‐Traub N. Undifferentiated, nonkeratinizing, and squamous cell carcinoma of the nasopharynx. Variants of Epstein‐Barr virus‐infected neoplasia. Am J Pathol. 1995; 146:1355–1367. [PMC free article] [PubMed] [Google Scholar]
- 2. Chang ET, Adami HO. The enigmatic epidemiology of nasopharyngeal carcinoma. Cancer Epidemiol Biomarkers Prev. 2006; 15:1765–1777. [DOI] [PubMed] [Google Scholar]
- 3. Wei WI, Sham JST. Nasopharyngeal carcinoma. Lancet. 2005; 365:2041–2054. [DOI] [PubMed] [Google Scholar]
- 4. Raab‐Traub N. Novel mechanisms of EBV‐induced oncogenesis. Curr Opin Virol. 2012; 2:453–458. [DOI] [PMC free article] [PubMed] [Google Scholar]
- 5. Li J, Zeng XH, Mo HY, et al. Functional inactivation of EBV‐specific T‐Lymphocytes in nasopharyngeal carcinoma: implications for tumor immunotherapy. PLoS ONE. 2007; 2:e1122. [DOI] [PMC free article] [PubMed] [Google Scholar]
- 6. Hislop AD, Taylor GS, Sauce D, Rickinson AB. Cellular responses to viral infection in humans: lessons from Epstein‐Barr virus. Ann Rev Immunol. 2007; 25:587–617. [DOI] [PubMed] [Google Scholar]
- 7. Ng MH, Chan KH, Ng SP, Zong YS. Epstein‐Barr virus serology in early detection and screening of nasopharyngeal carcinoma. Ai Zheng 2006; 25:250–256. [PubMed] [Google Scholar]
- 8. Liu Z, Ji MF, Huang QH, et al. Two Epstein‐Barr virus‐related serologic antibody tests in nasopharyngeal carcinoma screening: results from the initial phase of a cluster randomized controlled trial in southern China. Am J Epidemiol. 2013; 177:242–250. [DOI] [PubMed] [Google Scholar]
- 9. Hutajulu SH, Kurnianda J, Tan IB, Middeldorp JM. Therapeutic implications of Epstein‐Barr virus infection for the treatment of nasopharyngeal carcinoma. Ther Clin Risk Manag. 2014; 10:721–736. [DOI] [PMC free article] [PubMed] [Google Scholar]
- 10. Wildeman MA, Novalić Z, Verkuijlen SAWM, et al. Cytolytic virus activation therapy for Epstein‐Barr virus‐driventumors. Clin Cancer Res. 2012; 18:5061–5070. [DOI] [PubMed] [Google Scholar]
- 11. Feng WH, Israel B, Raab‐Traub N, Busson P, Kenney SC. Chemotherapy induces lytic EBV replication and confers ganciclovir susceptibility to EBV‐positive epithelial cell tumors. Cancer Res. 2002; 62:1920–1926. [PubMed] [Google Scholar]
- 12. Feng WH, Kenney SH. Valproic acid enhances the efficacy of chemotherapy in EBV‐positive tumors by increasing lytic viral gene expression. Cancer Res. 2006; 66:8762–8769. [DOI] [PubMed] [Google Scholar]
- 13. Paladino P, Marcon E, Greenblatt J, Frappier L. Identification of herpesvirus proteins that contribute to G1/S arrest. J Virol. 2014; 88:4480–4492. [DOI] [PMC free article] [PubMed] [Google Scholar]
- 14. Foo KF, Tan EH, Leong SS, et al. Gemcitabine in metastatic nasopharyngeal carcinoma of the undifferentiated type. Ann Oncol. 2002; 13:150–156. [DOI] [PubMed] [Google Scholar]
- 15. Huang P, Plunkett W. Induction of apoptosis by gemcitabine. Semin Oncol. 1995; 22:19–25. [PubMed] [Google Scholar]
- 16. Kenney SC, Mertz JE. Regulation of the latent‐lytic switch in Epstein‐Barr virus. Semin Cancer Biol. 2014; 26:60–68. [DOI] [PMC free article] [PubMed] [Google Scholar]
- 17. Chan ATC, Tao Q, Robertson KD, et al. Azacitidine induces demethylation of the Epstein‐Barr virus genome in tumors. J Clin Oncol. 2004; 22:1373–1381. [DOI] [PubMed] [Google Scholar]
- 18. Faller DV, Mentzer SJ, Perrine SP. Induction of the Epstein‐Barr virus thymidine kinase gene with concomitant nucleoside antivirals as a therapeutic strategy for Epstein‐Barr virus‐Associated malignancies. Curr Opin Oncol. 2001; 13:360–367. [DOI] [PubMed] [Google Scholar]
- 19. Ghosh SK, Perrine SP, Williams RM, Faller DV. Histone deacetylase inhibitors are potent inducers of gene expression in latent EBV and sensitize lymphoma cells to nucleoside antiviral agents. Blood. 2012; 119:1008–1017. [DOI] [PMC free article] [PubMed] [Google Scholar]
- 20. Stoker SD, Novalić Z, Wildeman MA, et al. Epstein‐Barr virus‐targeted therapy in nasopharyngeal carcinoma. J Cancer Res Clin Oncol. 2015; 141:1845–1857. [DOI] [PMC free article] [PubMed] [Google Scholar]
- 21. Fu DX, Tanhehco YC, Chen J, et al. Virus‐associated tumor imaging by induction of viral gene expression. Clin Cancer Res. 2007; 13:1453–1458. [DOI] [PubMed] [Google Scholar]
- 22. Boerman OC, Laverman P, Oyen WJG. FIAU: from reporter gene imaging to imaging of bacterial proliferation. Am J Nucl Med Mol Imaging. 2012; 2:271–272. [PMC free article] [PubMed] [Google Scholar]
- 23. Bergman AM, Eijk PP, Ruiz Van Haperen VW, et al. In vivo induction of resistance to gemcitabine results in increased expression of ribonucleotide reductase subunit M1 as the major determinant. Cancer Res. 2005; 65:9510–9516. [DOI] [PubMed] [Google Scholar]
- 24. Stevens SJC, Verkuijlen SAWM, Middeldorp JM. Quantitative detection of Epstein‐Barr virus DNA in clinical specimens by rapid real‐time PCR targeting a highly conserved region of EBNA‐1. Methods Mol Biol. 2005; 292:15–26. [DOI] [PubMed] [Google Scholar]
- 25. Greijer AE, Ramayanti O, Verkuijlen SA, Novalić Z, Juwana H, Middeldorp JM. Quantitative multi‐target RNA profiling in Epstein‐Barr virus infected tumor cells. J Virol Methods. 2017; 241:24–33. [DOI] [PubMed] [Google Scholar]
- 26. Lassmann H, Niedobitek G, Aloisi F, Middeldorp JM. Epstein‐Barr virus in the multiple sclerosis brain: a controversial issue‐report on a focused workshop held in the centre for brain research of the medical university of vienna, Austria. Brain. 2011; 134:2772–2786. [DOI] [PMC free article] [PubMed] [Google Scholar]
- 27. Eersels JLH, Travis MJ, Herscheid JDM. Manufacturing I‐123‐labelled radiopharmaceuticals. pitfalls and solutions. J Label Compd Radiopharm. 2005; 48:241–247. [Google Scholar]
- 28. de Jong HWAM, Van Velden FHP, Kloet RW, Buijs FL, Boellaard R, Lammertsma AA. Performance evaluation of the ECAT HRRT: an LSO‐LYSO double layer high resolution, High Sensitivity Scanner. Phys Med Biol. 2007; 52:1505–1526. [DOI] [PubMed] [Google Scholar]
- 29. Matsumoto K, Keishi K, Mizuta T, et al. Performance characteristics of a new 3‐dimensional continuous‐emission and spiral‐transmission high‐sensitivity and high‐Resolution PET camera evaluated with the NEMA NU2‐2001. Standard J Nucl Med. 2006; 47:83–90. [PubMed] [Google Scholar]
- 30. Adham M, Greijer AE, Verkuijlen SAWM, et al. Epstein‐Barr virus DNA load in nasopharyngeal brushings and whole blood in nasopharyngeal carcinoma patients before and after treatment. Clin Cancer Res. 2013; 19:2175–2186. [DOI] [PubMed] [Google Scholar]
- 31. Sides MD, Block GJ, Shan B, et al. Arsenic mediated disruption of promyelocytic leukemia protein nuclear bodies induces ganciclovir susceptibility in Epstein‐Barr positive epithelial cells. Virol. 2011; 416:86–97. [DOI] [PMC free article] [PubMed] [Google Scholar]
- 32. Leung SF, Chan KC, Ma BB, et al. Plasma Epstein‐Barr viral DNA load at midpoint of radiotherapy course predicts outcome in advanced‐stage nasopharyngeal carcinoma. Ann Oncol. 2014; 25:1204–1208. [DOI] [PubMed] [Google Scholar]
- 33. Chua ML, Wee JT, Hui EP, Chan AT. Nasopharyngeal carcinoma. Lancet. 2016; 387:1012–1024. [DOI] [PubMed] [Google Scholar]
Associated Data
This section collects any data citations, data availability statements, or supplementary materials included in this article.
Supplementary Materials
Additional Supporting Information may be found online in the supporting information tab for this article.
Table S1. (A) Mean tumor volumes in mm3 (TV) per group (n = 5) separately for left and right side with standard deviation (SD). Grey box indicate days after treatment. Note that in the group to be treated with VPA alone, mean TV was somewhat larger than average (232 and 186 mm3, respectively).
Figure S1. Overview of EBER‐positive tumor cells in untreated tumors (A), GCb‐only treated (B), VPA‐only treated (C), GCV‐only treated (D), GCb/VPA treated (E), and complete CLVA‐treated tumors (F). Arrowheads indicate remaining EBER+ tumor cells. 40× magnification.