

Abstract
We examined economic inequality and social differences in infant and child mortality and fertility responses to food price changes from 1855–1910 in North Orkney using linked vital records. This small population featured a diverse occupational structure, limited land resources, and geographic isolation from mainland Scotland. Segments of Orkney’s non-agricultural working population were living so close to the margin of subsistence in normal years that an increase in food prices in bad years cost the lives of their children. Delayed childbearing, in addition to increased labour intensity, occupational diversification, and poor relief, failed to mitigate the negative effects of unfavourable prices in this group. While previous studies for Western Europe showed a strong social gradient in the mortality response to food prices, and for Eastern Asia a strong household gradient, this study showed a strong sectoral gradient indicating low standards of living for the non-agricultural working population into the twentieth century.
Keywords: Infant mortality, Child mortality, Fertility, Occupation, Event-history analysis, Staple grain prices, Scotland
Introduction
There is a rich body of literature describing national differences and the long-term development of living standards in the West based on macro records such as GDP per capita, real wages, heights, life expectancy, and literacy rates. While most such measures refer to the entire population, some, like real wages, refer to a particular segment of the population, in this case wage earners. Likewise, heights typically refer to males. From studies based on these records we know that consumption, heights, literacy, and life expectancy improved from the mid-nineteenth century onwards (Oeppen and Vaupel 2002; Floud et al. 2011). Moreover, macro-level studies for England and Sweden demonstrate that vulnerability to short-term economic stress, expressed as average mortality response to high food prices, a measure of supply of food, diminished over time (Lee 1981; Bengtsson and Ohlsson 1985). Since food prices and harvests continued to vary, it means that people found ways to maintain their consumption in bad years. However, we do not know how different social groups responded to short-term economic stress, an important aspect of living standards. While producers may benefit from high food prices, consumers outside the agricultural sector should face problems. To investigate these issues we need micro-level data.
Studies based on longitudinal micro-datasets for pre-industrial populations in Sweden, Belgium, Italy, China and Japan show strong differentials in the distribution of wealth, with the West being much more unequal than the East (Bengtsson et al. 2004). Such data has allowed the use of a new dynamic standard of living concept; namely, the ability to overcome short-term economic stress of different socio-economic groups (Bengtsson 2004a). While economic stress can emerge from different factors, the focus so far has been on food prices, reflecting the supply of food (see Bengtsson 2004a for an overview). People were aware that food prices varied from year to year and they took measures to prevent their effects. Storing food, or accumulating wealth, was an option for food producers. Consumers took different measures, like temporary migration or postponement of births (Bengtsson 2004a; Bengtsson and Dribe 2005). A mortality response to food price increases is an indicator of very low living standards, since it reveals that all measures to smooth consumption failed. Conversely, an absence of any demographic response is an indicator of high living standards. The living standard concept tests for the effects of food prices on mortality and fertility rather than comparing measures or trends in overall mortality or fertility, which can be affected by many factors such as disease environment, breast-feeding practices, water and sanitation, crowding, and proximity to markets (e.g. Livi-Bacci 1991). A comparison of mortality and fertility rates alone may capture these factors rather than living conditions. Moreover, analysing mortality levels is difficult since the information available is limited to, for example, average infant mortality rates or life expectancy over certain periods, while our approach makes full use of all the economic and demographic information from one year to the next.
By employing the new standard of living concept on longitudinal microdata for populations in Sweden, Belgium, Italy, China and Japan we have learned about social differences in living conditions in the past. While landless labours suffered from short-term economic stress in the West, it was non-stem kin members in the complex households that suffered in the East. Measures taken to smooth consumption, such as delaying births and marriages, and out-migration, were not sufficient to prevent household members from dying after years with high food prices (Bengtsson et al. 2004; Tsuya et al. 2010; Lundh and Kurosu et al. 2014). However, the situation for these vulnerable groups improved at the end of the nineteenth century both in the East and the West (Bengtsson and Dribe 2005; Lee and Campbell 2005).
We extend this research by examining land distribution and ability to overcome short-term stress in a setting with a diverse rural economy and remote geographic location, the North Orkney Islands, situated in northern Scotland, in the late nineteenth and early twentieth centuries. It differs from previous studies in the Eurasia Project in that it covers a later period and that the share of non-agricultural workers is far higher. Due to the lack of access to land for this group, we expect it to be more vulnerable to food prices changes than people involved in agricultural production, whether farmers or workers.
We show that the distribution of land was very unequal and that families in the non-agricultural sector lived close to the margin of subsistence, as variations in food prices led to increases in child mortality and delayed fertility. These findings suggest that all other measures, such as temporary migration and poor relief, failed, leaving these groups in a miserable situation. While previous studies for Western Europe have shown a strong social gradient in the mortality response to food prices, and for Eastern Asia a strong household gradient, that in both cases becomes less pronounced by the end of the 19th century, this study suggests a strong sectoral gradient indicating very low standards of living well into the twentieth century.
Mortality and fertility responses to short-term economic stress
Demographic responses to short-term economic stress include migration, postponed marriages, delayed births, and, in extreme cases, mortality (Bengtsson 2004a; Allen et al. 2005b). This study focuses on two of these responses, increased mortality and delayed fertility. A mortality response to food price increases is an indicator of a very low living standard. For some individuals, even normal food intake may have been barely sufficient, leaving them sensitive to variations in the price of food. Low nutritional intake is associated with decreased immune response and increased incidence of diseases that are harmless to a well-nourished person (Rotberg and Rabb 1983, pp. 305–8; Schaible and Kaufmann 2007; Goldstein et al. 2008; Rodríguez et al. 2011). Resource scarcity and competition may leave some individuals, such as the young and elderly, particularly vulnerable to decreased food consumption and the health risks that accompany it. Other extreme demographic responses to economic stress include child neglect and abandonment and crisis migration, which expose people to infectious disease and other risks of travel. In comparative studies, a positive correlation between prices and mortality was found for all ages, with the exception of infants, presumably because of the protective nutritional and immunological effects of breastfeeding (Bengtsson et al. 2004; Allen et al. 2005a; Field 2005).
Short-term economic stress could affect fertility through various mechanisms. Biologically, low nutritional intake may result in foetal loss or amenorrhea. Couples may also deliberately postpone childbearing during difficult economic times. Migration in search of economic opportunity may separate couples and thus also delay fertility, even if such changes in fertility timing were not explicitly planned (Bengtsson and Dribe 2006).
Patterns of responses to prices typically mirror the nature and security of food entitlements. Individuals who were net producers, such as tenant farmers, were buffered from the effects of high prices, as they produced more food than required by their households. Cultivators with only small plots of land and agricultural labourers were vulnerable to food prices since they could not live on what they produced but depended on buying food. Landless labourers were even more vulnerable, as they must both sell their labour on the market and purchase food at market prices. Thus, even among the poor, there was diversity in responses to high prices, as poor labourers were more vulnerable than poor cultivators (Bengtsson 2004a and 2004b). With limited land resources and diversity in rural occupations, the Northern Orkney Islands provide a good context to study variation in living standards, not only in comparison to other regions of Europe, but also among economic sectors within the island community.
Setting: Northern Orkney Islands
The six northernmost islands of Orkney County, Westray, Sanday, Eday, Papa Westray, Faray, and North Ronaldsay, comprise the study area. These islands were chosen because they did not experience extensive reorganization of agriculture, including clearances (Thomson 2000; 2008). Settlement on the islands was dispersed, with the exception of a few small villages. During the study period, the islands relied on smallholder mixed agriculture, with emphasis on grain crops, particularly oats and barley, and animal husbandry. Other important economic activities included fishing, rural manufacturing, and craft production, employing about one third of the population (Table 1). The late nineteenth century was a time of economic stagnation as the kelp industry had collapsed and an agricultural downturn, driven by overseas competition, had begun (Thomson 1983; 2008a).
Table 1.
Father’s occupational sector and category for children ages 1–15, 1855–1910
| Person-years | Per cent of person-years | |
|---|---|---|
| Agricultural Sector | ||
| Farmer | 16332.80 | 39.77 |
| Agricultural labourer | 5078.73 | 12.37 |
| Agricultural servant | 2836.61 | 6.91 |
| Crofter | 1108.41 | 2.70 |
| Factor or farm manager | 264.11 | 0.64 |
| Landed proprietor | 19.68 | 0.05 |
| Non-agricultural Sector | ||
| Fishing or fish processing | 7147.83 | 17.40 |
| Skilled trades | 3020.27 | 7.35 |
| Artisan and crafts | 1948.95 | 4.75 |
| Sailing and shipping | 1437.94 | 3.50 |
| Merchantile | 807.04 | 1.97 |
| Unskilled labour | 478.11 | 1.16 |
| Education | 315.01 | 0.77 |
| White collar | 158.90 | 0.39 |
| Religious | 52.55 | 0.13 |
| Service and hospitality | 48.97 | 0.12 |
| Medical personnel | 14.00 | 0.03 |
Source: Individual-level birth, death, and marriage records, North Orkney
Archived at Orkney Library and Archive.
Absentee landlords owned the majority of land and their holdings were managed by a factor and worked by hired agricultural labourers or divided up and leased out to smallholders who paid rent in kind or in cash. Leases varied in length from one year to life-long contracts, which could be inherited (Schrank 1995; Irvine 2009). Few farmers were owner-occupiers in this period (Thomson 2008b). Outside of rental agreements, farmers could not acquire additional land. Instead, households could choose to improve the land they had, since the geographic limitations of the islands meant that it was impossible to expand significantly the total amount of land under production.
The study period was characterized by high levels of inequality in land values as recorded in land valuation rolls (Figure 1). In 1881, approximately 13 per cent of households had no access to land, and the bottom 50 per cent of households had access to less than 10 per cent of the land value on the islands. Other years in the study period exhibited a similar pattern. This land value distribution was similar to that of other regions in Western Europe. In early nineteenth century Sart, eastern Belgium, the figures were the same as in Orkney, while in Scania, southern Sweden, the bottom 65 per cent had access only to 5 per cent of the land (Lee et al. 2004).
Figure 1. Distribution of valuation of landholdings in North Orkney, 1881.
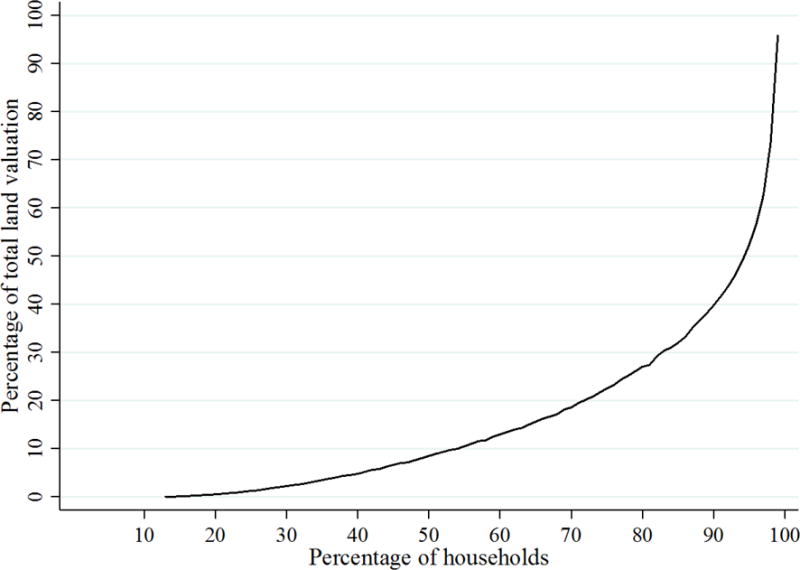
Source: Valuation rolls for the parishes of Westray, Papa Westray, Lady, Cross, Burness, Eday and Pharay, and North Ronaldsay, Orkney County, Scotland, archived at the Orkney County Library and Archive.
The population of the islands reached its peak in the mid-nineteenth century and began a process of decline that continues today (Figure 2). During the study period, fertility also began to decline. While the crude birth rate decline in Orkney mirrored Scotland as a whole, but at lower levels, the crude death rate was rather different, as shown in Figure 3. As the crude death rate of Scotland declined from 20 to 15 per thousand during the study period, the corresponding numbers for the North Orkney Islands fluctuated around 15. Urban centres drove the higher country-level rates in the beginning of the period. The low crude death rates at the beginning of the period were comparable to other data from the far north of Scotland (Flinn et al. 1977 pp. 380–383). Similarly, infant mortality was lower in Orkney than the aggregate rates for Scotland, ranging from 39–53 per cent lower than national rates. This pattern held for most other Scottish rural-urban and rural-aggregate comparisons (Flinn et al. 1977). However, the trend of the relatively late decline in the infant mortality rate in Scotland, which occurred in the early twentieth century, also held for Orkney.
Figure 2. Population of the Northern Islands of Orkney, Scotland, 1841–1931.

Note: Dotted lines indicate study period
Source: 1851–1901 individual census returns for North Orkney (archived at Orkney Library and Archive) and Barclay (1965).
Figure 3. Crude birth rates (CBR) and crude death rates (CDR), North Orkney and Scotland.

Note: Dotted vertical line indicates end of study period
Source: Aggregate census reports of Scotland, archived at Orkney County Library and Archive
Previous work on the predictors of infant and child mortality in Orkney demonstrated that mortality was associated with household composition (Sparks 2007; Sparks et al. 2013) and climate conditions (Jennings et al. 2012). These findings suggested that the standard of living on the islands was, at least for some households, close to the margin of subsistence. We therefore expected mortality and fertility to respond to the short-term economic stress of changing grain prices, even though the study period began later than that of much of the prior work on demographic responses to price fluctuations in Europe (Bengtsson et al. 2004; Allen et al. 2005a; Tsuya et al. 2010).
We expected different mortality and fertility responses to price fluctuations among occupational groups, as they had varying access to land and would therefore react differently to changes in food prices (Bengtsson 2004a). In this work we categorize occupations into two sectors, agricultural and non-agricultural. We describe the definitions of these groups and their access to resources in the methods section. The agricultural group has access to land and were unlikely to respond demographically to price increases as they had resources to draw upon. For the non-agricultural group, we expect the majority to be dependent on food prices, and therefore to be affected by food price changes.
In Orkney, some local institutions and practices buffered the effects of economic stress, but they may not have been sufficient to protect all segments of the population. It was common for individuals in North Orkney to have more than one occupation. When classifying occupations individuals were assigned the group that most closely matched their primary occupation. For example, a person listed as “farmer and blacksmith” would be coded as a farmer because the blacksmith work was a likely supplement to primary agricultural employment. In cases where the distinction between primary and secondary occupation was less clear, the first listed occupation was given priority. Occupational diversity could buffer against economic stress, as it provided alternative sources of income in years of high food prices. Orkney’s island geography also provided inhabitants with ocean resources, which could be a fall-back in times of economic stress. While some individuals were employed full-time in fishing and maritime industries, others had access to ocean resources, such as shorelines for fishing, sea bird hunting and egg collecting, and kelp harvesting (Fenton 1997). Further, many households that could afford to do so owned a small boat. Should these households face high food prices, temporary or part-time fishing for household consumption could serve as a substitute for food bought at market prices.
In many contexts, institutions can provide relief to those suffering from economic stress. In Orkney, limited public assistance was available through the Poor Laws, as it was difficult to obtain relief under the nineteenth century Scottish Poor Law. Only aged and disabled men were eligible, leaving the able-bodied unemployed without access (Mitchison 1974; 2002). Able-bodied women were eligible for relief if they had young children to care for or were widows (Paterson 1976). It was not until after the end of our study period that a series of laws to assist the able-bodied poor and unemployed were in place in Scotland (Smout 1986). In North Orkney, there were few low-cost housing options for the poor, as there were no workhouses or old-age homes on the northernmost islands. One or two small private houses on the larger islands had been set aside for lease to the poor at reduced rents, but these accommodations could not house all of the needy.
Other resources, such as storage systems to protect against shortfalls, can reduce the effects of short-term economic stress. There is little evidence that such protections were in place in North Orkney. During the poor harvest years of 1782–1785, kelp production helped offset the effects of harvest failure, but the kelp market had collapsed by the beginning of the study period (Thomson 1987). Fishing may have also helped, but when fishing and farming failed in the same years in neighbouring Shetland, there was excess mortality (Thomson 1983). During the potato blight years, 1846–1849, government response was the only source of relief.
Data
The data for this study came from linked vital records of births, deaths, and marriages and records of prices of staple grains in Orkney County. The current system of civil vital registration in Scotland began in 1855, and members of the North Orkney Population History Project (NOPH) digitized these records (Sparks 2007; Jennings 2010). The study period ended in 1910 to avoid potential effects related to inflation during World War I since our interests were in the way people responded to anticipated variations in food prices. Individual life courses were reconstructed using the methods of family reconstitution (Henry and Blum 1988; Gutmann and Alter 1993). In addition to the timing of vital events, these registers provided information about the occupation and place of residence of the individual, as well as the names, occupations, and birthplaces of the individual’s parents.
As with nearly all reconstitution studies, information about out-migration and return migration were unavailable, as migration was not recorded in documents. While the precise extent of out-migration from Orkney is not known, we know from work from other regions of Scotland that rates of permanent out-migration and temporary labour migration might have been high (Anderson 2000). Indeed, estimates of out-migration as a percentage of natural increase (excess births over deaths) for all of Scotland ranged from 10 to 47 per cent in the study period (Flinn et al. 1977). Estimates of migration drawn from records in 1843 suggest, however, that Orkney had a lower migration rate than the Highlands and Western Isles (Levitt and Smout 1979). Still, since we cannot trace migration from the islands, our analysis was limited to those who remained in the study area. We attempted to limit the influence of unobserved migration in our choice of location (isolated islands), study groups (infants and children under age 15 for the mortality models, and married couples for the fertility models), and censoring. Moreover, in bad years job opportunities were also lacking on the mainland. Yet, temporary migration could affect fertility through the separation of spouses and it was difficult to distinguish whether price effects were related to migration or mechanisms such as malnutrition. We conducted a series of sensitivity tests to assess the potential effects of unobserved migration in the mortality models (estimates for these and all other sensitivity tests are available from the authors upon request). Estimated models for children aged 1–12 (rather than 1–15) were not significantly different from the results reported here.
Using the family reconstitution method, 70 per cent of births were linked to the marriage records of their parents and 34 per cent of deaths were linked to the corresponding birth record. Of deaths of children under age 15, 81 per cent of deaths could be linked to birth records. Some of the 19 per cent of unlinked cases resulted from children who migrated in to the islands, or children who could not be distinguished from each other using nominal linkage. Among adults, common causes of linkage failure included migration, a vital event (birth or marriage) occurring before 1855 (the beginning of the system of civil registration), and inability to distinguish cases based on names and dates.
Under-registration of births and deaths is a common problem in historical demographic data. If this under-reporting varied systematically, statistical analysis of the data may be biased. To check for the under-registration of births and infant deaths, we examined the sex ratio at birth, the percentage of infant deaths recorded less than one month of age, and the proportion of males and females represented among infant deaths. These measures were also calculated separately by occupational group to determine whether they varied systematically by the occupation of the father of the infant. We find that for all but one 10-year period (1905–15), the sex ratio at birth fell within the range of 1.01–1.15 males per female. In only two of the 10-year intervals (beginning in 1855 and 1865) did the proportion of infant deaths in the first month fall below 40 per cent of total mortality in the first year of life. Occupational groups did not differ in the percentage of infant mortality concentrated in the first month, but did significantly differ in the sex ratio at birth in one ten-year period (1885–95). The models were robust to specifications that control for these periods or exclude these periods, as described below. We therefore concluded that the data are of high quality, with some minor potential under-registration of infant deaths and one period where there were differences between occupational groups.
Grain prices came from the annual fiars prices for Orkney County (Figure 4). Fiars prices, loosely translated to “market scale prices” and hereafter referred to as prices, were standardized exchange rates set by local leaders during a sheriffs’ court session each February for the previous autumn harvest (Mitchison 1965; Gibson and Smout 2007). These prices were the set authorized prices for each growing season at the county level, and took into account local levels of production and market prices between the end of the harvest in November to the setting of prices in February (Coull 2011). The prices can therefore be interpreted to be a reflection of the market for grain for each harvest year, extended from November of one year to the November of the next. The prices were used to translate customary payments in kind into payments in cash for each harvest year. The time series of the grain prices were complete, with no missing years in the study period. While some caution must be used in interpreting the fiars prices (see Gibson and Smout 2007 for detailed discussion), they did mirror trends in market prices and reflect local variation, making them suitable for historical analysis (Mitchison 1965). This study focused on the price of oatmeal, specifically black oats, a variety adapted to the climate in Orkney and an important staple grain (Fenton 1997).
Figure 4. Time series of Orkney County prices of black oats, per unit of 140 Imperial Pounds, in Pounds Sterling.

Note: Dotted lines indicate study period.
Source: Fiars (grain) prices for Orkney County, archived at the Orkney Library and Archive.
Methods
Cox proportional hazard models (Stata 14, stcox command) were used to explore the relationship between oatmeal prices and the timing of births and deaths (Cox 1972). Separate models were used to estimate the effects of prices on fertility and mortality, as well as to explore these effects for different occupational sectors. Oatmeal prices, referring to the harvest year, 1 November of year t to 31 October of the following year t+1, were detrended by taking the natural log of prices and then applying a Hodrick-Prescott (HP) filter (Hodrick and Prescott 1997) with a filtering factor of 6.25 (Figure 5), which is the recommended value to remove the trend from yearly series (Ravn and Uhlig 2002). Current and one-year lagged prices were included in the models. A lagged price term is not included in the models for 0–1 year olds, as this would reflect exposure to conditions in utero, which is not the primary focus of this study. Thus we analysed the events taking place within 24 months following a harvest. Alternative model specifications tested other local staple grains and prices from the Midlothian County, the largest Scottish market. The results for these alternative specifications were similar to those of oatmeal in Orkney. This was not surprising, given the broad similarities in prices in the two counties. Similar results were also found when a set of categorical threshold variables (low, medium, and high prices, determined by taking one standard deviation from the mean as a cutoff) was used in place of a continuous price variable. These model estimates were in the same direction and had p-values comparable to the continuous price variable. Models were also robust to alternative specifications that set the beginning and end of the harvest year for a few weeks to a month in either direction.
Figure 5. Detrended prices of black oats using H-P filter.

Note: Dotted lines indicate study period.
Source: As for Figure 4
Mortality models were estimated for different age and occupational groups. The models shown here are for children aged 0–1 and 1–15. Models for adults required careful consideration of time of exposure and fell out of the analysis. Subjects in the 0–1 age group entered observation at birth and exited at death or when they reached age 1. Subjects in the 1–15 age group entered observation on their first birthday and exited when they died or reached age 15. Individuals whose death was not observed before age 15 were considered as being under observation until age 15 if their death or their marriage or the death of a parent was observed on a date that followed their fifteenth birthday. All other children were excluded from the age 1–15 analytic sample (i.e. those for whom only the date of birth was observed). Age 15 was chosen as a cut-off because children under such age are unlikely to leave the parental home, thereby reducing the chances of unobserved migration, but they are not subject to the potential protective effects of breastfeeding as infants under age 1 might be. Children who in-migrated to the islands were not considered in the study since it was not possible to define exposure for them, given the lack of data on dates of migration. The Breslow method (Breslow 1974) was used in the case of tied events, namely the death of two or more individuals on the same day.
A linear term for year was used to control for period effects, as it was more efficient than using fixed effects for decade-long periods and the results were robust to both specifications. An indicator variable was used to control for the sex of the individual, as males and females experience different risks of mortality in infancy and early childhood.
Models were estimated for all individuals with a control for occupational group, for all individuals with occupation and price interaction terms, and separately by occupational group. Father’s or husband’s occupation was chosen to represent occupational group since few females had occupations listed in the records. To reflect the economic realities of life in Orkney, occupations were classified into two groups that focused in sector differences: non-agricultural agricultural occupations and agricultural occupations. The landless non-agricultural group included all non-agricultural workers, regardless of status, such as blacksmiths, woollen weavers and merchants. The agricultural group was composed of landed farmers who were owner-occupiers and tenants with long-term leases as well as of the semi-landless. The semi-landless were workers with short-term leases that were contingent on employment and all other agricultural occupations, mainly crofter, ploughman, and agricultural servant. These households had limited access to land, and were paid both in kind and in cash.
We initially classified the semi-landless as a separate occupational category, but preliminary analyses revealed that this group did not include sufficient numbers of individuals to support separate analysis (15 per cent of the sample). Therefore, they were combined with the landed agricultural producers. The non-agricultural group was likely heterogeneous as well, but there were not enough numbers to consider separate subgroups of high or low status. Even if there was heterogeneity within each group, the largest differences were between the two sectors. Agricultural producers, regardless of the amount of land held, had more ready access to food resources than the landless, who purchased all food at market prices. While the semi-landless were disadvantaged relative to landed producers, their ability to grow some food and keep some livestock in addition to partial payment of wages in kind, sheltered them from fluctuations in the price of food. To provide sufficient sample size while balancing potential heterogeneity within groups, we present the estimates for all socioeconomic groups in the same sector, but also conducted sensitivity analyses that focus on subgroups of such sectors.
Summary statistics for infants and children aged 1–15 years are presented in Tables 2–3. In both age groups, the proportion of females was slightly higher than that of males. Summary statistics of raw and logged and detrended prices were also reported. Logged and detrended prices have, by definition, a mean of zero, and reported mean values are close to zero, with some error produced by differences in person-years of exposure over time or between occupational groups. The effect of a 10 per cent change in the oatmeal price covariate was estimated in Tables 5–7 to facilitate comparisons with the results obtained for other European populations (Bengtsson et al. 2004). A 10 per cent change does not represent extreme circumstances such as a famine, but instead reflects a magnitude of fluctuation that was rather common.
Table 2.
Summary statistics for models of mortality ages 0–1
| All Individuals | Non-Agricultural | Agricultural | |
|---|---|---|---|
| Percent agricultural occupation, ref. | 63.46 | – | – |
| Percent non-agricultural occupation | 36.54 | – | – |
| Percent female, ref. | 50.50 | 51.92 | 49.71 |
| male | 49.50 | 48.08 | 50.24 |
| Mean oatmeal price, logged, detrended (std. dev.) | 0.001 (0.082) | 0.001 (0.083) | 0.001 (0.081) |
| Number of person-years | 3457.11 | 1263.11 | 2194.00 |
| Number of individuals | 3730 | 1367 | 2363 |
| Number of Deaths | 317 | 125 | 192 |
Note: Percentages are the per cent of person-years
Sources: NOPH database and grain prices archived at Orkney Library and Archive
Table 3.
Summary statistics for models of mortality ages 1–15
| All Individuals | Non-Agricultural | Agricultural | |
|---|---|---|---|
| Percent agricultural occupation, ref | 63.26 | – | – |
| Percent non-agricultural occupation | 36.74 | – | – |
| Percent female, ref. | 51.07 | 49.77 | 52.67 |
| male | 48.90 | 50.17 | 47.33 |
| Mean oatmeal price, logged, detrended (std. dev.) | 0.0005 (0.0793) | 0.0004 (0.0787) | 0.0004 (0.0786) |
| Mean lagged oatmeal price, logged, detrended (std. dev.) | 0.002 (0.081) | 0.0007 (0.080) | 0.0007 (0.0799) |
| Person-years | 40998.97 | 15062.61 | 25936.36 |
| Individuals | 3359 | 2136 | 1228 |
| Deaths | 232 | 132 | 100 |
Note: Percentages are the per cent of person-years
Sources: NOPH database and grain prices archived at Orkney Library and Archive
Table 5.
Cox proportional hazard model of mortality for ages 1–15 for all individuals and for different occupational groups
| All Individuals | Interaction | Agricultural | Non–agricultural | |||||
|---|---|---|---|---|---|---|---|---|
| Rel risk | p–value | Rel risk | p–value | Rel risk | p–value | Rel risk | p–value | |
| Year | 0.992 | 0.108 | 0.993 | 0.115 | 0.996 | 0.542 | 0.987 | 0.083 |
| Agricultural occupation, ref | 1.000 | – | 1.000 | – | – | – | – | – |
| Non-agricultural occupation | 1.304 | 0.045 | 1.271 | 0.076 | – | – | – | – |
| Sex, female, ref. | 1.000 | – | 1.000 | – | 1.000 | – | 1.000 | – |
| male | 0.915 | 0.493 | 0.917 | 0.499 | 0.898 | 0.524 | 0.944 | 0.775 |
| Oatmeal price, 10 % increase1 | 20.114 | 0.020 | 11.953 | 0.277 | 12.363 | 0.266 | 30.268 | 0.027 |
| Oatmeal price X non-agricultural, 10 % increase1 | – | – | 17.754 | 0.305 | – | – | – | – |
| Lagged oatmeal price (1 year), 10 % increase1 | 1.351 | 0.862 | −1.019 | 0.920 | −0.817 | 0.936 | 4.282 | 0.718 |
| Lagged oatmeal price X non–agricultural, 10 % increase1 | – | – | 5.391 | 0.735 | – | – | – | – |
|
| ||||||||
| N=3359 subjects, | N=3359 subjects, | N=2136 subjects, | N=1228 subjects, | |||||
| 232 deaths | 232 deaths | 132 deaths | 100 deaths | |||||
Effects of a 10 % increase in oatmeal prices are expressed in percentage change in mortality
Sources: As for Table 2
Table 7. Cox proportional hazard model of fertility with robust standard errors, estimated by clustering over mother’s identifier.
Models for all individuals and for different occupational groups are shown.
| All Individuals | Interaction | Agricultural | Non-agricultural | |||||
|---|---|---|---|---|---|---|---|---|
| Rel risk | p-value | Rel risk | p-value | Rel risk | p-value | Rel risk | p-value | |
| Year | 0.997 | 0.020 | 0.997 | 0.019 | 0.998 | 0.300 | 0.995 | 0.021 |
| Age 15–24 | 0.991 | 0.838 | 0.992 | 0.857 | 0.939 | 0.290 | 1.083 | 0.307 |
| Age 25–29, ref. | 1.000 | – | 1.000 | – | 1.000 | – | 1.000 | – |
| Age 30–34 | 0.987 | 0.766 | 0.987 | 0.776 | 0.972 | 0.619 | 1.004 | 0.961 |
| Age 35–39 | 0.869 | 0.041 | 0.870 | 0.043 | 0.850 | 0.053 | 0.909 | 0.422 |
| Age 40–49 | 0.667 | 0.003 | 0.667 | 0.003 | 0.657 | 0.010 | 0.702 | 0.170 |
| Previous child alive, ref. | 1.000 | – | 1.000 | – | 1.000 | – | 1.000 | – |
| Previous child dead | 1.717 | <0.001 | 1.717 | <0.001 | 1.583 | 0.003 | 1.863 | <0.001 |
| Agricultural Occupation, ref. | 1.000 | – | 1.000 | – | – | – | – | – |
| Non-agricultural occupation | 0.915 | 0.015 | 0.907 | 0.013 | – | – | – | – |
| Oatmeal price, 10 % increase1 | −0.131 | 0.953 | 0.170 | 0.954 | 0.132 | 0.965 | −0.589 | 0.867 |
| Oatmeal price X non-agricultural, 10 % increase1 | – | – | −0.769 | 0.868 | – | – | – | – |
| Lagged oatmeal price (1 year), 10 % increase1 | −4.219 | 0.060 | −2.700 | 0.364 | −2.979 | 0.320 | −6.209 | 0.088 |
| Lagged oatmeal price X non-agricultural, 10 % increase1 | – | – | −3.843 | 0.430 | – | – | – | – |
|
| ||||||||
| N=1010 subjects, | N=1010 subjects, | N=648 subjects, | N=467 subjects, | |||||
| 1559 births | 1559 births | 940 births | 619 births | |||||
Effects of a 10 % increase in oatmeal prices are expressed in percentage change in fertility
Sources: As for Table 2
The fertility models were estimated for second-order and higher births, also using Cox proportional hazard models. First births were not included because the timing of first births was closely correlated with the timing of marriage. Robust standard errors were estimated by clustering over a family identifier to adjust for unobserved shared characteristics of a mother across all her children’s births. Individuals entered observation at the time of the birth of their first child. Individuals exited observation at their date of death or the death of their spouse, or if neither of these dates were observed, at the last date of death of a child aged 15 or younger. If none of these three events were observed, the date of birth of the last child was taken to be the last date of observation. Individuals were, in addition, censored when a mother reached the end of her childbearing years, taken to be age 50. To attempt to reduce the potential confounding effects of the out-migration of families, individuals exited observation once six years had elapsed since the birth of their previous child, should it occur before age 50 or any other censoring event. As a sensitivity analysis, we also estimated models that only considered women for whom the complete fertility period was observed, in other words, women who were observed from their birth or marriage until their death or the death of their husband. The results did not vary from those presented in Table 7.
Time-varying controls included a yearly linear specification of time, as it was more efficient than a series of period indicator variables and the models were robust to both the linear and period time specifications. A series of indicator variables controlled for the mother’s age, as fecundity and the risk of giving birth varies with age. An indicator variable controlled for the vital status of the previous child (alive or dead), as the early death of the previous child had been demonstrated to decrease time to next birth in populations that practiced breastfeeding. Following previous studies, we also subdivided the “dead” category into two groups, according to whether less or more than two years had elapsed from the previous birth, but it was not possible to consider this distinction in the models due to small numbers. This variable therefore did not only capture effects on fertility that could relate to the cessation of breastfeeding, but it also captured effects that could relate to child replacement. The same occupational categories and modelling approaches used in the mortality models were applied to the fertility models. Summary statistics are presented in Table 4. The proportion of females aged 15–34 was higher than those aged 35–49. Around 4 per cent of the time at risk corresponded to females whose previous child died. These distributions were similar across different occupational groups.
Table 4.
Summary statistics for models of fertility
| All Individuals | Non-Agricultural | Agricultural | |
|---|---|---|---|
| Per cent agricultural occupation, ref | 58.51 | ||
| Per cent non-agricultural occupation | 41.49 | ||
| Age 15–24 | 24.72 | 25.07 | 24.47 |
| Age 25–29, ref. | 39.98 | 42.40 | 38.27 |
| Age 30–34 | 22.73 | 20.89 | 24.05 |
| Age 35–39 | 9.12 | 9.08 | 9.15 |
| Age 40–49 | 3.44 | 2.57 | 4.06 |
| Previous child alive, ref. | 96.18 | 95.15 | 96.91 |
| Previous child dead | 3.82 | 4.85 | 3.09 |
| Mean oatmeal price, logged, detrended (std. dev.) | −0.0003 (0.083) | 0.0001 (0.084) | 0.0006 (0.082) |
| Mean lagged oatmeal price, logged, detrended (std. dev.) | −0.001 (0.084) | −0.001 (0.083) | −0.001 (0.083) |
| Person-years | 5323.31 | 2208.69 | 3114.62 |
| Individuals | 1010 | 467 | 648 |
| Births | 1559 | 619 | 940 |
Note: Percentages are the per cent of person-years
Sources: As for Table 2
Results
For children aged 1–15 (Table 5), high current oatmeal prices, but not lagged prices were associated with higher mortality in the main model. A 10 per cent increase in oatmeal prices was associated with a 20 per cent increase in mortality. The indicator variable for non-agricultural occupations was positive and statistically significant, indicating that the children of non-agricultural workers experienced higher mortality risk than those engaged in agriculture. A model that included the interaction of price and occupational group did not result in a statistically significant interaction term. However, the magnitude of the effect did change. To allow for differences in baseline hazards between the two occupational sectors, separate models were estimated for the agricultural and non-agricultural groups. In these separate models, the children of non-agricultural workers were more sensitive to the negative effects of high prices when compared with the children of agriculturalists. A 10 per cent increase in oatmeal price was associated with an increase in mortality of 30 per cent. As a sensitivity analysis a model was estimated excluding occupations with higher status (religious, medical personnel, education, white collar, skilled trades, service and hospitality and mercantile), which accounted for 28.6 per cent of the non-agricultural group. The results were even stronger: a 10 per cent increase in prices was associated with a 35 per cent increase in mortality (p-value 0.04). For the children of families employed in agriculture, high prices were also associated with increased hazard of mortality, but this effect was smaller and not statistically significant. Small and non-statistically significant results were also obtained in relation to prices when estimating a model for the agricultural sector excluding the semi-landless group, which accounted for 36 per cent of the agricultural sector. The effects of sex of the child and time were not statistically significant.
In contrast, for children younger than age 1 (Table 6), there was no significant effect of oatmeal prices in the current year. Males experienced higher infant mortality than females, a pattern common to populations without a strong child sex preference. There was no significant effect of non-agricultural occupation, and separate models were included for a full comparison with the 1–15 age group. There was no significant effect of prices in the occupation-specific models. The absence of strong effects likely reflected the positive effect of breastfeeding on infant nutrition and immune response. In combination with the findings from child mortality (ages 1–15), it appeared that the mortality of young people was sensitive to short-term economic stress only after the weaning period.
Table 6.
Cox proportional hazard model of mortality for ages 0–1 for all individuals and for different occupational groups
| All Individuals | Interaction | Agricultural | Non–agricultural | |||||
|---|---|---|---|---|---|---|---|---|
| Rel risk | p–value | Rel risk | p–value | Rel risk | p–value | Rel risk | p-value | |
| Year | 1.014 | <0.001 | 1.014 | <0.001 | 1.013 | 0.004 | 1.014 | 0.013 |
| Agricultural occupation, ref. | 1.000 | – | 1.000 | – | – | – | – | – |
| Non-agricultural occupation | 1.157 | 0.205 | 1.157 | 0.204 | – | – | – | – |
| Sex, female, ref. | 1.000 | – | 1.000 | – | 1.000 | – | 1.000 | – |
| male | 1.372 | <0.001 | 1.373 | <0.001 | 1.391 | <0.001 | 1.307 | 0.137 |
| Oatmeal price, 10 % increase1 | −2.947 | 0.661 | −3.743 | 0.666 | −3.892 | 0.653 | −1.928 | 0.856 |
| Oatmeal price X non-agricultural, 10 % increase1 | – | – | 2.064 | 0.883 | – | – | – | – |
|
| ||||||||
| N=3730 subjects, | N=3730 subjects, | N=2363 subjects, | N=1367 subjects, | |||||
| 317 deaths | 317 deaths | 192 deaths | 125 deaths | |||||
Effects of a 10 % increase in oatmeal prices are expressed in percentage change in mortality
Sources: As for Table 2
Fertility also responded to changes in economic conditions (Table 7). In the main model (all individuals), lagged oatmeal price was associated with decreased fertility, but the estimate was only marginally statistically significant (p=0.06). The effect of current prices was smaller and not significant. A 10 per cent increase in food prices was associated with a 0.1 per cent decline in fertility in the current year and a 4 per cent decline in the second year. Non-agricultural occupation was associated with decreased fertility. Similar to the child mortality model, the interaction model for fertility did not produce statistically significant interaction terms. In separate models for each occupational group, estimates for current and lagged prices failed to reach statistical significance for the agricultural group and were only marginally significant for the non-agricultural group (p=0.088). The effect of lagged prices was stronger in the non-agricultural group than in the agricultural group. Results for the individual-level control variables were consistent with expectations from the fertility and infant mortality literature (Tsuya et al. 2010). Older mothers were less likely to progress to the next birth. If a previous child had died, the hazard of a subsequent birth increased. We also noticed a significant, negative effect of time in the models for all individuals and the non-agricultural model. This was consistent with prior work demonstrating declining fertility among non-agricultural workers and more stable fertility among agricultural occupations (Sparks 2009).
Summary and discussion
High levels of inequality in land values characterized the late nineteenth and early twentieth century North Orkney Islands. The bottom 50 per cent of households had access to less than 10 per cent of the value of land on the islands, similar to that of other regions in Western Europe. There were few institutions that provided security in hard economic times. Thus, the inhabitants had to rely on their own household savings and labour supply when times were bad. Given the inequality in access to land, we anticipated that years of high food prices were particularly difficult for landless non-agricultural groups, leading to the reduction of births and loss of lives.
Among children aged 1–15, mortality increased during years with high oatmeal prices. The significant association with current year prices reflected an immediate response to economic fluctuations, rather than a lagged, or delayed response. A current year response is attributed to rapid responses to economic conditions, such as reduced food intake and accompanying increased vulnerability to infectious disease, while a lagged response would be associated with longer-lasting effects, such as inability to recover from negative shocks. As anticipated, the children of non-agricultural workers were particularly vulnerable to high prices, while the mortality of the children of households that participated in agriculture was not affected by oatmeal prices. The model results and sensitivity analysis showed that (1) the two sectors were heterogeneous in terms of their response, (2) no group within the two sectors benefited from high food prices, instead what varied was the degree to which they were affected, and (3) overall the largest differences were between the two sectors. This finding indicates that although the simple 2-group socioeconomic classification of occupations is crude, it does capture an important aspect of standards of living in nineteenth and early twentieth century Orkney. Non-agricultural workers appear to have been at an economic disadvantage relative to agricultural workers of any kind. Indeed, they were so close to the margin of subsistence that the mortality of their children was affected immediately by fluctuations in food prices, but these effects were not long lasting once economic conditions returned to normal. Agricultural workers had access to land, and even small plots would have supplemented any wages paid in cash or kind, and could buffer the negative effects of high food prices. In addition, in times of high prices, farmers may have been better able to hire laborers, so employment security for agricultural laborers was likely higher during high price years than non-agricultural workers. These factors may explain some of the differences observed between agricultural laborers and non-agricultural workers.
These findings parallel many of the results of studies of similar design in the European context. In Swedish, Italian, and Belgian populations, the risk of mortality for children above age one, but not infants, was sensitive to negative economic conditions (Oris et al. 2004). The magnitude of the mortality response in Orkney is higher than these other contexts. A 10 per cent increase in prices was associated with a 20 per cent increase in mortality for children aged 1–15 in Orkney, while a 10 per cent increase in prices led to an 11 per cent increase in mortality in Italy and a 10 per cent decline in real wages led to a 4 per cent increase in mortality in Sweden, and 3 per cent increase in Belgium. The effects of social status share commonalities across other European populations, although in Orkney sector differences appeared to be greater than class differences. These sector differences remain, even after excluding the highest-status individuals from analysis (18 per cent increase in mortality with a 10 per cent increase in prices, p=0.03).
Children born to the poorest families experienced higher risk of mortality across a range of settings (Oris et al. 2004). In Orkney, the children of non-agricultural workers experienced 30 per cent higher risk of mortality than the children of agricultural workers. The children of day labourers in Italy and Belgium were 1.5 times more likely to die than the children of any other social class. In southern Sweden, the children of the landless, a group comparable to the non-agricultural group in Orkney, experienced higher mortality in years of low real wages (Bengtsson 2004b). In both of these settings, households without access to land lived on the edge of subsistence, as even small (10 per cent) variations in food prices or real wages placed the lives of their children at risk.
The findings, although only marginally statistically significant, for fertility responses to high grain prices provide additional evidence that non-agricultural workers lived close to the margin of subsistence during this period. In comparison to agricultural households, the risk of fertility in non-agricultural households was lower. Further, when lagged oatmeal prices were high, these families faced a reduction in births. The lagged effect was likely an outcome of malnutrition or possibly of the separation of spouses due to temporary migration, since planned responses have a sudden effect (Bengtsson and Dribe 2006). If couples could foresee economic stress, they could adjust their fertility behaviour to match the conditions of the current year. Thus, our findings suggest that people were unable to predict bad times or were unable to match their fertility timing to prevailing economic conditions.
When placed in the context of similar studies, estimates of fertility decline in response to food price variation in Orkney were slightly larger in magnitude than those observed in southern Sweden and Belgium, but were only marginally statistically significant (Bengtsson and Dribe 2010). In contrast to findings in southern Sweden, where the strongest fertility responses were found in current year prices and weaker responses in the second year, the effect of increased prices in the second year were stronger in Orkney. This suggests that different mechanisms may have been involved in these two settings. In Sweden, parents could anticipate bad years and plan their fertility accordingly, which resulted in an immediate response to price increases. In contrast, the fertility of parents in Orkney showed a delayed response, which is more likely to be attributable to the effects of mechanisms that take longer to develop, such as nutritional deficiency. However, while the timing of the response differed in Orkney and Sweden, the socioeconomic gradient of the response is similar. In both contexts, fertility was more likely to be delayed among the landless.
These findings suggest that standards of living, at least for this landless, non-agricultural segment of the population, were low during the study period. The remote location, relative lack of industrial development in the islands during this period, and the persistence of smallholder mixed agriculture, which offered only limited opportunities for rural manufacturing, artisan production, and service sector employment, may be partly responsible for the observed mortality and fertility patterns. If these non-agricultural workers had access to maritime resources or small garden plots, these alternative food sources did not provide enough resources to counteract the negative effects of unfavourable price fluctuations. In addition, non-agricultural workers were under economic strain, despite their ability to migrate, as they were not tied to the land. However, we cannot determine whether the non-agricultural workers that could leave did so, leaving only the poorest families on the islands, or whether the poorest households left the islands, so that even the more advantaged “stayers” were still negatively affected by food price changes. Our findings were also consistent with the expectation that farmers and agricultural workers, even those with smaller plots, would be subject to less economic stress, as household food production buffered them from the effects of variation in food prices.
In the greater context of living standards in Scotland and the rest of the United Kingdom in the nineteenth century, our findings parallel some earlier studies. For example, in the nineteenth century, there was extensive rural poverty in the Highlands and Islands regions of Scotland (Crowther 1997). While most studies emphasize the hardships of the potato famine and clearances in the Highlands, our study indicates that low standard of living extended northward in to Orkney. Further, in reports collected in 1843, indicators of standard of living place Orkney just behind the Highlands and Outer Hebrides (Levitt and Smout 1979). In the Highlands, North, and Northwest of Scotland, values of land and houses were low, wages were low, and unemployment was high. The benefits of industry and agricultural improvement were limited to the southern regions of the country, where land values and wages could, in places, rival those of England. It should be noted that while living standards were low in Orkney, mortality rates were higher in urban Scotland and likely related to the disease environments in the cities. Responses to short-term stress can reveal low standard of living that might be otherwise masked by differences in levels of mortality or fertility that are related to other factors.
Previous studies that used similar methods as this work showed a strong social gradient in mortality response to food prices for Western Europe and a strong household gradient for Eastern Asia (Bengtsson, et al. 2004). In both cases the response becomes less pronounced by the end of the nineteenth century, indication that the share of population living close to the margins diminished (Bengtsson and Dribe 2005; Lee and Campbell 2005). In this study, a strong sectoral gradient was observed, indicating low living standards well into the twentieth century among non-agricultural workers. The observed relationships between food price variations and demographic responses were found in data from a study period that begins later than comparable studies of other European populations. Typically, these associations were weaker or absent from the mid-nineteenth century on. Yet, North Orkney seemed to lag behind these European neighbours in terms of mortality response to changes in food prices, as associations were present in the mid-nineteenth and early twentieth century. In addition, fertility responses to unfavourable conditions were not the result of planning, but rather took longer to develop, a sign that people in Orkney could not adjust their fertility quickly to short-term economic stress. Work in other regions of rural Scotland, such as the Highlands or Western Isles, may offer some insight into this finding. Was low standard of living, measured by demographic responses to short-term economic stress, common throughout these regions of Scotland, or is Orkney an outlier in this respect too? For now, we can suggest that the isolated geography and reliance on an agricultural economy in a harsh climate pushed some inhabitants of North Orkney, especially those without access to land, to a marginal standard of living.
Acknowledgments
Julia Jennings is grateful for the facilities provided by the Centre for Economic Demography, Lund University to carry out the research for this study and for research funding provided by the California Institute of Technology. Luciana Quaranta is thankful for funding provided by the Centre for Economic Demography, Lund University and by the Jan Wallander and Tom Hedelius Foundation. We are grateful to Daniel Parker and James Wood for their comments and assistance with data. We thank the participants and discussants at paper sessions of the 2014 European Society of Historical Demography meetings and 2014 Social Science History meetings, including Cameron Campbell, Kris Inwood, and Christer Lundh as well as Volha Lazuka, Jonas Helgertz, and three anonymous reviewers for their helpful comments.
References
- Allen Robert C, Bengtsson Tommy, Dribe Martin., editors. Living Standards In The Past. Oxford: Oxford University Press; 2005a. [Google Scholar]
- Allen Robert C, Bengtsson Tommy, Dribe Martin. Introduction. In: Allen Robert C, Bengtsson Tommy, Dribe Martin., editors. Living Standards In The Past. Oxford: Oxford University Press; 2005b. pp. 1–22. [Google Scholar]
- Anderson Michael. Population growth and population regulation in nineteenth-century rural Scotland. In: Bengtsson Tommy, Saito Osamu., editors. Population and Economy: From Hunger to Modern Economic Growth. Oxford: Oxford University Press; 2000. pp. 111–131. [Google Scholar]
- Barclay Robert S. The Population of Orkney, 1755–1961. Kirkwall: The Kirkwall Press; 1965. [Google Scholar]
- Bengtsson Tommy. Living standards and economic stress. In: Bengtsson Tommy, Campbell Cameron, Lee James Z., editors. Life Under Pressure: Mortality and Living Standards in Europe and Asia, 1700–1900. Cambridge: MIT Press; 2004a. pp. 27–59. [Google Scholar]
- Bengtsson Tommy. Mortality and social class in four Scanian parishes, 1766–1865. In: Bengtsson Tommy, Campbell Cameron, Lee James Z., editors. Life Under Pressure: Mortality and Living Standards in Europe and Asia, 1700–1900. Cambridge: MIT Press; 2004b. pp. 135–171. [Google Scholar]
- Bengtsson Tommy, Dribe Martin. New evidence on the standard of living in Sweden during the eighteenth and nineteenth centuries: Long-term development of the demographic response to short-term economic stress. In: Allen Robert C, Bengtsson Tommy, Dribe Martin., editors. Living Standards in the Past: New Perspectives on Well-being in Asia and Europe. Oxford: Oxford University Press; 2005. pp. 341–372. [Google Scholar]
- Bengtsson Tommy, Martin Dribe. Deliberate control in a natural fertility population: Southern Sweden, 1766–1864. Demography. 2006;43(4):727–746. doi: 10.1353/dem.2006.0030. [DOI] [PubMed] [Google Scholar]
- Bengtsson Tommy, Dribe Martin. Economic stress and reproductive responses. In: Tsuya Noriko O, Feng Wang, Alter George, Lee James Z., editors. Prudence and Pressure: Reproduction and Human Agency in Europe and Asia, 1700–1900. Cambridge: MIT Press Books; 2010. pp. 97–127. [Google Scholar]
- Bengtsson Tommy, Campbell Cameron, Lee James Z., editors. Life Under Pressure: Mortality and Living Standards in Europe and Asia, 1700–1900. Cambridge: MIT Press; 2004. [Google Scholar]
- Bengtsson Tommy, Rolf Ohlsson. Age-specific mortality and short-term economic changes in the standard of living: Sweden, 1751–1859. European Journal of Population. 2005;1:309–326. doi: 10.1007/BF01797146. [DOI] [PubMed] [Google Scholar]
- Breslow N. Covariance analysis of censored survival data. Biometrics. 1974;30(1):89–99. [PubMed] [Google Scholar]
- Coull James R. Communications and trade in Scottish farming from the medieval period to 1900. In: Fenton A, Veitch K, editors. Scottish Life and Society: Volume 2, Farming and the Land. Edinburgh: John Donald; 2011. pp. 849–864. [Google Scholar]
- Cox DR. Regression models and life tables (with discussion) Journal of the Royal Statistical Society B. 1972;34(2):187–220. [Google Scholar]
- Crowther M Anne. Poverty, health, and welfare. In: Hamish Fraser W, Morris RJ, editors. People and Society in Scotland, Volume II: 1830–1914. Edinburgh: John Donald; 1990. pp. 265–289. [Google Scholar]
- Fenton Alexander. Scottish Country Life. Edinburgh: John Donald; 1976. [Google Scholar]
- Fenton Alexander. The Northern Isles: Orkney and Shetland. East Linton: Tuckwell Press; 1997. [Google Scholar]
- Field Catherine J. The immunological components of human milk and their effect on immune development in infants. The Journal of Nutrition. 2005;135:1–4. doi: 10.1093/jn/135.1.1. [DOI] [PubMed] [Google Scholar]
- Flinn Michael W, Gillespie J, Hill N, Maxwell A, Mitchison R, Smout C. Scottish Population History: From the 17th Century to the 1930s. Cambridge: Cambridge University Press; 1977. [Google Scholar]
- Floud Roderick, Fogel Robert W, Harris Bernard, Chul Hong Sok. The Changing Body: Health, Nutrition, and Human Development in the Western World since 1700. Cambridge: Cambridge University Press; 2011. [DOI] [PMC free article] [PubMed] [Google Scholar]
- Gibson AJS, Smout TC. Prices, Food and Wages in Scotland, 1550–1780. Cambridge: Cambridge University Press; 2007. [Google Scholar]
- Gibson AJS, Smout TC. Scottish Economic History Database. n.d. Retrieved from http://www.iisg.nl/hpw/scotland/
- Goldstein Ellie JC, Katona Peter, Katona-Apte Judit. The interaction between nutrition and infection. Clinical Infectious Diseases. 2008;46(10):1582–1588. doi: 10.1086/587658. [DOI] [PubMed] [Google Scholar]
- Gutmann Myron, Alter George. Family reconstitution as event history analysis. In: Reher David, Schofield Roger., editors. Old and New Methods in Historical Demography. Oxford: Clarendon Press; 1993. pp. 159–177. [Google Scholar]
- Henry Louis, Blum A. Techniques d’analyse en démographie historique. Paris: INED; 1988. [Google Scholar]
- Hodrick Robert J, Prescott Edward C. Postwar U.S. business cycles: An empirical investigation. Journal of Money, Credit and Banking. 1997;29(1):1–16. [Google Scholar]
- Irvine James M. The Breckness Estate: A History of its Lairds, Tenants and Farms, and Skaill House. Kirkwall, Orkney: The Orcadian Limited; 2009. [Google Scholar]
- Jennings Julia A. PhD Dissertation. The Pennsylvania State University; 2010. Household structure, dynamics, and economics in a preindustrial farming population: The Northern Orkney Islands, Scotland, 1851–1901. (Anthropology and Demography). [Google Scholar]
- Jennings Julia A, Parker Daniel M, Wood James W. The influence of environmental and household factors on mortality in North Orkney, 1851–1961. Poster resented at the annual meeting of the Population Association of America; San Francisco. 2012. [Google Scholar]
- Lee James Z, Bengtsson Tommy, Campbell Cameron. Family and community standards. In: Bengtsson Tommy, Campbell Cameron, Lee James Z., editors. Life Under Pressure: Mortality and Living Standards in Europe and Asia, 1700–1900. Cambridge: MIT Press; 2004. pp. 85–106. [Google Scholar]
- Lee James Z, Campbell Cameron. Living standards in Liaoning, 1789–1904: Evidence from demographic outcomes. In: Allen Robert C, Bengtsson Tommy, Dribe Martin., editors. Living Standards in the Past: New Perspectives on Well-being in Asia and Europe. Oxford: Oxford University Press; 2005. pp. 403–426. [Google Scholar]
- Lee Ronald D. Short–term variation: Vital rates, prices and weather. In: Wrigley EA, Schofield RS, editors. The Population History of England 1541–1871: A Reconstruction. London: Edward Arnold; 1981. pp. 356–401. [Google Scholar]
- Lee Ronald D. The demographic response to economic crisis in historical and contemporary populations. Population Bulletin of the United Nations. 1990;29:1–15. [PubMed] [Google Scholar]
- Levitt Ian, Smout TC. The State of the Scottish Working Class in 1843: A Statistical and Spatial Enquiry Based on Data from the Poor Law Commission Report of 1844. Edinburgh: Scottish Academic Press; 1979. [Google Scholar]
- Lindert Peter H. Three centuries of inequality in Britain and America. In: Atkinson AB, Bourguignon F, editors. Handbook of Income Distribution. Vol. 1. Amsterdam: Elsevier Science; 2000. pp. 167–216. [Google Scholar]
- Livi-Bacci Massimo. Population and Nutrition. Cambridge: Cambridge University Press; 1991. [Google Scholar]
- Lundh Christer, Kurosu Satomi., editors. Similarity in Difference: Marriage in Europe and Asia, 1700–1900. Cambridge, Mass: MIT Press; 2014. [Google Scholar]
- Mitchison Rosalind. The movements of Scottish corn prices in the seventeenth and eighteenth centuries. The Economic History Review. 1965;18(2):278–291. [Google Scholar]
- Mitchison Rosalind. The making of the old Scottish poor law. Past and Present. 1974;63:58–93. [Google Scholar]
- Mitchison Rosalind. Poor relief and health care in 19th century Scotland. In: Grell Ole Peter, Cunningham Andrew, Jutte Robert., editors. Health Care and Poor Relief in 18th and 19th Century Northern Europe. London: Aldershot, UK: 2002. pp. 246–255. [Google Scholar]
- Oeppen James, Vaupel James W. Broken limits to life expectancy. Science. 2002;296(5570):1029–1031. doi: 10.1126/science.1069675. [DOI] [PubMed] [Google Scholar]
- Oris Michel, Derosas Renzo, Breschi Marco, Alter George, Bengtsson Tommy, Campbell Cameron, Kurosu Satomi, Manfredini Matteo. Infant and child mortality. In: Bengtsson Tommy, Campbell Cameron, Lee James Z., editors. Life Under Pressure: Mortality and Living Standards in Europe and Asia, 1700–1900. Cambridge: MIT Press; 2004. pp. 359–398. [Google Scholar]
- Paterson Audrey. The Poor Law in nineteenth century Scotland. In: Fraser Derek., editor. The New Poor Law in the Nineteenth Century. London: Macmillan; 1976. pp. 171–193. [Google Scholar]
- Quaranta Luciana. Scarred for life How conditions in early life affect socioeconomic status, reproduction and mortality in southern Sweden, 1813–1968. Lund: Media-Tryck, Lund University; 2013. [Google Scholar]
- Quaranta Luciana. Early life effects across the life course: The impact of individually defined exogenous measures of disease exposure on mortality by sex in 19th- and 20th-century southern Sweden. Social Science & Medicine. 2014;119:266–273. doi: 10.1016/j.socscimed.2014.04.007. [DOI] [PubMed] [Google Scholar]
- Ravn Moren O, Uhlig Harald. On adjusting the Hodrick-Prescott filter for the frequency of observations. The Review of Economics and Statistics. 2002;84(2):371–376. [Google Scholar]
- Rodríguez Leonor, Cervantes Elsa, Ortiz Rocío. Malnutrition and gastrointestinal and respiratory infections in children: A public health problem. International Journal of Environmental Research and Public Health. 2011;8(12):1174–1205. doi: 10.3390/ijerph8041174. [DOI] [PMC free article] [PubMed] [Google Scholar]
- Rotberg Robert I, Rabb Theodore K. Hunger and History. Cambridge: Cambridge University Press; 1983. [Google Scholar]
- Schaible Ulrich E, Kaufmann Stefan HE. Malnutrition and infection: Complex mechanisms and global impacts. PLoS Medicine. 2007;4(5):806–812. doi: 10.1371/journal.pmed.0040115. [DOI] [PMC free article] [PubMed] [Google Scholar]
- Schrank Gilbert. An Orkney Estate: Improvements at Graemeshall, 1827–1888. East Linton: Tuckwell Press; 1995. [Google Scholar]
- Smout TC. A Century of the Scottish People, 1830–1950. London: Harper Collins; 1986. [Google Scholar]
- Sparks Corey S. PhD Dissertation. The Pennsylvania State University; 2007. Households, Land, and Labor: Population Dynamics in the Northern Orkney Islands, Scotland, 1851 to 2003. (Anthropology and Demography). [Google Scholar]
- Sparks Corey S. An application of the variable-r method to subpopulation growth in a 19th century agricultural population. Demographic Research. 2009;21:23–64. [Google Scholar]
- Sparks Corey S, Wood James W, Johnson Patricia L. Infant mortality and intra-household competition in the Northern Islands of Orkney, Scotland, 1855–2001. American Journal of Physical Anthropology. 2013;151(2):191–201. doi: 10.1002/ajpa.22264. [DOI] [PubMed] [Google Scholar]
- StataCorp. Stata Statistical Software: Release 14. College Station, TX: StataCorp LP.; 2015. [Google Scholar]
- Thomson William PL. Population and Depopulation. In: Wirthington Donald J., editor. Shetland and the Outside World, 1469–1969. Oxford: Oxford University Press for the University of Aberdeen; 1983. pp. 150–180. [Google Scholar]
- Thomson William PL. Kelp-making in Orkney. Stromness: The Orkney Press; 1983. [Google Scholar]
- Thomson William PL. History of Orkney. Edinburgh: Mercat Press; 1987. [Google Scholar]
- Thomson William PL. The Little General and the Rousay Crofters. Edinburgh: John Donald Publishers; 2000. [Google Scholar]
- Thomson William PL. The New History of Orkney. 3rd. Edinburgh: Birlinn Ltd.; 2008a. [Google Scholar]
- Thomson William PL. Orkney Land and People. Kirkwall: The Orcadian Limited (Kirkwall Press); 2008b. [Google Scholar]
- Tsuya Noriko O, Feng Wang, Alter George, Lee James Z., editors. Prudence and Pressure: Reproduction and Human Agency in Europe and Asia, 1700–1900. Cambridge: MIT Press Books; 2010. [Google Scholar]