

Summary
Capturing the functionally relevant forms of dynamic, multidomain proteins is extremely challenging. BTK, a kinase essential for B and mast cell function, has stubbornly resisted crystallization in its full-length form. Here, NMR and HDX-MS show that BTK adopts a closed conformation in dynamic equilibrium with open, active conformations. BTK lacks the phosphotyrosine regulatory tail of the SRC kinases, yet nevertheless achieves a phosphotyrosine-independent C-terminal latch. The unique proline-rich region is an internal ‘on’ switch pushing the autoinhibited kinase toward its active state. Newly identified autoinhibitory contacts in the BTK PH domain are sensitive to phospholipid binding, which induces large scale allosteric changes. The multiplicity of these regulatory contacts suggests a clear mechanism for gradual or ‘analog’ kinase activation as opposed to a binary ‘on/off’ switch. The findings illustrate how previously modeled information for recalcitrant full-length proteins can be expanded and validated with a convergent multidisciplinary experimental approach.
Keywords: BTK, TEC, kinase regulation, autoinhibition, crystallization-resistant proteins, conformational equilibria
eTOC Blurb
Immune cell activation must be properly tuned to the magnitude of external pathogen mediated signals. Joseph et al. demonstrate the molecular underpinnings for achieving a graded response in a family of kinases exclusively expressed in cells of the immune system.

Introduction
Kinase mediated transfer of the ATP γ-phosphate to a substrate hydroxyl is a central step in signal transduction that demands precise regulatory inputs. Structures derived from X-ray crystallography and Nuclear Magnetic Resonance (NMR) spectroscopy have been instrumental in revealing molecular details of the kinase regulatory apparatus (Huse and Kuriyan, 2002; Steichen et al., 2012). Among the tyrosine kinases that share a SRC homology 3 (SH3), SRC homology 2 (SH2), and kinase domain, full-length (FL) structures for members of the SRC family, ABL and CSK are available (Nagar et al., 2003; Ogawa et al., 2002; Sicheri et al., 1997; Xu et al., 1997). Structures of the FL TEC kinases have proven elusive perhaps due to their extended domain structure that contains a Pleckstrin homology (PH) domain, a Tec homology (TH) domain and a proline rich region (PRR) at the N-terminus of the conserved SH3, SH2, kinase domain cassette (Fig. 1a).
Fig. 1. BTK is a multi-domain protein.

(a) BTK domains and fragments used in this study. The proline rich region (PRR) is shown as a dotted line. (b) Model of autoinhibited FL BTK (Wang et al., 2015).
The TEC kinases constitute the second largest family of mammalian non-receptor tyrosine kinases, with Bruton’s tyrosine kinase (BTK) and IL-2 inducible T-cell kinase (ITK) being the most well studied (Andreotti et al., 2010; Rawlings and Witte, 1995). BTK is expressed in cells of hematopoietic origin and is essential for the development of B cells (Mohamed et al., 2009). Mutations in Btk cause X-linked agammaglobulinemia, a condition that results in high susceptibility to bacterial infections due to low antibody levels stemming from impaired B cell development (Vihinen et al., 1997). Normal B cell receptor engagement leads to activation of a trio of kinases, LYN, SYK and BTK, leading to BTK mediated phosphorylation of the phospholipase, PLCγ2, which cleaves phosphatidylinositol (4,5)-bisphosphate (PIP2) to produce diacylglycerol and inositol 1,4,5-trisphosphpate (IP3) (Kurosaki, 2011). These second messengers mediate subsequent signaling events that culminate in changes in gene expression and a regulated immune response. Both BTK and ITK are of interest as targets for inhibitor development in the context of B cell malignancies and inflammatory conditions (Smith, 2017). To advance our ability to successfully target these kinases, a better understanding of their structures and conformational preferences at different stages of activation is needed.
In addition to numerous single domain structures from various TEC kinases, two multidomain crystal structures of BTK were recently published (Wang et al., 2015). The crystal structure of the BTK SH3-SH2-kinase shows that the domain arrangement is similar to that previously observed in the autoinhibited structures of SRC and ABL (Nagar et al., 2003; Sicheri et al., 1997; Xu et al., 1997). The BTK SH3 domain binds to the SH2-kinase linker and the SH3− SH2 segment rests on the ‘back’ surface of the BTK kinase domain (Fig. 1b). Crystallization of another multi-domain fragment capitalized on a tethered construct linking the BTK PHTH domain directly to the kinase domain. This structure lacks the PRR, SH3 and SH2 but reveals a contact between the helix-2 loop region of BTK PHTH and the C-helix in the N-lobe of the kinase domain. Since these structures both contain the kinase domain, the coordinates were merged and subjected to MD simulation to create a model for FL autoinhibited BTK (Fig. 1b) (Wang et al., 2015). The authors of that work emphasize that the FL BTK model is not a high-resolution structure, therefore the details regarding the inter-domain contacts, especially that of the PHTH domain, remain in question. Nevertheless, this model provides a much needed first glimpse of a FL TEC kinase and is invaluable for interpretation of the solution work presented here.
We used solution NMR and Hydrogen-Deuterium exchange mass-spectrometry (HDX-MS) to probe the interdomain contacts within FL BTK. Solution based approaches have allowed us to directly study the FL BTK protein rather than incomplete fragments. The unphosphorylated enzyme is in a dynamic equilibrium between multiple conformational states with the predominant species in solution conforming to the autoinhibited state in the crystal structure. We show that the BTK PRR competes with the SH3/SH2-kinase linker interaction pushing the kinase toward its active state. Additionally, we describe a previously unidentified interaction between the conserved phosphotyrosine binding pocket of the SH2 domain and the C-terminus of BTK. This autoinhibitory interaction functionally mimics the phosphotyrosine tail of the SRC kinases (Huse and Kuriyan, 2002). We identify the PHTH β3β4 loop region as a new inhibitory surface on the BTK PHTH domain that is distinct from the BTK PHTH helix-2 loop region identified in the tethered BTK fragment. The data show that the BTK conformational equilibrium is maintained by a delicate balance between the down-regulatory interactions mediated by the PHTH domain, the SH3/SH2-kinase linker interaction and the SH2/C-terminal interaction versus the activating interaction mediated by the BTK PRR.
Results
The crystal structure of BTK SH3-SH2-kinase (also termed SH3-SH2-Linker-Kinase Domain; 3-2-L-KD) and the model of autoinhibited FL BTK (Wang et al., 2015) (Fig. 1b) provide insight into the mechanisms underlying BTK regulation. This long awaited structure, coming nearly twenty years after the first structures of the related SRC SH3-SH2-kinase structures (Sicheri et al., 1997; Xu et al., 1997), allows the first glimpse of any multi-domain TEC kinase. However, significantly more information is needed to fully characterize FL BTK and questions linger about the role of the PHTH domain and PRR, the regions that set the Tec family apart from SRC, ABL and CSK. What are the conformational state(s) of FL BTK in solution and what are the stabilizing intramolecular contacts? Is the inhibitory contact between the PHTH domain and the kinase domain observed in the crystal structure of the tethered construct present in FL BTK? How do the PRR and activating ligands modulate the intramolecular contacts within FL BTK? To address these issues, we set out to probe the conformational preferences of FL BTK.
NMR and HDX-MS data for FL BTK are consistent with the autoinhibited crystal structure of BTK SH3-SH2-kinase
To determine the extent to which the solution conformation of FL BTK resembles that of autoinhibited BTK based on x-ray crystallography (Fig. 1b), BTK was uniformly labelled with 15N-NH4Cl and purified from bacteria. The 1H-15N TROSY-HSQC spectrum of FL BTK (Fig. S1) is crowded, as expected for a 76kDa protein, making complete backbone resonance assignments challenging. Nevertheless, direct comparisons between the assigned 1H-15N HSQC spectra of the isolated SH3 and SH2 domains (Hansson et al., 1998; Huang et al., 2006), and spectra of larger constructs including FL BTK, show chemical shift changes consistent with the autoinhibited BTK structure (Fig. 2a,b). Comparing spectra of isolated SH3 and SH2 domains to SH3-SH2, we find that chemical shift differences in SH3 resonances are localized to the side of the domain adjacent to the SH2 domain in SH3-SH2 and SH2 resonances show limited changes (Fig. 2a,c(i)). More extensive changes are observed in comparing isolated SH3 and SH2 domain resonances to those of FL BTK (Fig. 2b,c(ii)). SH3 spectral changes can be attributed to overall stabilization of the relatively small domain whereas SH2 domain changes are localized to the regions that contact the kinase domain in the SH3-SH2-kinase crystal structure (Fig. 1b). Focusing on the resonances of key binding site residues in SH3 and SH2, W251 and R307, respectively, we note complete lack of overlap between the assigned resonances of the single domains and resonances of FL BTK consistent with the fact that these binding pocket residues are buried in autoinhibited BTK (Fig. 2b,c(ii)).
Fig. 2. NMR and HDX are consistent with compact autoinhibited BTK SH3-SH2-kinase.

(a) Chemical shift changes between the isolated SH3, SH2 and SH3-SH2. Red indicates chemical shift change and blue no change in resonance frequency. Gray shows ambiguity in assignment. Cartoon above the structure indicates the BTK construct studied; the red dashed box indicates the domain/s being monitored, here and in subsequent figures. W251 in SH3 and R307 in the pY pocket of SH2 are labeled. (b) Chemical shift changes in the isolated SH3 and SH2 domains in the context of FL BTK. Colors same as (a). PHTH and kinase domains are surface rendered. (c) Superpositions of 1H-15N TROSY-HSQC spectra of SH3 (green) and SH2 (blue) with (i) SH3–SH2 (black) and (ii) FL BTK (black). W251 and R307 resonances are boxed. (d) HDX changes in SH3-SH2 in the context of FL BTK (DFL − DSH3-SH2, D = Relative deuterium incorporation, here and all subsequent figures). Regions of protection are shown in purple, and exposure in green, here and all subsequent figures. (e) HDX difference data in (d) mapped onto autoinhibited FL BTK. Here and in all subsequent figures differences between 0.5 Da to 1.0 Da are shown as light blue (modest decrease) or light pink (modest increase), while differences greater than 1.0 Da are shown as dark blue (meaningful decrease) or red (meaningful increase). No change is gray and absence of data is pale peach. SH3-SH2 is shown in ribbons and PHTH and kinase domains are surface rendered. (e) HDX changes in (i) D3-2-L-KD − DL-KD and (ii) D2-L-KD − DL-KD. (i) Mapping changes from (h(i)) onto the structure of the BTK 3-2-L-KD. The L-KD is shown in ribbons and the SH3 and SH2 domains are shown as surfaces for context. See also Fig. S1 and Data S1.
To further interrogate the conformational status of FL BTK we turned to HDX-MS. Comparing the HDX behavior of the SH3-SH2 with that of FL BTK shows reduced exchange throughout BTK SH3 suggesting an overall stabilization of the SH3 domain in the full-length protein (Fig. 2d,e). There is a more limited effect in SH2; the HDX data indicate reduced exchange in the SH2 A-helix, BC loop (bearing R307) and beta strands B, C and D consistent with the orientation of the SH2 domain in the FL model (Fig. 2d,e). With continued focus on 3-2-L-KD, we observe less exchange in the N-lobe of the kinase in 3-2-L-KD fragment compared to Linker-Kinase Domain (L-KD) fragment, specifically within strands β2 and β3, in the C helix and in the N-terminal part of the activation segment (Fig. 2f(i),g). The changes in β2 and β3 are consistent with the SH3 domain contacting the N-lobe of the kinase domain in the autoinhibited model and the exchange differences observed in the C-helix and activation segment correlate with stabilization of the inactive kinase. This is further corroborated by the observation that no differences in deuterium uptake are observed between L-KD fragment and SH2-Linker-Kinase Domain (2-L-KD) fragment that lacks the SH3 domain (Fig. 2f(ii)). Taken together, NMR and HDX suggest that the predominant form of FL BTK in solution is consistent with the crystal structure of BTK 3-2-L-KD.
The data also provide support for the predominance of a monomeric FL BTK species in solution. While select NMR resonances are broadened in the spectrum of FL BTK, a large number of resolved resonances in the 1H-15N TROSY-HSQC spectrum of FL BTK exhibit linewidths that are similar to those measured for the smaller BTK fragments arguing against stable dimerization or oligomerization in the NMR tube (Fig. 2d, Fig. S1) (Cavanagh et. al., 2006). Thus, as predicted by the authors of the BTK 3-2-L-KD structure, the autoinhibited conformation is likely captured within a single polypeptide chain rather than a domain swapped dimer (Wang et al., 2015). As for specific inter-domain contacts within the autoinhibited structure, engagement of W251 in the SH3 domain with the SH2-linker region in BTK has been previously characterized but precise interactions involving the conserved BTK SH2 binding pocket have not been explored previously. To further probe the involvement of the SH2 domain in stabilizing autoinhibited BTK and to better understand the role of the N-terminal regulatory regions in stabilizing the autoinhibited structure, we turned our focus to expanding our use of NMR spectroscopy to assess the conformational equilibrium of FL BTK.
The crowded 1H-15N TROSY-HSQC spectrum of FL BTK (Fig. S1) precludes conventional backbone resonance assignments and, while selective labeling techniques such as 13C-methyl labeling can provide specific probes throughout a large protein for dynamical studies, we were interested in two specific side chains that might serve as direct reporters of BTK conformation and hence activation status. Tryptophan indole NH resonances are well resolved in spectra of uniformly 15N-labeled protein and in the model of autoinhibited FL BTK, W251 in the SH3 domain and W395 in the SH2-kinase linker are appropriately positioned to ‘feel’ the conformational shift between the closed, autoinhibited BTK conformation (Fig. 1b) and what is likely a more open conformation of activated BTK (Marquez et al., 2003). Both W251 and W395 are located at the junction where four of the five regions of FL BTK (PHTH, SH3, SH2-kinase linker, and kinase domain) come together in the autoinhibited model (Fig. 3a,b.1,b.2, 4a). Given the appearance of tryptophan side chain resonances in the 1H-15N TROSY-HSQC spectrum of FL BTK (Fig. S1), we set out to assign this region and determine whether W251 and/or W395 might serve as useful probes to assess the conformational preferences of FL BTK.
Fig. 3. Interdomain contacts in FL BTK.
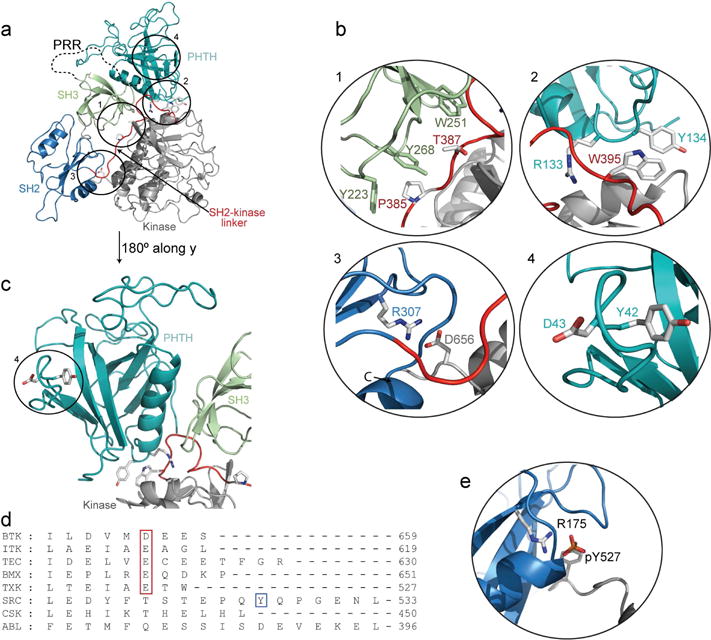
(a) Model of autoinhibited FL BTK with PHTH (teal), PRR (dotted line) SH3 (green), SH2 (blue), SH2-kinase linker (red) and kinase domain (grey). (b) Interdomain contacts (circled and numbered in the FL model): (1) SH2-kinase linker (red) is sandwiched between the SH3 (green) and kinase domain (grey). Y223, Y268 and W251 in SH3 and P385 and T387 in SH2-kinase linker are shown. (2) In the model of FL BTK, R133 and Y134 in the PHTH domain are adjacent to W395 and the C-helix (grey) of the BTK kinase domain. (3) R307 forms a salt bridge with D656 from the kinase domain C-terminus. (4) Y42 and D43 in the BTK PHTH domain (teal) are not close in space to the kinase domain in the model of FL BTK (Wang et al., 2015). (c) Alternate view of the BTK PHTH domain in the autoinhibited structure. (d) Sequence alignment of the C-terminus of the TEC family, SRC, CSK and ABL kinase domains. Acidic nature of BTK D656 is conserved in TEC kinases (boxed, red). The C-terminal conserved tyrosine in SRC kinase is boxed (blue). (e) Structure of the autoinhibited SRC kinase (PDB: 1FMK) showing the C-terminal pY527 interaction with the conserved R175 in the SH2 binding pocket. C-terminal tail is gray and SH2 domain is blue.
Fig. 4. Characterization of FL BTK mutants.

(a) Location of W251 and W395 (sticks, orange) in autoinhibited BTK. BTK PHTH (teal), SH3 (green), SH2-kinase linker (red) and kinase domain (grey). (b) 1H-15N TROSY-HSQC spectra showing W395 resonance in wild type (WT) FL BTK (i), with added peptide ligands for SH3 (ii) and SH2 (iii). The two dashed lines indicate the positions of W395 resonance in WT FL BTK; the upfield W395 peak corresponds to the autoinhibited, inactive conformation and the downfield peak corresponding to the open, active conformation of BTK, here and in all subsequent figures. (c) 1H-15N TROSY-HSQC spectra showing W395 resonance for FL BTK mutants: (i) P385A/T387A, (ii) D656K and (iii) PRR(A) (proline rich region mutant: P189A/P192A/P203A/P204A). (d & e) Western blot showing the kinase activity of 6XHis-FL BTK WT and mutants: BTK P385A/T387A, BTK D656K and BTK PRR(A). Here and in subsequent figures autophosphorylation on BTK is monitored using an Anti-pY antibody and total protein levels are monitored with an Anti-6XHis antibody. (e) Histogram showing the BTK activity data in (d). Phosphorylation levels in the Anti-pY blot were quantified and divided by the total protein level (Anti-His blot). Activity of the FL WT BTK = 1, and the relative activity of BTK mutants is shown. Data is the average of three independent experiments. (f) 1H-15N TROSY-HSQC spectra showing that the PRR occupies BTK SH3 in the PHTH-PRR-SH3 fragment. Superposition of the region 1H-15N TROSY-HSQC spectra containing the W251 resonance for: (i) BTK PHTH-PRR-SH3 (red) and BTK SH3 (black), and (ii) BTK PHTH-PRR-SH3 (red) and the PRR mutant BTK PHTH-PRR(A)-SH3 (cyan). See also Fig. S2, S3 and S4.
Resonance assignments for the tryptophan region of FL BTK are described in STAR Methods and Supplemental Information (Fig. S2–S4). The assignment procedure resulted in identification of the W395 resonance in the 1H-15N TROSY-HSQC spectrum of FL BTK and the determination that the W251 resonance is broadened beyond detection in FL BTK. Moreover, making use of BTK fragments and a well characterized SH3 domain mutation (Erpel et al., 1995; Park et al., 1996) we determined that the W395 resonance shifts between an upfield peak that corresponds to the closed, autoinhibited conformation of BTK where the SH2-kinase linker is engaged by the BTK SH3 domain binding pocket and a weaker downfield BTK W395 resonance that corresponds to the open, active conformation of the kinase where the BTK SH2-kinase linker region has been released from the SH3 binding pocket (Fig. 4b(i), Fig. S4). The predominance of the upfield W395 resonance and the presence of minor peaks spanning the upfield and downfield resonances of W395 in the spectrum of FL BTK (Fig. 4b(i)) suggest that unphosphorylated BTK accesses a range of conformational states in solution with the autoinhibited, closed conformation being the most populated. Taking advantage of the distinct chemical shifts for the W395 side chain resonance and the correspondence to the open/active and closed/inactive forms of FL BTK, we next introduced targeted mutations and peptide ligands and assessed the effect of each on NMR spectral signature, kinase activity, and HDX.
The SH3 domain/SH2-kinase linker interface
Disruption of the BTK SH2-kinase linker interaction with the SH3 domain has been previously shown to activate BTK by releasing the SH3 domain from its autoinhibited conformation (Wang et al., 2015). Following that example we mutated two linker residues, P385 and T387 to alanine in FL BTK (Figs. 3b.1, 4c(i)). The tryptophan side chain region of the 1H− 15N TROSY-HSQC spectrum of FL BTK P385A/T387A shows a complete shift in the W395 resonance to the downfield position and disappearance of the upfield W395 peak (Fig. 4c(i)), consistent with the release of the SH2-kinase linker from the BTK SH3 domain, and disruption of the autoinhibited conformation. To further confirm that the SH3 domain is required for maintaining the autoinhibited conformation, we added a proline-rich peptide to the FL BTK protein and monitored the W395 resonance. Comparing the 1H-15N TROSY-HSQC spectrum of FL BTK with that of BTK plus proline-rich peptide reveals a shift in the W395 resonance toward the more downfield chemical shift value consistent with opening the autoinhibited conformation (Fig. 4b(ii)). The partial shift of the W395 resonance upon addition of peptide ligand for the SH3 domain is in contrast to the complete shift observed in the FL BTK double mutant consistent with the notion that mutation of P385 and T387 completely abolishes the SH3/SH2-kinase linker interaction while peptide addition only partially competes with this interaction in the closed autoinhibited form. The NMR result is corroborated by an increase in autophosphorylation of FL BTK P385A/T387A compared to wild type (WT) BTK (Fig. 4d,e). It is important to note that the BTK proteins are co-expressed in bacteria with a phosphatase, and so the initial phosphorylation levels (prior to incubation with ATP) are undetectable in WT and mutant BTK proteins (data not shown) making autophosphorylation an effective readout for BTK activity.
To continue to probe the effect of the P385A/T387A mutation on FL BTK, we subjected the mutant and WT kinase to HDX-MS analysis. Compared to WT, FL BTK P385A/T387A shows increased deuterium uptake in the BTK SH3 domain, SH2 domain, and the kinase domain β2–β3 loop that contacts the SH2-kinase linker (Fig. 5a,d). The regions of increased deuterium uptake are consistent with mutation induced disruption of the closed autoinhibited conformation. Interestingly, increased exposure as evidenced by increased HDX is also observed in regions remote from the site of mutation; the SH2 domain shows increased deuterium uptake in the region that abuts the C-lobe of the kinase domain in the autoinhibited structure (the A-helix, β strands B, C and D, and the BC loop, Fig. 5d.1). The sites of increased deuterium uptake correspond to the same regions of reduced HDX observed in the SH2 domain in the FL BTK compared to SH3-SH2 (Fig. 2d,e). As well, key regions in the N-lobe of the kinase domain, the activation segment, DFG motif, β2 strand, β2–β3 loop, β3 strand and to a lesser extent the C-helix exhibit increased exposure to exchange in the mutant FL BTK (Fig. 5a,d). The PHTH region is less affected but shows evidence for increased exchange in the β3–β4 loop region (Fig. 5a,d). Together, these results show that disruption of the interaction between SH2-kinase linker and the SH3 domain in FL BTK opens and activates the kinase. These data provide a framework to next explore regulatory contacts within BTK that have not been as well characterized as the SH3/SH2-kinase linker interaction.
Fig. 5. HDX of mutants and WT FL BTK.

HDX data for FL BTK mutants: (a) DP385A/T387A FL − DWT FL, (b) DD656K FL − DWT FL and (c) DPRR(A) FL − DWT FL. (d) Mapping HDX results from (a) onto the autoinhibited BTK model. Asterisks indicate the position of mutations within FL BTK. Details of the changes that occur in (1) BTK FL P385A/T387A at the BTK SH2 domain/C-terminal kinase tail, (2) in the BTK FL D656K mutant within the BTK kinase domain N-lobe and (3) the BTK PHTH domain. See also Data S1.
The SH2 domain/kinase C-terminal tail interface
The SH2 domain of the SRC family kinases engages with the pY tail region at the C-terminus (Fig. 2e) (Xu et al., 1997). It has been assumed that the TEC kinases lack a similar SH2 domain ‘latch’ since the conserved tyrosine in the kinase tail of SRC is absent in BTK and related family members (Fig. 3d). However, NMR and HDX data (Fig. 2b,c(ii),d,e) suggest that the BTK SH2 binding pocket (R307) does mediate contacts in the autoinhibited BTK structure. A closer look at the autoinhibited BTK structure shows that D656, located at the C-terminal end of the BTK kinase domain, forms a salt bridge interaction with R307 (Fig. 3a,b.3). This acidic residue is conserved among the TEC kinases but not the SRC family, CSK or ABL (Fig. 3d).
To test the regulatory role of D656, we mutated this residue in FL BTK to lysine and measured activity and the conformational status of the FL protein. Mutation of D656 activates BTK to the same extent as the P385A/T387A mutation in the SH2-kinase linker region (Fig. 4d,e). Like the BTK P385A/T387A mutant, the 1H-15N TROSY-HSQC spectrum of FL BTK D656K shows an increase in the intensity of the downfield W395 peak while the upfield W395 peak is significantly diminished compared to WT BTK (Fig. 4c(ii)). To further confirm the presence of a BTK C-terminal latch, we tested whether the addition of an SH2 peptide ligand would disrupt the autoinhibited conformation. As shown in Fig. 4b(iii), addition of a phosphotyrosine containing peptide to FL BTK leads to a shift in the W395 resonance toward the more downfield chemical shift value consistent with opening the autoinhibited conformation. It is notable that, unlike the P385A/T387A mutation which is located in the SH2-kinase linker region close to W395, the D656K mutation at the kinase domain C-terminus is far from the W395 side chain (43Å) suggesting that the conformational consequences of disrupting the autoinhibitory interaction between the C-lobe of the kinase and the SH2 domain are relayed into the SH2-kinase linker region.
To assess the extent of conformational changes induced by mutation of D656, we subjected FL BTK D656K to HDX-MS and compared it to WT BTK (Fig. 5b). The HDX pattern for FL BTK D656K compared to WT is nearly identical to that of BTK P385A/T387A (Fig. 5a,b). Like the activating mutant in the BTK SH2-kinase linker region, mutation of D656 at the BTK C-terminus causes increased deuterium uptake for the same regions of the SH3, SH2 and kinase domains as well as modest changes in the SH2-kinase linker region and β3–β4 loop region of the PHTH domain in FL BTK D656K compared to WT (Fig. 5b,d.2,d.3). Thus, activity data combined with NMR and HDX show that disruption of either the SH3 domain interaction with SH2-kinase linker or the SH2 domain interaction with the kinase C-terminal aspartate is sufficient to activate BTK and that breaking either interaction causes a conformational shift in FL BTK that is characterized by increased HDX in the regions of the BTK kinase domain that play important roles in catalysis.
Beyond the SH3–SH2-kinase structure – the proline-rich region and PHTH domain
The Tec kinases contain a unique proline rich region (PRR) located between the PHTH and SH3 domains (Fig. 1a,b). This stretch of residues in BTK was not present in the constructs used to determine the structural model of autoinhibited BTK (Wang et al., 2015) and the functional significance of this region has remained elusive. In studies that made use of small BTK PRR-SH3 fragments, we have previously shown that the PRR in BTK mediates a complex equilibrium by binding to the adjacent SH3 domain in both an intra- and intermolecular fashion (Laederach et al., 2002). To test whether the SH3 domain binds the PRR in a larger BTK fragment we acquired a series of 1H-15N TROSY-HSQC spectra of the isolated BTK SH3 domain, a BTK fragment that spans the N-terminus to the SH3 domain (PHTH-PRR-SH3) and the corresponding fragment replacing four prolines (P189, P192, P203, P206) in the proline rich region with alanine (PHTH-PRR(A)-SH3). The resonance for the conserved tryptophan in the SH3 binding pocket (W251) shifts and broadens in the BTK PHTH-PRR-SH3 construct compared to BTK SH3 alone suggesting that the SH3 domain is occupied in the larger fragment (Fig. 4f(i)). We next compare the spectra of WT BTK PHTH-PRR-SH3 and mutant PHTH-PRR(A)-SH3 and find that mutation of the proline residues results in a shift of the W251 resonance back to the position of the W251 resonance in isolated SH3 (Fig. 4f(ii)) suggesting the PRR binds to the SH3 domain in the larger PHTH-PRR-SH3 construct.
We next set out to assess what role, if any, the PRR plays in controlling the conformational preferences and activity of FL BTK. Mutating the same four proline residues (P189, P192, P203, P206) to alanine in the context of FL BTK (FL BTK PRR(A)) results in a slight decrease in autophosphorylation compared to WT BTK (Fig. 4d,e). The 1H-15N TROSY-HSQC spectrum of FL BTK PRR(A) mutant shows loss of the downfield W395 resonances (Fig. 4c(iii)) suggesting that the open forms of BTK evident in the spectrum of FL WT BTK are no longer accessible and, to the extent possible, the protein conformational preference shifts toward the closed, autoinhibited conformation. HDX-MS data also support this conclusion as we observe very little changes in HDX between the WT and BTK PRR(A) mutant (Fig. 5c). There is a small amount of reduced exchange evident in the SH3 domain of the FL BTK PRR(A) mutant consistent with stabilization of the autoinhibited form (Fig. 5c). Together, these data suggest that the BTK PRR can bind to the adjacent SH3 domain and competes with the BTK SH2-kinase linker region in a manner that triggers opening of the autoinhibited BTK structure.
PIP3 disrupts the autoinhibited conformation of FL BTK and increases exposure throughout the SH3–SH2-kinase
THE BTK PHTH domain is another unique feature of the TEC family kinases and its role in regulating kinase activity is continuing to come into focus. It is noted that in the model of autoinhibited BTK (Wang et al., 2015), PHTH was tethered directly to the BTK kinase domain for crystallization and so the behavior of the PHTH region in FL BTK has not been extensively studied. As a first step to assess the regulatory role of the PHTH region in BTK we made use of the PH domain ligand phosphatidylinositol (3,4,5)-trisphosphate (PIP3). It is well established that BTK is activated by binding to PIP3 following B cell receptor activation (Rawlings et al., 1996). Indeed, FL BTK incubated with PIP3 containing liposomes shows increased phosphorylation compared to BTK alone or in the presence of control liposomes without PIP3 (Fig. 6a,b).
Fig. 6. Activation of BTK by PIP3 liposomes.

(a) BTK activity monitored either in the absence of liposomes, or the presence of PIP3 or control liposomes. (b) Quantification of data in (a) was done as in Fig. 3e. Data is the average of three experiments. (c) HDX data for FL BTK in the presence and absence of PIP3 left panel: DControl lipids + FL − DLipid free FL, right panel: DPIP3 lipids + FL − DControl lipids + FL. (d) PIP3 induced HDX changes on the SAXS derived structure of FL BTK (SASBDB ID: SASDC52). PRR, linker between SH3 and SH2 and the SH2-kinase linker are shown as dotted lines. PIP3 is shown as sticks. The modest increase in deuterium exposure observed in the SH2-kinase linker is indicated as a light pink box. (e) Close-up of HDX results mapped onto the BTK kinase domain. Regions of increased exchange: β2 strand, β2– β3 loop and the activation segment adjacent to the autophosphorylation site Y551 are labeled. See also Data S1.
To probe the conformational changes that accompany PIP3 mediated BTK activation, we carried out HDX-MS of FL BTK in the presence of PIP3 and control liposomes that do not contain PIP3. In the presence of PIP3 we observe extensive reduction in deuterium exchange in regions surrounding the lipid binding pocket of the BTK PHTH domain (Fig. 6c,d). Elsewhere, increases in deuterium exchange are observed upon binding of FL BTK to PIP3. Specifically, the SH3 and SH2 domains show meaningful increases in deuterium uptake and this increased exposure extends into the SH2-kinase linker as well as the N-lobe of the kinase domain (Fig. 6c,d). In a manner similar to the activating mutants BTK P385A/T387A and BTK D656K (Fig. 5a, b), the location of the observed changes in the kinase domain correspond to regions that are implicated in catalysis; in particular the activation segment shows increased exchange upon PIP3 engagement of the PHTH domain (Fig. 6e). The increase in deuterium exchange along the activation segment is adjacent to Y551, the site of phosphorylation required to activate BTK (Rawlings et al., 1996). The data show that activation of BTK by lipid engagement is accompanied by large scale rearrangements of the domains. In fact, mapping the HDX data onto the fully ‘open’ SAXS derived model of BTK (Marquez et al., 2003) shows that the changes in BTK upon PIP3 binding are consistent with a conformational change from a closed autoinhibited conformation (Fig. 1b) to that of an open active state (Fig. 6d).
Probing the PHTH mediated autoinhibitory contact within FL BTK
Taking advantage of the FL BTK sample we wished to use the suite of NMR, HDX-MS and activity assays to further characterize the interface between PHTH and kinase domains in autoinhibited BTK. The tethered PHTH-kinase crystal structure suggests a regulatory interface involving contacts between R133 and Y134 in the helix-2 loop region of the PHTH domain and the N-lobe of the kinase domain including W395 in the SH2-kinase linker (Figs. 3a,b.2). To our surprise, mutation of R133 and Y134 to glutamate in the context of FL BTK results in little change in the W395 resonance compared to WT BTK (Fig. 7a(i),(ii)). This is in contrast to the effect of the activating mutations in the SH2-kinase linker region and kinase C-lobe on the W395 resonance (Fig. 4c(i),(ii)). HDX-MS experiments to probe differences between WT BTK and FL BTK R133E/Y134E also show no significant changes as a result of mutation in the PHTH domain (Fig. 7b(i)). These findings were then followed up with activity assays (Fig. 7c,d) and, consistent with the biophysical data, the R133E/Y134E mutation does not activate FL BTK. Since these data suggest that the PHTH/kinase interface observed crystallographically may not represent the primary autoinhibitory contact contributed by the PHTH domain in the context of FL BTK, we turned our attention to HDX studies focused on the BTK PHTH domain.
Fig. 7. Mutation of the BTK PHTH domain activates FL BTK.

(a) Trp side chain region of the 1H−15N TROSY-HSQC spectrum of WT FL BTK (i) and BTK mutants. While no major change is observed for FL BTK R133E/Y134E (ii), BTK Y42A/D43A (iii) shifts the conformational equilibrium to the active state. (b) Differences in HDX between WT and mutant BTK: (i) DR133E/Y134E FL − D WT FL, (ii) DY42A/D43A FL − DWT FL. (c) Western blot showing the kinase activity of 6XHis-tagged FL WT BTK, BTK Y42A/D43A and BTK R133E/Y134E. (d) Histogram showing the BTK activity data in (c). The phosphorylation levels were quantified and normalized as in Fig. 3e and averaged of three independent experiments. (e) HDX differences comparing FL BTK to BTK Y42A/D43A (b(ii)) mapped onto the autoinhibited BTK model along with close up views of increased deuterium incorporation. See also Data S1.
HDX-MS data for the PHTH domain compared to FL BTK shows that residues in the PHTH β3β4 loop undergo less deuterium exchange when the PHTH domain is in the context of the FL protein, whereas no change is observed for the helix-2 loop region of PHTH (Fig. 8a–c). The region of PHTH domain spanning residues, LTVHKLSYYEYD, exhibits less exchange in FL BTK at early time points that is sustained through the time course of the HDX experiment (Fig. 8a,b). A shorter peptide lacking the C-terminal residues Y42 and D43, LTVHKLSYYE, does not exhibit reduced exchange in this experiment. This result prompted mutation of Y42 and D43 (Fig. 3b.4,c) to alanine in the context of FL BTK for NMR, activity and further HDX assays. Analysis of the W395 resonance for FL BTK Y42A/D43A compared to the WT BTK spectrum shows a shift in the population away from the autoinhibited form toward the resonance corresponding to the active, open conformation (Fig. 7a(i),(iii)). Unlike the complete shift to the downfield resonance observed for mutations in the SH2-kinase linker and C-lobe of the kinase domain (Fig. 4c(i),(ii)), mutation of Y42/D43 only partially shifts the conformational equilibrium to the active state. A fraction of the population of FL BTK remains in the autoinhibited form with respect to the W395 resonance frequency. One interpretation is that, even in the context of the Y42A/D43A mutation, the autoinhibited conformation of the 3-2-L-KD remains partially populated. We have, in a separate study, examined the W395 resonance of an oncogenic form of BTK that lacks more than half of the PHTH domain including the β3–β4 loop (Grassilli et al., 2016) and find the same W395 spectral signature (data not shown). This suggests that loss of the PHTH domain region that contains Y42/D43, whether by large scale deletion or specific mutation, leads to a partial shift in the FL BTK population ensemble toward the active form while a portion of the BTK ensemble retains the autoinhibited conformation.
Fig. 8. BTK PHTH domain mapping.

(a) DFL − DPHTH. (b) Deuterium incorporation curves for (i) β3 loop peptide, (ii) peptide containing R133/Y134 in the isolated BTK PHTH domain (red trace), and in the context of FL BTK (blue trace). (c) Differences in HDX from (a) on the structure of the BTK PHTH domain. Y42 and D43 are shown. (d) DFL − D3-2-L-KD. (e) HDX differences in (d) mapped onto the model of FL BTK. 3-2-L-KD is shown in ribbons and the PHTH domain is surface rendered. Close up views of changes in the C-lobe and in the SH2-kinase linker are shown. See also Data S1.
Consistent with the population shift toward the active state, FL BTK Y42A/D43A is more active than WT BTK (Fig. 7c,d) and HDX-MS data show increased exchange in several regions throughout FL BTK (Fig. 7b(ii),e). The observed HDX differences are more modest than those observed upon mutation of the SH3 and SH2 contacts (Fig. 5a,b) or in the presence of PIP3 (Fig. 6c), in line with the partial shift toward the more open conformation observed by NMR (Fig. 7a(iii)). Mutation of Y42A/D43A causes the most pronounced increase in deuterium uptake in the BTK PHTH domain consistent with release of the PH domain from its autoinhibitory contacts but it is also interesting to note that a modest increase in deuterium uptake is also observed for the SH2-kinase linker (Fig. 7e), a region that shows similar changes in the BTK FL D656K activating mutant (Fig. 5b,d.2) as well as upon activation of BTK by PIP3 (Fig. 6c,d).
The HDX-MS data together with the NMR data suggest that the PHTH β3β4 loop mediates an autoinhibitory contact. This result motivated us to compare HDX in FL BTK with that of 3-2-L-KD fragment to determine whether a complimentary binding surface for the PHTH domain ‘latch’ could be identified. The data show both increases and decreases in deuterium exchange throughout 3-2-L-KD (Fig. 8d). Decreased deuterium uptake for FL BTK compared to 3-2-L-KD is observed in the kinase domain, particularly in the F helix loop and at R600 at the top of the G helix in the C-lobe (Fig. 8d,e). The observed reduction at these locations may indicate a regulatory docking site on the kinase domain for PHTH that differs from that in the PHTH-kinase structure (Wang et al., 2015). In fact, deuterium uptake does not decrease in the region of the N-lobe that contacts the PHTH domain in the tethered PHTH-kinase structure (Fig. 8d). Increased deuterium uptake is observed in the BTK SH2 domain and SH2-kinase linker in FL BTK as compared to 3-2-L-KD (Fig. 8d,e). At first this seems inconsistent with the role of the PHTH domain in stabilizing the autoinhibited enzyme, however, the BTK 3-2-L-KD fragment lacks not only the autoinhibitory PHTH domain but also the activating PRR. We therefore suggest that the observed HDX increase in the SH2 and SH2-kinase linker means that FL BTK accesses the active, open conformation (consistent with the range of resonance frequencies observed for W395) by binding of the PRR to the SH3 domain. In the absence of the PRR, the autoinhibited conformation of the 3-2-L-KD fragment is more stable. Thus, the N-terminal extension of the TEC kinases serves a complex role in regulating the active versus inactive kinase conformation.
Discussion
Building on the recently reported structures of multi-domain fragments of BTK (Wang et al., 2015), our solution studies of FL BTK have uncovered additional structural features governing the regulation of this kinase family. FL BTK predominantly adopts a closed, autoinhibited conformation in dynamic equilibrium with a minor population of partially/completely open and active conformational states. In addition to confirming the previously identified autoinhibitory interaction between SH3 and SH2-kinase linker, we identify several new interactions that stabilize the autoinhibited conformation. Despite lacking the conserved regulatory phosphotyrosine (pY)-tail of the SRC family (Fig. 3d,e), the TEC kinases mimic the SRC pY/SH2 domain interaction via an alternative conserved ‘latch’ residue (D656 in BTK) at the C-terminus of the kinase domain (Fig. 3b.3). A salt bridge between D656 and R307 in the SH2 binding pocket stabilizes the autoinhibited 3-2-L-KD domain structure common to ABL, SRC and TEC families (Nagar et al., 2003; Sicheri et al., 1997; Wang et al., 2015; Xu et al., 1997). The difference in charge density between a carboxylic acid and a phosphorylated tyrosine suggests that the SH2 mediated autoinhibitory interaction in BTK may be of lower affinity and therefore more dynamic than that of SRC. Indeed, the high B factors in the SH2 domain region of the BTK SH3-SH2-kinase crystal structure bear this out (Wang et al., 2015).
Beyond 3-2-L-KD, the extended amino-terminal PHTH domain of BTK contributes an autoinhibitory ‘latch’ not found in SRC or ABL. Probing the precise regulatory surface of PHTH, our NMR studies show that mutation of previously identified residues, R133 and Y134, causes no detectable change in the chemical shift of BTK W395, which lies in close proximity to R133 and Y134 in the BTK autoinhibited model (Fig. 3b.2, 4a, 7a(ii)). Moreover, HDX comparison of FL BTK to the isolated PHTH domain shows no difference in deuterium exchange for the helix-2 loop region and instead suggest the PHTH β3β4 loop region is buried in the context of the FL enzyme (Fig. 8a–c). Mutation in the β3β4 region destabilizes the autoinhibited form and activates FL BTK (Fig. 7a(iii),b(ii),c–e). Interestingly, HDX data (Fig. 8d,e) provide a hint that the BTK PHTH region may bind across the activation segment. Certainly further structures of TEC kinases will be needed to definitively confirm these results but it is intriguing that the potential landing site for the PHTH domain may be centered over the active site of the kinase domain; the same region that is buried in the structure of another PH domain containing kinase, AKT (Calleja et al., 2009).
It seems likely that the BTK PHTH domain makes multiple contacts while transitioning from the autoinhibited form to the open, active conformation and the crystal structure of the tethered BTK PHTH-kinase construct showing a direct interaction between the PHTH helix-2 loop region and the N-lobe of the kinase may have captured one such contact. In the PHTH-kinase structure, crystal contacts show the PHTH domain engaged in the ‘Saraste dimer’ (Hyvonen and Saraste, 1997); a transient conformational state that promotes trans autophosphorylation and activation of BTK (Wang et al., 2015). The activating BTK Y42A/D43A mutation lies at the interface of the ‘Saraste dimer’ and so it is appealing to consider that PHTH in the fully autoinhibited, monomeric enzyme may not only stabilize the inactive kinase domain conformation and occlude the BTK activation loop, but also mask the ‘Saraste dimer’ interface until PIP3 is produced at the membrane to pull the autoinhibited structure apart and permit dimerization. In addition to PIP3 binding, soluble inositol hexakisphosphate (IP6), an activating ligand that binds to a peripheral site on PHTH stabilizing the β3β4 loop in a dimerization competent conformation (Wang et al., 2015), could also compete with the autoinhibited form. Thus, activating signals could trigger partial opening of the closed form of BTK described by our solution studies. In the putative intermediate state the PHTH domain can be lipid engaged and form the ‘Saraste dimer’ but activation loop phosphorylation has not yet occurred. It is worth noting that PIP3 binding to FL BTK causes allosteric changes that extend into SH3, SH2 and kinase domains (Fig. 6c,d) even in the absence of ATP, and so significant destabilization of the autoinhibited form seems independent of activation loop phosphorylation. Further conformational transitions toward fully active BTK, perhaps characterized by the domain arrangements observed in the SAXS model (Marquez et al., 2003), would complete the activation process.
It has been previously established that the enigmatic PRR common to the TEC family kinases binds to the adjacent SH3 domain (Andreotti et al., 1997; Laederach et al., 2002; Laederach et al., 2003) and data presented here suggest that loss of the BTK PRR increases the population of the autoinhibited conformation. The dual binding capability of BTK SH3 with SH2-linker (in the autoinhibited form) or the PRR provides an internal mechanism for stabilization/destabilization of the autoinhibitory state. The positive regulatory role of the PRR is consistent with studies demonstrating that mutation or deletion of the PRR in BTK and ITK leads to decreased basal activity (Hao and August, 2002; Hawkins and Marcy, 2001; Saito et al., 2001). Yet, disruption of the PHTH ‘latch’ by mutation or deletion alone is insufficient to completely shift the equilibrium of FL BTK to the open conformation and so the PRR by itself is not enough to activate BTK. HDX suggests that allosteric changes such as those mediated by PIP3 binding to the PHTH domain, exogenous ligand binding to SH3, or binding of pY ligand to the SH2 domain are key for complete disruption of autoinhibitory contacts.
The multiplicity of these BTK regulatory sites and the varying levels of activation achievable upon differential inputs is likely an important feature behind the ‘rheostat’ or ‘analog’ activation associated with TEC kinase signaling (Conley et al., 2016; Grasis and Tsoukas, 2011) versus a binary on/off switch for other kinases (Altan-Bonnet and Germain, 2005; Au-Yeung et al., 2014). Indeed, the W395 NMR resonance provides direct evidence that FL BTK adopts a range of conformations in solution. In developing, resting, or activated cells, a precise balance must be created between the abundance and localization of activating and inactivating binding partners for the BTK regulatory domains in response to the strength of the extracellular signal input (Mohamed et al., 2009). The interplay between these signals will dictate the conformational equilibrium of the FL TEC kinases in vivo determining the nature of the graded cellular response.
Star Methods
CONTACT FOR REAGENT AND RESOURCE SHARING
Further information and requests for resources and reagents should be directed to and will be fulfilled by the Lead Contact, Amy H. Andreotti (amyand@iastate.edu).
EXPERIMENTAL MODEL AND SUBJECT DETAILS
Cell lines
Protein expression was carried out in either E. coli BL21(DE3) (Agilent) or BL21(DE3) Gold (Millipore Sigma) cells. The cells were grown in either LB Broth (Fisher Scientific) or M9 minimal media at 37 °C, shaking at 250 rpm to produce unlabeled or labeled protein respectively.
METHOD DETAILS
Constructs
Murine wild-type or kinase inactive (K430R) BTK full-length (FL) (M1-S659), BTK SH3-SH2-Linker-Kinase Domain (3-2-L-KD, S212-S659), and BTK SH2-Linker-Kinase Domain (2-L-KD, T270-S659) with a C-terminal 6X-His Tag were cloned into the pET 20b vector (EMD Millipore). The C-terminally 6X-His tagged wild-type or kinase inactive (K430R) BTK Linker Kinase Domain (L-KD, K382-S659) was cloned into the pET28a vector (EMD Millipore) with a vector derived Glycine residue at the N-terminus after the start Methionine. The bacterial expression construct for the BTK Kinase Domain (KD) has been described previously (Joseph et al., 2010). All kinase domain containing constructs carry a Y617P mutation for soluble protein expression in bacteria. The BTK PHTH domain (M1-K176, murine) and BTK PHTH-PRR-SH3 domain (M1-S270, murine) were cloned into the pET 20b vector (EMD Millipore) with an N-terminal 6X-His and GB1 tag followed by a Factor Xa cleavage site. The BTK SH3 domain (L216-S275, human) and BTK SH2 domain (T270-T387, human) (NMR resonances previously assigned (Hansson et al., 1998; Huang et al., 2006)) were cloned into the pGEX-2T vector (GE Healthcare) to facilitate NMR assignments of the murine forms of these domains. The murine BTK SH3 domain (E215-S275), BTK SH2 domain (W281-S378), and BTK SH3-SH2 domain (E215-S378) were used for HDX-MS experiments and cloned into the pGEX-4T vector (GE Healthcare). The pCDFDuet YopH construct was a kind gift from Thomas E. Smithgall’s lab. All mutations were introduced using the site-directed mutagenesis kit (Agilent Technologies) and verified by sequencing at the Iowa State University DNA synthesis and sequencing facility.
Protein Expression and Purification
Full-length, kinase active BTK and deletion fragments were produced by co-expressing BTK with YopH in BL21(DE3) (Millipore Sigma) or BL21-Gold(DE3) cells (Agilent Technologies). Kinase inactive (K430R) BTK constructs were expressed in BL21(DE3) cells without co-expression with YopH. Briefly, the culture was grown in LB Broth (Fisher Scientific) at 37 °C, shaking at 250 rpm to an O.D. 600 nm of 0.6 to 0.8. The temperature of the culture was lowered to 18 °C and then induced with either 1.0 mM IPTG for BTK KD and BTK LKD constructs or 0.1 mM IPTG for all other BTK constructs (full-length, 3-2-L-KD, 2-L-KD, PHTH and PHTH-PRR-SH3). The culture was harvested 24 hours after induction and the pellets were resuspended in lysis buffer (Tris pH 7.8 at 4 °C, 150 mM NaCl, 20 mM imidazole and 0.5 mg/ml lysozyme) and stored at −80 °C. Cells were lysed by thawing and the action of lysozyme, and 3000 U DNAse I (Sigma) and 1 mM PMSF were added to the lysate, which was then spun at 16,000 rpm for one hour at 4 °C. The supernatant was incubated with Ni-NTA resin (QIAGEN) for two hours, washed with Tris pH 7.8 at 4 °C, 75 mM NaCl, 40 mM imidazole, and eluted in 50 mM Tris pH 7.8, 150 mM NaCl, 250 mM Imidazole, and 10% glycerol. Eluted protein was flash frozen in liquid nitrogen and stored at −80 °C. The proteins were concentrated and dialyzed into the final NMR buffer which consists of 20 mM Tris, 150 mM Sodium chloride, 10% glycerol, pH 8.0. For HDX-MS analysis, the proteins were further purified by size exclusion chromatography (Hiload Superdex 26/60 200 pg or Hiload Superdex 26/60 75 pg, GE Healthcare). The fractions containing pure protein were pooled, concentrated, snap frozen and stored at −80° C. The final buffer consists of 20 mM Tris, 150 mM Sodium chloride, 10% glycerol, pH 8.0. The 6XHIS-GB1-BTK PHTH or PHTH-PRR-SH3 fusions were cleaved by incubating overnight with Factor Xa in the presence of 5 mM CaCl2 at room temperature. The cleaved protein was further purified by size exclusion chromatography (Hiload Superdex 26/60 75 pg, GE Healthcare). The fractions containing pure protein were pooled, concentrated, snap frozen and stored at −80° C as before. The BTK SH3 domain, BTK SH2 domain and BTK SH3-SH2 domain fragments were expressed in BL21(DE3) cells. The culture was grown at 37 °C to an O.D. 600 nm of 0.6 to 0.8. The temperature of the culture was lowered to 22 °C and then induced with 1.0 mM IPTG. The culture was harvested 24 hours later and the pellets were re-suspended in lysis buffer (50 mM KH2PO4 pH 7.2 at 4 °C, 75 mM NaCl, 2 mM DTT, 0.02 % NaN3 and 1 mg/ml lysozyme) and stored at −80 °C. Cells were lysed by thawing in the presence of 3000 U DNAse I (Sigma) and 1 mM PMSF. The lysate was spun at 16,000 rpm for one hour at 4 °C. The supernatant was incubated with glutathione-agarose resin (GE healthcare), washed with lysis buffer without lysozyme and eluted in 50 mM KH2PO4 pH 7.2 at 4 °C, 75 mM NaCl, 2 mM DTT, 0.02 % NaN3 with 10 mM glutathione. Eluted protein was concentrated, buffer exchanged to remove the glutathione, cleaved with Thrombin and further purified by passing through the glutathione-agarose resin followed by size exclusion chromatography (Hiload Superdex 26/60 75 pg, GE Healthcare). The fractions containing pure protein were pooled, concentrated and dialyzed into the NMR buffer (20 mM Tris, 150 mM Sodium chloride, 10% glycerol, pH 8.0).
Liposome preparation/sample equilibration
Lipids dissolved in chloroform were combined in the ratios of 79:21, DOPC:DOPS for control liposomes and 75:20:5, DOPC:DOPS:PIP3 for liposomes that were loaded with PIP3. After chloroform evaporation under dry nitrogen for 10 minutes, the samples were dried further overnight by lyophilization before the resultant lipid cakes were hydrated in equilibration buffer (20 mM Tris pH 8.01, 150 mM NaCl, 10% glycerol) to final concentrations of 12.3 mM and 11.9 mM for PS:PC and PS:PC:PIP3 liposomes, respectively. Liposomes were then extruded to uniformity using 100 nm filters (Millipore). For HDX experiments with liposomes, protein and liposome were equilibrated at room temperature (21 C) in a protein:lipid ratio of 1:125 (20 uM protein and 2.5 mM lipid) for 15 minutes prior to 18-fold dilution into deuterium exchange buffer (see below).
Kinase Assays and Western Blotting
In vitro kinase assays were performed by incubating 0.5 to 1 μM full-length BTK (wild type or mutant) in a kinase assay buffer (50 mM Hepes pH 7.0, 10 mM MgCl2, 1 mM DTT, 1 mg/mL BSA, 1 mM Pefabloc, and 200 μM ATP) at room temperature. The reactions were stopped at various time points and the samples were boiled, separated by SDS-PAGE, and Western blotted with the anti-pY antibody (EMD Millipore) or anti-His antibody (EMD Millipore) as described previously (Joseph et al., 2010). For the liposome experiments, two μM Full-length BTK was pre-incubated at room temperature for 5 to 10 minutes with 400 μM liposomes in a 25 μL volume in buffer without ATP (50 mM Hepes pH 7.0, 10 mM MgCl2, 5 % glycerol, 1X Halt™ protease and phosphatase inhibitor cocktail (ThermoFisher Scientific)). The reaction was initiated with the addition of 25 μL of ATP containing buffer (50 mM Hepes pH 7.0, 10 mM MgCl2, 1 mM DTT, 1 mg/mL BSA, 1 mM Pefabloc, 200 μM ATP, 5% glycerol and 1X Halt™ protease and phosphatase inhibitor mix). The final concentration of BTK was one mM with 200 μM liposomes after dilution to the final 50 μL reaction volume. The reaction was stopped at various time points and then processed for western blotting as before. The western blots were quantified using the ChemiDoc detection system (BioRad).
Deuterium Exchange reactions
Deuterium labeling and analysis was carried out as described previously (Boyken et al., 2014). Deuterium labeling was initiated with an 18-fold dilution of an aliquot (between 40 and 80 picomoles per sample depending upon the protein construct) into a buffer containing 99.9 % D2O, 20 mM Tris pD 8.01, 150mM NaCl, 10% glycerol. At specific time points (10 sec, 1 min, 10 min, 1 hour, 4 hours) the labeling reaction was quenched with the addition of an equal volume of quench buffer (150 mM potassium phosphate, 100 % H2O, pH 2.47). Quenched samples were immediately injected immediately into a Waters nanoACQUITY with HDX technology for online pepsin digestion using an in-house prepared immobilized pepsin column and UPLC separation of the resulting peptic peptides. All mass spectra were acquired using a Waters Synapt HDMSE mass spectrometer. Peptides that were generated from online pepsin digestion were identified from separate unlabeled protein and protein:liposome samples that were prepared in the same manner as those that were labeled with deuterium using Waters Protein Lynx Global Server 3.0 and deuterium incorporation information was determined using Waters DynamX 3.0 (Boyken et al., 2014). Relative deuterium levels for each peptide were calculated by subtracting the average mass of the undeuterated control sample from that of the deuterium labeled sample for isotopic distributions corresponding to the +1, +2, or +3 charge state of each peptide. The data were not corrected for back exchange and are therefore reported as relative. To calculate the difference in deuterium incorporation (shown on vertical difference maps in Fig. 2d, 2fi–ii, 5a–c, 6c and 7b, 8a, 8d and presented in Data S1) differences at each labeling time point for each peptide were calculated as described in the Figure legends. All coincident and overlapping peptides for comparisons in each figure are shown (sequences are shown in Data S1). The figure does not represent a linear sequence of non-overlapping peptides.
NMR analysis
Uniformly 15N labeled BTK samples were produced as described earlier in the protein expression and purification section of the Methods, by growth in modified M9 minimal media containing 15N ammonium chloride (1g/L, Cambridge Isotope Laboratories, Inc.) as the sole source of nitrogen. For the expression of BTK full-length, PHTH domain and PHTH-PRR-SH3 constructs, the M9 minimal media was supplemented with 0.1 mM Zinc chloride. The final NMR sample buffer consists of 20 mM Tris, 150 mM Sodium chloride, 10% glycerol, pH 8.0. All NMR spectra were collected at 298 K on a Bruker AVIII HD 800 or Bruker AVII 700 spectrometers each equipped with a 5 mm HCN z-gradient cryoprobe operating at 1H frequencies of 800.41 or 700.13 MHz, respectively. NMR samples with peptides consisted of 130 to 155 mM 15N labeled BTK FL, SH3 domain, SH2 domain or 3-2-L-KD mixed with either 3 mM BTK phospho-peptide ligand (GDGpYEEISPLLL, GenScript) (Tzeng et al., 2000) or 3 mM proline rich peptide (GWYSKPPPPIP, GenScript). All data were analyzed using NMRViewJ (Johnson and Blevins, 1994).
Assignment of the tryptophan side chain region of the 1H-15N TROSY-HSQC spectrum of FL BTK
Uniformly 15N-labeled 6X-His tagged BTK full-length (FL) protein was expressed and purified from bacteria. The 1H-15N TROSY-HSQC spectrum of FL BTK contains multiple overlapping peaks, but the resonances in the tryptophan indole NH region are well-resolved (Figure S1). There are eleven tryptophan residues within FL BTK (Figure S2a): two in the PHTH domain (W124 and W147), two in the SH3 domain (W251 and W252), one in the SH2 domain (W281), one in the SH2-kinase linker (W395), and five in the kinase domain (W421, W563, W581, W588 and W634).
A series of 15N-labeled BTK deletion fragments were produced for NMR resonance assignments (Figure S2b). The tryptophan region of the spectrum acquired for BTK linker-kinase domain (BTK L-KD), contains six resonances consistent with five tryptophan side chains in the kinase domain and one (W395) in the linker between SH2 and kinase domain (Figure S3a(i)). Using site-directed mutagenesis, we targeted two tryptophans, W395 located in the SH2-kinase linker, and W421 in the N-lobe of the kinase domain. For both BTK W395A and W421F mutants, the resulting spectra are missing a single peak which is assigned to the correspondingly mutated tryptophan (Figure S3a(ii), (iii)).
We next extended the assignment of tryptophan indole NH resonances within larger fragments of BTK. One additional peak is evident in the tryptophan side chain region of the 1H-15N TROSY-HSQC of the BTK SH2-Linker-Kinase Domain fragment (BTK 2-L-KD) consistent with the additional tryptophan in this fragment, W281 (Figure S3b(i)). Assignment of the W281 resonance is confirmed by comparison to the previously assigned spectrum of the isolated BTK SH2 domain (Huang et al., 2006) (Figure S3b(ii)). Extending the domain construct to include the SH3 domain (BTK 3-2-L-KD) results in a spectrum that resembles that of BTK 2-L-KD; W421 and W281 are readily identified based on assignments in the smaller fragments (Figure S3b(iii)). In addition, comparison with the previously assigned spectrum of isolated BTK SH3 domain (Hansson et al., 1998) (Figure S3b(iv)) permits unequivocal assignment of one of the two SH3 tryptophans, W252. The other tryptophan in the SH3 domain, W251, is either absent in the spectrum of BTK 3-2-L-KD due to line broadening or overlaps with the W395 resonance. Notably, the W395 resonance in BTK 3-2-L-KD is shifted upfield compared to the W395 resonance assigned in the shorter BTK fragments (Figure S3).
Peptide titrations are next used to determine whether W251 and W395 are degenerate in the spectrum of BTK 3-2-L-KD. Titration of the same proline-rich peptide, GWYSKPPPPIP, into both the isolated BTK SH3 domain and BTK 3-2-L-KD shows distinct chemical shift changes for the resonances in question. The W251 resonance in the isolated BTK SH3 domain shifts upfield upon addition of the proline-rich peptide (Figure S4a(i)). In contrast, the resonance in BTK 3-2-L-KD shifts in the opposite direction toward the W395 resonance observed in the smaller BTK 2-L-KD fragment (Figure S4a(ii)). This indicates that the peak observed in the spectrum of BTK 3-2-L-KD corresponds to W395 and not W251. To further test this assignment, we made a mutation in the BTK SH3 domain within the 3-2-L-KD construct, Y223A, previously shown to release the SH3 domain from binding the W395 containing SH2-kinase linker (Wang et al., 2015). The spectrum of the BTK 3-2-L-KD Y223A mutant shows two peaks in the region in question, one corresponds to the W251 resonance in the BTK isolated SH3 domain and the other corresponds exactly to W395 in the shorter BTK 2-L-KD fragment (Figure S4a(iii), (iv)). This result confirms the assignment of the W395 resonance in BTK 3-2-L-KD and suggests that W251 in the SH3 domain is broadened beyond detection in the BTK 3-2-L-KD fragment.
The tryptophan region of the 1H-15N TROSY-HSQC spectrum of full-length BTK is next compared to the assigned spectrum of BTK 3-2-L-KD. Much of the resonances in this region of the spectrum have disappeared but there is a peak that corresponds to the frequency of W395 (Figure S4b(i), (ii)). To test whether the peak evident in the spectrum of full-length BTK is W395 we mutated this residue to alanine and find that the resonance is absent in the resulting BTK FL W395A spectrum (Figure S4b(iii)). Finally, we added the same proline-rich peptide into full-length BTK and find that the W395 resonance in full-length BTK shifts slightly downfield in a manner that is the same as that observed upon addition of the peptide ligand to BTK 3-2-L-KD (Figure S4b(iv)).
W395 is now assigned in the tryptophan region of the 1H-15N TROSY-HSQC spectrum of full-length BTK and serves as a spectral probe for the conformational transitions that accompany activation and inactivation of BTK. Comparing full-length BTK (Figure S4b(i)) with either the Y223A mutant (previously characterized as an activating mutation (Wang et al., 2015)) or spectra of BTK containing proline-rich peptides that displace the SH3 domain from its autoinhibited conformation (Figure S4a(ii), 4b(iv)) we find that a downfield shift of the W395 resonance accompanies activation of the kinase. This spectral signature is used throughout the manuscript to probe the consequences of a number of mutations in full-length BTK.
QUANTIFICATION AND STATISTICAL ANALYSIS
Statistical details of experiments can be found in the Method Details and Figure legends.
DATA AND SOFTWARE AVAILABILITY
All software used in this study are indicated in the Key Resources Table and in the Method Details.
Supplementary Material
Document S1. Fig. S1–S4 and Table S1.
Data S1, related to Fig. 2, 5, 6, 7 and 8. HDX results attached as a multi-tabbed excel workbook. Tabs 1–8 are raw deuterium incorporation data for individual HDX experiments with BTK constructs studied here. Tab 9 shows all difference in deuterium incorporation data for all possible comparisons with BTK constructs that are calculated from tabs 1–8. Tabs 10–21 are the raw difference HDX data for all figures in the text (each tab name identifies the figure number).
Highlights.
Overcoming resistance to crystallization; solution methods applied to full-length BTK.
BTK finds an alternative to SRC regulatory tail and capitalizes on its PH domain.
Fully autoinhibited BTK is self-activated by its unique proline-rich region.
Graded/analog BTK activation is achieved via tunable regulatory contacts.
Acknowledgments
This work was funded by a grant from the National Institutes of Health (AI043957) to AHA and JRE. We would like to thank J. Kuriyan for critical reading of the manuscript, insightful advice, and very helpful perspective on these studies.
Footnotes
Publisher's Disclaimer: This is a PDF file of an unedited manuscript that has been accepted for publication. As a service to our customers we are providing this early version of the manuscript. The manuscript will undergo copyediting, typesetting, and review of the resulting proof before it is published in its final citable form. Please note that during the production process errors may be discovered which could affect the content, and all legal disclaimers that apply to the journal pertain.
Author Contributions
R.E.J. and T.E.W. conducted the experiments and analyzed data, D.B.F. oversaw acquisition of NMR data, A.H.A., J.R.E., R.E.J. and T.E.W. designed the experiments and wrote the paper.
References
- Altan-Bonnet G, Germain RN. Modeling T cell antigen discrimination based on feedback control of digital ERK responses. PLoS Biol. 2005;3:e356. doi: 10.1371/journal.pbio.0030356. [DOI] [PMC free article] [PubMed] [Google Scholar]
- Andreotti AH, Bunnell SC, Feng S, Berg LJ, Schreiber SL. Regulatory intramolecular association in a tyrosine kinase of the Tec family. Nature. 1997;385:93–97. doi: 10.1038/385093a0. [DOI] [PubMed] [Google Scholar]
- Andreotti AH, Schwartzberg PL, Joseph RE, Berg LJ. T-cell signaling regulated by the Tec family kinase. Itk Cold Spring Harb Perspect Biol. 2010;2:a002287. doi: 10.1101/cshperspect.a002287. [DOI] [PMC free article] [PubMed] [Google Scholar]
- Au-Yeung BB, Zikherman J, Mueller JL, Ashouri JF, Matloubian M, Cheng DA, Chen Y, Shokat KM, Weiss A. A sharp T-cell antigen receptor signaling threshold for T-cell proliferation. Proc Natl Acad Sci U S A. 2014;111:E3679–3688. doi: 10.1073/pnas.1413726111. [DOI] [PMC free article] [PubMed] [Google Scholar]
- Boyken SE, Chopra N, Xie Q, Joseph RE, Wales TE, Fulton DB, Engen JR, Jernigan RL, Andreotti AH. A conserved isoleucine maintains the inactive state of Bruton’s tyrosine kinase. J Mol Biol. 2014;426:3656–3669. doi: 10.1016/j.jmb.2014.08.018. [DOI] [PMC free article] [PubMed] [Google Scholar]
- Calleja V, Laguerre M, Parker PJ, Larijani B. Role of a novel PH-kinase domain interface in PKB/Akt regulation: structural mechanism for allosteric inhibition. PLoS Biol. 2009;7:e17. doi: 10.1371/journal.pbio.1000017. [DOI] [PMC free article] [PubMed] [Google Scholar]
- Conley JM, Gallagher MP, Berg LJ. T Cells and Gene Regulation: The Switching On and Turning Up of Genes after T Cell Receptor Stimulation in CD8 T Cells. Front Immunol. 2016;7:76. doi: 10.3389/fimmu.2016.00076. [DOI] [PMC free article] [PubMed] [Google Scholar]
- Erpel T, Superti-Furga G, Courtneidge SA. Mutational analysis of the Src SH3 domain: the same residues of the ligand binding surface are important for intra- and intermolecular interactions. EMBO J. 1995;14:963–975. doi: 10.1002/j.1460-2075.1995.tb07077.x. [DOI] [PMC free article] [PubMed] [Google Scholar]
- Grasis JA, Tsoukas CD. Itk: the rheostat of the T cell response. J Signal Transduct. 2011;2011:297868. doi: 10.1155/2011/297868. [DOI] [PMC free article] [PubMed] [Google Scholar]
- Grassilli E, Pisano F, Cialdella A, Bonomo S, Missaglia C, Cerrito MG, Masiero L, Ianzano L, Giordano F, Cicirelli V, et al. A novel oncogenic BTK isoform is overexpressed in colon cancers and required for RAS-mediated transformation. Oncogene. 2016;35:4368–4378. doi: 10.1038/onc.2015.504. [DOI] [PMC free article] [PubMed] [Google Scholar]
- Hansson H, Mattsson PT, Allard P, Haapaniemi P, Vihinen M, Smith CI, Hard T. Solution structure of the SH3 domain from Bruton’s tyrosine kinase. Biochemistry. 1998;37:2912–2924. doi: 10.1021/bi972409f. [DOI] [PubMed] [Google Scholar]
- Hao S, August A. The proline rich region of the Tec homology domain of ITK regulates its activity. FEBS Lett. 2002;525:53–58. doi: 10.1016/s0014-5793(02)03066-1. [DOI] [PubMed] [Google Scholar]
- Hawkins J, Marcy A. Characterization of Itk tyrosine kinase: contribution of noncatalytic domains to enzymatic activity. Protein Expr Purif. 2001;22:211–219. doi: 10.1006/prep.2001.1447. [DOI] [PubMed] [Google Scholar]
- Huang KC, Cheng HT, Pai MT, Tzeng SR, Cheng JW. Solution structure and phosphopeptide binding of the SH2 domain from the human Bruton’s tyrosine kinase. J Biomol NMR. 2006;36:73–78. doi: 10.1007/s10858-006-9064-3. [DOI] [PubMed] [Google Scholar]
- Huse M, Kuriyan J. The conformational plasticity of protein kinases. Cell. 2002;109:275–282. doi: 10.1016/s0092-8674(02)00741-9. [DOI] [PubMed] [Google Scholar]
- Hyvonen M, Saraste M. Structure of the PH domain and Btk motif from Bruton’s tyrosine kinase: molecular explanations for X-linked agammaglobulinaemia. EMBO J. 1997;16:3396–3404. doi: 10.1093/emboj/16.12.3396. [DOI] [PMC free article] [PubMed] [Google Scholar]
- John Cavanagh WJF, Palmer Arthur G, Rance Mark, Skelton Nicholas J. Protein NMR Spectroscopy. 2nd. Academic Press; 2006. [Google Scholar]
- Johnson BA, Blevins RA. NMR View: A computer program for the visualization and analysis of NMR data. J Biomol NMR. 1994;4:603–614. doi: 10.1007/BF00404272. [DOI] [PubMed] [Google Scholar]
- Joseph RE, Xie Q, Andreotti AH. Identification of an allosteric signaling network within Tec family kinases. J Mol Biol. 2010;403:231–242. doi: 10.1016/j.jmb.2010.08.035. [DOI] [PMC free article] [PubMed] [Google Scholar]
- Kurosaki T. Regulation of BCR signaling. Mol Immunol. 2011;48:1287–1291. doi: 10.1016/j.molimm.2010.12.007. [DOI] [PubMed] [Google Scholar]
- Laederach A, Cradic KW, Brazin KN, Zamoon J, Fulton DB, Huang XY, Andreotti AH. Competing modes of self-association in the regulatory domains of Bruton’s tyrosine kinase: intramolecular contact versus asymmetric homodimerization. Protein Sci. 2002;11:36–45. doi: 10.1110/ps.26702. [DOI] [PMC free article] [PubMed] [Google Scholar]
- Laederach A, Cradic KW, Fulton DB, Andreotti AH. Determinants of intra versus intermolecular self-association within the regulatory domains of Rlk and Itk. J Mol Biol. 2003;329:1011–1020. doi: 10.1016/s0022-2836(03)00531-x. [DOI] [PubMed] [Google Scholar]
- Marquez JA, Smith CI, Petoukhov MV, Lo Surdo P, Mattsson PT, Knekt M, Westlund A, Scheffzek K, Saraste M, Svergun DI. Conformation of full-length Bruton tyrosine kinase (Btk) from synchrotron X-ray solution scattering. EMBO J. 2003;22:4616–4624. doi: 10.1093/emboj/cdg448. [DOI] [PMC free article] [PubMed] [Google Scholar]
- Mohamed AJ, Yu L, Backesjo CM, Vargas L, Faryal R, Aints A, Christensson B, Berglof A, Vihinen M, Nore BF, et al. Bruton’s tyrosine kinase (Btk): function, regulation, and transformation with special emphasis on the PH domain. Immunol Rev. 2009;228:58–73. doi: 10.1111/j.1600-065X.2008.00741.x. [DOI] [PubMed] [Google Scholar]
- Nagar B, Hantschel O, Young MA, Scheffzek K, Veach D, Bornmann W, Clarkson B, Superti-Furga G, Kuriyan J. Structural basis for the autoinhibition of c-Abl tyrosine kinase. Cell. 2003;112:859–871. doi: 10.1016/s0092-8674(03)00194-6. [DOI] [PubMed] [Google Scholar]
- Ogawa A, Takayama Y, Sakai H, Chong KT, Takeuchi S, Nakagawa A, Nada S, Okada M, Tsukihara T. Structure of the carboxyl-terminal Src kinase, Csk. J Biol Chem. 2002;277:14351–14354. doi: 10.1074/jbc.C200086200. [DOI] [PubMed] [Google Scholar]
- Park H, Wahl MI, Afar DE, Turck CW, Rawlings DJ, Tam C, Scharenberg AM, Kinet JP, Witte ON. Regulation of Btk function by a major autophosphorylation site within the SH3 domain. Immunity. 1996;4:515–525. doi: 10.1016/s1074-7613(00)80417-3. [DOI] [PubMed] [Google Scholar]
- Rawlings DJ, Scharenberg AM, Park H, Wahl MI, Lin S, Kato RM, Fluckiger AC, Witte ON, Kinet JP. Activation of BTK by a phosphorylation mechanism initiated by SRC family kinases. Science. 1996;271:822–825. doi: 10.1126/science.271.5250.822. [DOI] [PubMed] [Google Scholar]
- Rawlings DJ, Witte ON. The Btk subfamily of cytoplasmic tyrosine kinases: structure, regulation and function. Semin Immunol. 1995;7:237–246. doi: 10.1006/smim.1995.0028. [DOI] [PubMed] [Google Scholar]
- Saito K, Scharenberg AM, Kinet JP. Interaction between the Btk PH domain and phosphatidylinositol-3,4,5-trisphosphate directly regulates Btk. J Biol Chem. 2001;276:16201–16206. doi: 10.1074/jbc.M100873200. [DOI] [PubMed] [Google Scholar]
- Sicheri F, Moarefi I, Kuriyan J. Crystal structure of the Src family tyrosine kinase Hck. Nature. 1997;385:602–609. doi: 10.1038/385602a0. [DOI] [PubMed] [Google Scholar]
- Smith CI. From identification of the BTK kinase to effective management of leukemia. Oncogene. 2017;36:2045–2053. doi: 10.1038/onc.2016.343. [DOI] [PMC free article] [PubMed] [Google Scholar]
- Steichen JM, Kuchinskas M, Keshwani MM, Yang J, Adams JA, Taylor SS. Structural basis for the regulation of protein kinase A by activation loop phosphorylation. J Biol Chem. 2012;287:14672–14680. doi: 10.1074/jbc.M111.335091. [DOI] [PMC free article] [PubMed] [Google Scholar]
- Tzeng SR, Pai MT, Lung FD, Wu CW, Roller PP, Lei B, Wei CJ, Tu SC, Chen SH, Soong WJ, et al. Stability and peptide binding specificity of Btk SH2 domain: molecular basis for X-linked agammaglobulinemia. Protein Sci. 2000;9:2377–2385. doi: 10.1110/ps.9.12.2377. [DOI] [PMC free article] [PubMed] [Google Scholar]
- Vihinen M, Belohradsky BH, Haire RN, Holinski-Feder E, Kwan SP, Lappalainen I, Lehvaslaiho H, Lester T, Meindl A, Ochs HD, et al. BTKbase, mutation database for X-linked agammaglobulinemia (XLA) Nucleic Acids Res. 1997;25:166–171. doi: 10.1093/nar/25.1.166. [DOI] [PMC free article] [PubMed] [Google Scholar]
- Wang Q, Vogan EM, Nocka LM, Rosen CE, Zorn JA, Harrison SC, Kuriyan J. Autoinhibition of Bruton’s tyrosine kinase (Btk) and activation by soluble inositol hexakisphosphate. Elife. 2015;4 doi: 10.7554/eLife.06074. [DOI] [PMC free article] [PubMed] [Google Scholar]
- Xu W, Harrison SC, Eck MJ. Three-dimensional structure of the tyrosine kinase c-Src. Nature. 1997;385:595–602. doi: 10.1038/385595a0. [DOI] [PubMed] [Google Scholar]
Associated Data
This section collects any data citations, data availability statements, or supplementary materials included in this article.
Supplementary Materials
Document S1. Fig. S1–S4 and Table S1.
Data S1, related to Fig. 2, 5, 6, 7 and 8. HDX results attached as a multi-tabbed excel workbook. Tabs 1–8 are raw deuterium incorporation data for individual HDX experiments with BTK constructs studied here. Tab 9 shows all difference in deuterium incorporation data for all possible comparisons with BTK constructs that are calculated from tabs 1–8. Tabs 10–21 are the raw difference HDX data for all figures in the text (each tab name identifies the figure number).