

Abstract
Objective
Cognitive impairment is frequent in Parkinson's disease, but the underlying mechanisms are insufficiently understood. Because cortical metabolism is reduced in Parkinson's disease and closely associated with cognitive impairment, and CSF amyloid‐β species are reduced and correlate with neuropsychological performance in Parkinson's disease, and amyloid‐β release to interstitial fluid may be related to synaptic activity; we hypothesize that synapse dysfunction links cortical hypometabolism, reduced CSF amyloid‐β, and presynaptic deposits of α‐synuclein. We expect a correlation between hypometabolism, CSF amyloid‐β, and the synapse related‐markers CSF neurogranin and α‐synuclein.
Methods
Thirty patients with mild‐to‐moderate Parkinson's disease and 26 healthy controls underwent a clinical assessment, lumbar puncture, MRI, 18F‐fludeoxyglucose‐PET, and a neuropsychological test battery (repeated for the patients after 2 years).
Results
All subjects had CSF amyloid‐β 1‐42 within normal range. In Parkinson's disease, we found strong significant correlations between cortical glucose metabolism, CSF Aβ, α‐synuclein, and neurogranin. All PET CSF biomarker‐based cortical clusters correlated strongly with cognitive parameters. CSF neurogranin levels were significantly lower in mild‐to‐moderate Parkinson's disease compared to controls, correlated with amyloid‐β and α‐synuclein, and with motor stage. There was little change in cognition after 2 years, but the cognitive tests that were significantly different, were also significantly associated with cortical metabolism. No such correlations were found in the control group.
Interpretation
CSF Aβ, α‐synuclein, and neurogranin concentrations are related to cortical metabolism and cognitive decline. Synaptic dysfunction due to Aβ and α‐synuclein dysmetabolism may be central in the evolution of cognitive impairment in Parkinson's disease.
Introduction
Cognitive impairment is an important nonmotor symptom of Parkinson's disease (PD).1 Mean duration from clinical disease onset to dementia is 10 years, but cognitive impairment has been demonstrated already at the time of diagnosis.2
Several factors argue for early involvement of synaptic pathology in PD. Many of the proteins relevant in PD pathophysiology are involved in synaptic physiology (reviewed in3). α‐synuclein is considered the core pathological substrate of PD, and in addition to accumulation in Lewy bodies, a major deposition site of CNS oligomeric α‐synuclein is the presynapse, accompanied by transsynaptic dendritic spine loss.4, 5 The presynaptic terminal is the main site of function for both amyloid precursor protein (APP) and α‐synuclein. α‐synuclein is linked to synaptic‐vesicle complex formation and APP to synaptic‐vesicle docking and priming. Neurogranin, a substrate of protein kinase C, is abundantly expressed, and located preferentially at the postsynaptic dendritic spine plasma membrane.6
Intracellular metabolism of these proteins is performed by overlapping sets of enzymes and subcellular compartments.7, 8, 9, 10 Presynaptic activity and endocytosis influence release of amyloid‐β (Aβ) species to the interstitial fluid.11 APP is initially cleaved at the presynaptic terminal to several biologically active metabolites, including Aβ 1‐38 (Aβ38), Aβ 1‐40 (Aβ40), and Aβ 1‐42 (Aβ42), the latter particularly prone to brain parenchymal deposition.12, 13
Most studies of CSF Aβ species in PD have reported slight reductions.14, 15 We and others have found a correlation between CSF Aβ42 levels and memory performance in PD,15, 16 also in subjects with normal CSF Aβ42 levels (thus without evidence for amyloid plaques).15, 17 These changes relate to hippocampus subfield volumes18; experimental studies show detrimental preplaque Aβ effects on synaptic function,19 and human Aβ turnover decreases from approximately 40 years of age,20 suggesting preplaque effects of Aβ on cognition and synaptic physiology.
MRI studies show that slight gray matter atrophy is involved in PD cognitive decline.21 Studies combining neuroimaging and CSF in PD are scarce, but CSF Aβ correlate with reduced gray matter volume and associated neuropsychological function.22, 23 FDG‐PET studies have identified a widespread, specific pattern of reduced glucose metabolism in PD,24 most prominent in the frontoparietal and occipital cortices, even in the early stages of the disease.25 Cerebral glucose metabolism reflects cortical activation and synaptic density.26 Several studies associate this hypometabolism with cognitive impairment, suggesting that hypometabolism in PD primarily reflects cognitive deterioration.27, 28 Though a very recent postmortem study suggests that loss of synaptic markers predicts cognitive decline in Lewy body diseases,29 to the best of our knowledge, no direct links have been established between reduced glucose metabolism in PD and independent synaptic markers.
Because (1) cortical glucose metabolism is reduced and correlates with cognitive impairment in PD, and (2) CSF Aβ species are decreased and correlate with neuropsychological performance, and amyloid‐β release to interstitial fluid may be related to synaptic activity; we hypothesize that synapse dysfunction is a common link between cortical hypometabolism, CSF amyloid‐β concentrations, and presynaptic deposits of α‐synuclein. We thus expect to find a correlation between levels of CSF Aβ species and relative glucose metabolism, and also to possible markers of synaptic dysfunction or loss, such as CSF α‐synuclein and neurogranin.
Materials and Methods
Subjects
This study is based on an ongoing longitudinal follow‐up of patients in a university hospital‐based neurological clinic. Thirty nondemented patients with mild‐to‐moderate stage PD were recruited between 2011 and 2014 and examined by a neurologist with extensive experience in movement disorders, as previously described.15
The patient group and inclusion criteria in this study is the same (aside from one subject excluded due to missing FDG‐PET) as the one described in ref 15. In short, inclusion criteria were diagnosis of PD according to the UK Parkinson's Disease Society Brain Bank clinical diagnostic criteria,30 Hoehn and Yahr stage <3, and disease duration <6 years. All PD subjects had a pathological dopamine transporter single photon emission computed tomography (DaT‐SPECT). Exclusion criteria were dementia (see below for procedure) and other somatic or psychiatric diseases that might contribute to cognitive impairment. The Unified Parkinson's Disease Rating Scale (UPDRS), part III motor examination and Hoehn & Yahr staging were performed. Patients had their medication as usual when assessed. Total daily levodopa equivalent dose was calculated. All PD subjects underwent cognitive assessment employing a well‐validated neuropsychological test battery thoroughly described previously.15, 31 The battery covers memory: Delayed verbal recall (Rey Auditory Verbal Learning Test (RAVLT)),32 and Delayed visual reproduction (Rey Complex Figure Test (RCFT)), (Meyers & Meyers, 1995) and aspects of executive functions: Psychomotor speed (Trail Making Test‐A (TMT‐A)), Divided attention (Trail Making Test‐B (TMT‐B)) (Reitan & Wolfson 1985), Word fluency (Controlled Oral Word Association Test (COWAT)) (Benton & Hamsher 1989), and Response inhibition (Stroop Color‐Word, D‐KEFS) (Delis et al., 2001). All examinations were conducted within a 3‐month period, and repeated after 2 years for the PD subjects.
In addition to PD patients, a healthy control group was included. Healthy controls were recruited from spouses of included patients (three subjects), and the remaining controls were recruited before lumbar puncture in conjunction with orthopedic surgery. Twenty‐six subjects assented and successfully underwent MRI and FDG‐PET. Exclusion criteria were as for PD, in addition to relevant subjective cognitive memory symptoms.
All subjects gave their written consent, and the Regional Committee for Medical and Health Research Ethics South‐East evaluated (based on the Norwegian Health and Research Act and the Helsinki Declaration of 1964; revised 2013) and approved the study. All further study conduct was based on and in line with these guidelines.
CSF analysis
CSF samples were collected from all participants by lumbar puncture, performed between 9 and 12 am, and consecutively after inclusion. Following lumbar puncture and standardized handling, CSF Aβ42 > 700 ng/L were considered normal.
CSF Aβ38, Aβ40, and total α‐synuclein were analyzed with electrochemiluminescence immunoassays (Meso Scale Discovery, US) in all PD patients. Due to possible effects of hemolysis, total α‐synuclein were only included if CSF hemoglobin was <350 ng/mL. α‐synuclein values for five patients were thus excluded.
CSF neurogranin concentration was measured using a previously described in‐house ELISA.6 Briefly, an assay based on the monoclonal antibody Ng7 (epitope including amino acids 52–65 on neurogranin) was used for capture, a polyclonal neurogranin anti‐rabbit antibody (ab23570; Upstate Biotechnology, Lake Placid, NY, USA) for detection, and full‐length neurogranin protein as calibrator. We were able to measure neurogranin concentrations in all included PD patients. For 19 of the 26 included controls there was sufficient CSF available to assess neurogranin concentrations, and we added an additional 11 controls for which there was no available PET data. (The neurogranin healthy control material, N = 30, mean age 61.5 [range: 40–78; SD: 9.34], 18 females.)
FDG‐PET and MRI imaging
FDG‐PET/CT imaging was performed with a Siemens Biograph 64 PET/CT scanner for the PD group, and a Siemens Biograph 16 PET/CT scanner for the healthy control group. All subjects fasted at least 4 h before image acquisition, and had an intravenous bolus of 218 MBq (±23 MBq) injected, 45 min prior to scanning. A low‐dose CT scan for attenuation correction was acquired. Patients were scanned for 15 min in three‐dimensional mode using one bed position (axial range = 16 cm). Acquired data were corrected for random events, dead time, attenuation (CT‐derived μ‐map), scatter (model based), and decay. PET volumes were reconstructed using an iterative algorithm (OSEM 2D, four iterations, eight subsets), and a postreconstruction three‐dimensional Gaussian filter of width 3.5 mm full‐width at half maximum was applied. The axial image format was 256 × 256 (pixel size: 2.67 mm × 2.67 mm), with a slice thickness of 2.00 mm. Blood glucose at FDG injection time was measured routinely, and the patient was excluded if blood glucose exceeded 8.0 mmol/L.
For both PD and control subjects, MRI scans were acquired on a Philips Achieva 3 Tesla system. A single three‐dimensional turbo field echo (TFE) sequence was acquired for morphometrics. Cortical reconstruction and volumetric segmentation was performed with FreeSurfer.33, 34 The exact sequence parameters and reconstruction methods are described elsewhere.35
Whole head PET volumes were coregistered with the anatomical volume using a rigid body spatial registration as implemented in the Spatial Parametrical Mapping (SPM 8, Wellcome Trust Centre for Neuroimaging, UCL, UK) co‐registration tool. PET volumes were resliced into 1 mm MRI. For each subject, a voxel‐based intensity normalization to the mean uptake in the cerebellar white matter was performed. (Prior to intensity normalization, the cerebellar white matter mask was eroded to avoid influence due to partial volume effects, inaccurate segmentation, or coregistration). Intensity normalized volumes were used for all further analyses. Because there is both global cerebral and cerebellar cortical hypometabolism in PD, neither global cortical mean nor cerebellar cortical normalization were suitable. We therefore chose to normalize the FDG‐PET uptakes against mean cerebellar white matter.25
Statistical analysis
Statistical maps were generated using the general linear model as implemented in FreeSurfer. Auxiliary statistical analyses were performed using IBM SPSS version 22 (Chicago, IL). Statistical maps of correlations (while correcting for effects of age and gender) between normalized FDG‐PET uptake (or cortical thickness) and each CSF biomarker concentration were created. This operation was performed separately in the PD and control groups. Also, similar statistical maps of correlations between cortical thickness and CSF biomarker concentrations were created. These statistical operations on global data and surface maps were generated by computing a general linear model of the effects of CSF biomarker concentrations on FDG uptake (or cortical thickness) at each vertex, while controlling for effects of age and gender. A cluster‐wise correction for multiple comparisons was employed, based on ref 36. A cluster‐forming threshold of P < 0.01 was chosen, and only clusters with a cluster‐wise P < 0.01 (Bonferroni corrected for examining both hemispheres) were kept.
The coefficient of determination, R 2 was determined for the relation between CSF biomarkers (separately) and FDG uptake or cortical thickness (in pertinent areas as determined above). The effects of age and sex were regressed out of mean FDG uptake or cortical thickness, and the resulting residual was entered in a simple regression model as dependent variables, with the CSF biomarker concentration as explanatory variable.
To assess the relationship with cognitive function, mean FDG uptake (corrected for age and sex) in the pertinent areas as determined above for each CSF biomarker was also correlated (Spearman) with T‐scores of neuropsychologic tests.
According to examination of histograms and as assessed by the Kolmogorov–Smirnov test of normality, CSF neurogranin concentrations were not normally distributed in neither the PD nor the control group. We therefore assessed group differences using Mann–Whitney U. There were no significant correlations (Spearman's rho) between CSF neurogranin concentrations and age or sex (neither within the PD group nor within the control group). We did therefore not correct for age or sex when comparing the groups. One outlier in the PD group with values 10–20 times the mean in the group, was removed, but included in additional analyses for reference.
Within the PD group, the distribution of CSF neurogranin, Aβ38, 40, and 42 concentrations as well as UPDRS scores were borderline normally distributed according to examination of histograms and as assessed by the Kolmogorov–Smirnov test of normality. We therefore chose to assess the correlation between these variables with Spearman correlations. (The estimations of these correlations were repeated with parametric Pearson correlations with very similar results, data not shown.)
Two‐year follow‐up cognitive data were available for the PD subjects. To assess the association between cognition, time, and FDG‐PET clusters as determined above, a mixed models approach was used: each of the examined neuropsychological variables were entered as dependent variables accounting for repeated measures (in separate models) with age, the FDG‐PET cluster corresponding to CSF Aβ42, and also an interaction between time and the FDG‐PET cluster (to model the association between FDG‐PET and change over time) as independent variables. A priori, the FDG‐PET cluster corresponding to CSF Aβ42 was chosen for this analysis because it is one of the larger, representative clusters and the well‐documented role of Aβ42 in synaptic pathology.
Results
Demographical, CSF, and neuropsychological characteristics of the groups
There were no significant differences in age, gender composition, education, or MMSE between the PD and the healthy control group. Neuropsychological function was in the normal range for both groups, except slightly below normal on a measure of divided attention in the PD group. Group composition and demographics are outlined in Table 1 and neuropsychological characteristics in Table 2.
Table 1.
Overview of demographics and group characteristics
| Parkinson's disease | Healthy controls | |
|---|---|---|
| N subjects | 30 | 26 |
| Age | 65.0 (47–74) years | 65.0 (47–81)a |
| Females/males | 11/19 | 13/13b |
| Education | 13.0 (8–19) years | 12.6 (8–20)c |
| MMSE | 28.6 (22–30) | 28.7 (26–30)d |
| Geriatric depression scale score | 1.3 (0–6) | 1.4 (0–6)e |
| Duration from motor symptom onset | 2.6 (1–6) years | n.a. |
| UPDRS part III motor score | 15.4 (6–31) | n.a. |
| Hoehn and Yahr stage | 1.55 (1–2.5) | n.a. |
| Total daily levodopa equivalent dose | 390.0 (0–924) | n.a. |
| CSF Aβ38; ng/L | 1877 (819–4551) | n.a. |
| CSF Aβ40; ng/L | 5125 (2212–10512) | n.a. |
| CSF Aβ42; ng/L | 943 (707–1280) | 987 (634–1290)f |
| CSF total α‐synuclein; ng/L | 278 (160–476)g | n.a. |
| CSF neurogranin; ng/L | 251 (125–556)h | 397 (119–988)i , j |
Entries are mean (range) unless otherwise stated. Bold entries are significantly different from Parkinson's disease.
Aβ, amyloid‐β; Aβ38, amyloid‐β 1‐38; Aβ40, amyloid‐β 1‐40; Aβ42, amyloid‐β 1‐42; MMSE, Mini‐Mental State Examination; n.a., not available; UPDRS, Unified Parkinson's Disease Rating Scale.
Age: Parkinson's disease versus Controls: T‐test P = 0.989.
Gender: Between‐group gender composition differences; Pearson chi‐square, P = 0.315.
Education: Parkinson's disease versus Controls: Mann–Whitney U = 349, P = 0.498.
MMSE: Parkinson's disease versus. Controls: Mann–Whitney U = 380, P = 0.864.
Geriatric depression scale: Parkinson's disease versus Controls: Mann–Whitney U = 357.5, P = 0.757.
Aβ42: Parkinson's disease versus Controls: Mann–Whitney U = 329, P = 0.312.
N = 25. Missing for five subjects with Parkinson's disease.
Neurogranin: One outlier in the Parkinson's disease group excluded, see methods section.
N = 30 for Controls, see methods section.
Parkinson's disease versus Controls: Mann–Whitney U = 211, P = 0.001.
Table 2.
Neuropsychological characteristics of the groups
| Neuropsychological test battery | Parkinson's disease | Healthy controls | |
|---|---|---|---|
| Baseline | Follow‐up | ||
| N subjects (missing neuropsychological data) | 28 (2) | 29 (1) | 26 (0) |
| RAVLT delayed verbal recall of 15 words after 30 min, T‐score | 50.4 (31–75) | 53.0 (25–71) | 47.3 (32–67)a |
| RCFT delayed visual reproduction after 30 min, T–score | 46.5 (20–75) | 60.1 (22–80) | n.a. |
| TMT–A psychomotor speed, T‐score | 41.0 (26–62) | 47.5 (32–62) | n.a. |
| TMT‐B divided attention, T‐score | 39.9 (10–59) | 47.0 (27–66) | 50.2 (28–65)b |
| SCW response inhibition, T–score | 50.7 (27–67) | 50.7 (20–70) | 49.0 (20–63)c |
| COWAT verbal fluency, T–score | 48.1 (33–69) | 52.0 (32–73) | 48.7 (25–69)d |
Entries are mean (range) unless otherwise stated. Bold entries are significantly different from Parkinson's disease at baseline.
Aβ, amyloid‐β; COWAT, Controlled Oral Word Association Test; RAVLT, Rey Auditory Verbal Learning Test; RCFT, Rey Complex Figure Test; SCW, Stroop Color‐Word; TMT‐A, Trail Making Test‐A; TMT‐B, Trail Making Test‐B.
RAVLT delayed verbal recall: Parkinson's disease versus Controls: Mann–Whitney U = 297, P = 0.24.
TMT‐B divided attention (available for 25 controls): Parkinson's disease versus. Controls: Mann–Whitney U = 207.5, P = 0.011.
SCW response inhibition: Parkinson's disease versus Controls: Mann–Whitney U = 345.5, P = 0.936.
COWAT verbal fluency (available for 25 controls): Parkinson's disease versus Controls: Mann–Whitney U = 331.5, P = 0.728.
Relationship between the CSF biomarkers
CSF neurogranin concentration was significantly lower in the PD group as compared to the control group (Mann–Whitney U = 211, P = 0.001). (Not excluding the outlier, the difference was still significant (Mann–Whitney U = 150, P = 0.006).) (Fig. 1).
Figure 1.
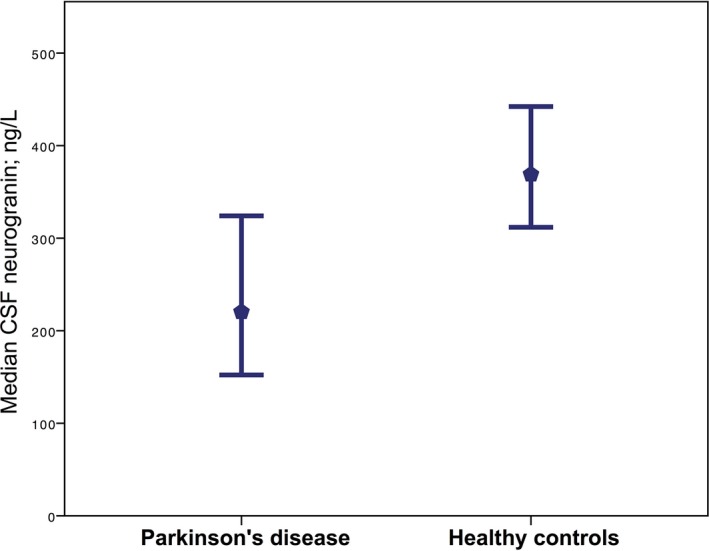
Median CSF neurogranin concentrations. The median concentration of CSF neurogranin in patients with mild‐to‐moderate Parkinson's disease and healthy controls, error bars represent 95% confidence intervals. (Mean CSF neurogranin in the Parkinson's disease subjects was 251 (range: 125–556), and in healthy controls, 397 (range: 119–988).)
There were no significant correlations between CSF neurogranin concentration and age or sex in either of the diagnostic groups (in the PD group, respectively, ρ = 0.192; P = 0.319, ρ = −0.260; P = 0.173, in the control group, respectively, ρ = −0.224; P = 0.235, ρ = 0.283, P = 0.130). There was a significant correlation between α‐synuclein and age (ρ = 0.533, P = 0.006) in the PD group.
CSF neurogranin concentrations were significantly correlated with the concentrations of CSF Aβ38 (ρ = 0.694; P < 0.001), Aβ40 (ρ = 0.653; P < .001), Aβ42 (ρ = 0.434; P = 0.019), and α‐synuclein (ρ = 0.759; P ≤ 0.001). CSF neurogranin concentrations were significantly inversely correlated with UPDRS score (ρ = −0.369; P = 0.039), as was α‐synuclein (ρ = −0.483, P = 0.020). There were no significant correlations between UPDRS scores and concentrations of CSF Aβ38, 40, or 42.
FDG‐PET and Aβ in patients with PD
There was a significant correlation between CSF Aβ42 concentrations and FDG‐PET uptake in PD; lower CSF Aβ42 concentrations were found with more severe reductions on FDG‐PET. The statistical map (Fig. 2) shows decreased cortical metabolism in mainly parietal, frontal, and occipital areas. For both hemispheres, there was one frontal and one posterior (comprising parietal, occipital, and some temporal vertices) cluster. There were no correlations between CSF Aβ42 concentrations and cortical thickness in PD.
Figure 2.
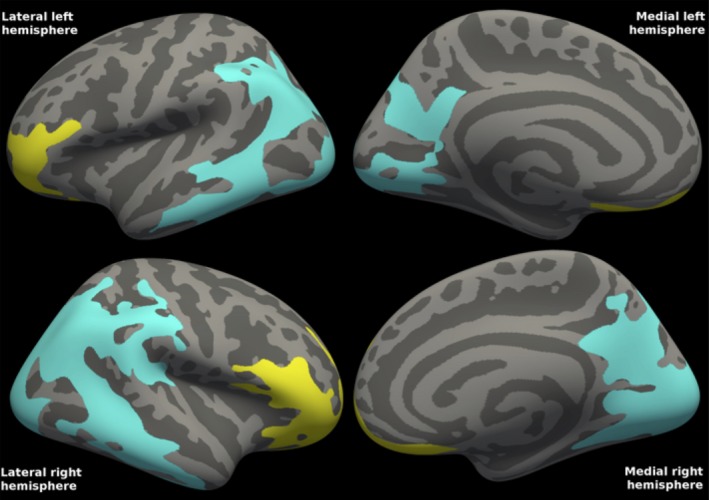
Correlations between FDG‐PET and CSF Aβ42 in Parkinson's disease. The statistical map shows two clusters in each hemisphere, one frontal (yellow) and one posterior (turquoise) cluster, in which cortical metabolism in mild‐to‐moderate Parkinson's disease is correlated with CSF Aβ42 concentrations. Mean CSF Aβ42 was 943 ng/L (range 707–1280). Cluster‐wise P = 0.0001 for all clusters. The clusters comprised 36% of the total surface area (27% of the left and 45% of the right hemisphere surface area). R 2 was 0.389 in the left and 0.433 in the right combined hemisphere clusters (excluding the effects of age and gender).
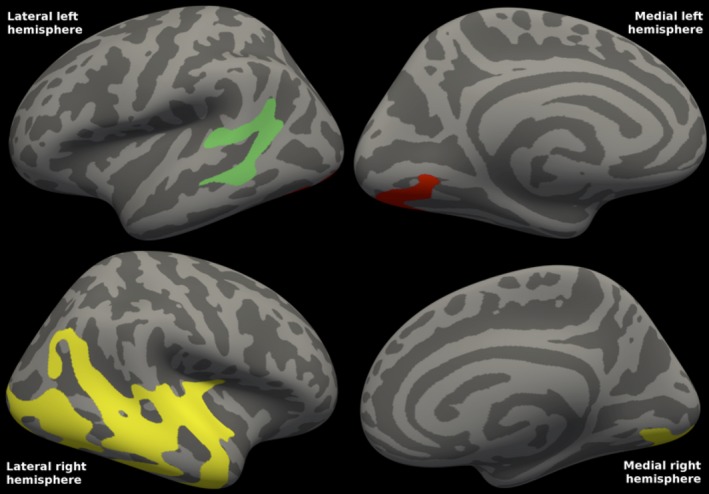
In addition, there was a positive correlation between CSF Aβ38 concentrations and FDG‐PET uptake in PD. The statistical map (Fig. 3) shows the widespread clusters, most notably posterior lateral areas in which cortical metabolism correlated with CSF Aβ38 concentrations.
Figure 3.
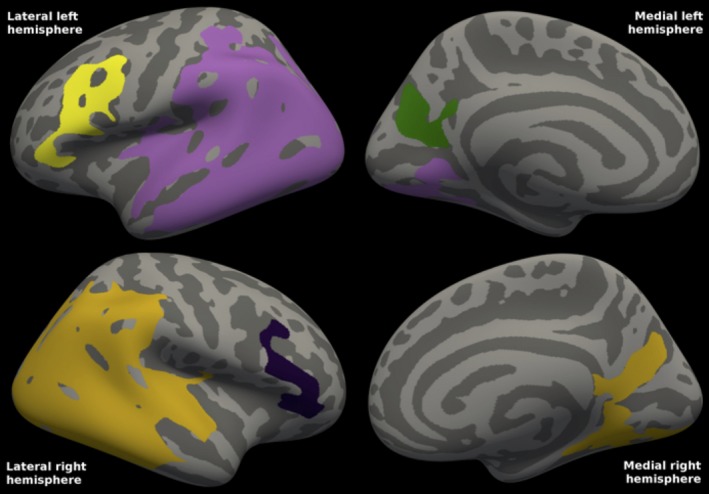
Correlations between FDG‐PET and CSF Aβ38 in Parkinson's disease. The statistical map shows the three clusters in the left hemisphere and the two clusters in the right hemisphere in which cortical metabolism in mild‐to‐moderate Parkinson's disease is positively correlated with CSF Aβ38 concentrations. For the left hemisphere, cluster‐wise P = 0.0001 for the two mainly lateral clusters, whereas for the mainly medial (precuneal; green) cluster, cluster‐wise P = 0.0074. For the right hemisphere, cluster‐wise P = 0.0001 for the larger, posterior cluster, whereas cluster‐wise P = 0.00170 for the frontal. The clusters comprised 36% of the total surface area (38% of the left hemisphere surface area, and 33% of the right). R 2 was 0.319 in the left and 0.304 in the right combined hemisphere clusters (excluding the effects of age and gender). Mean CSF Aβ38 was 1877 ng/L (range: 819–4551).
There were also slight correlations between CSF Aβ40 concentrations and FDG‐PET uptake in PD. The statistical map (Fig. 4) shows small posterior lateral clusters in both hemispheres in which cortical metabolism correlated with CSF Aβ40 concentrations.
Figure 4.
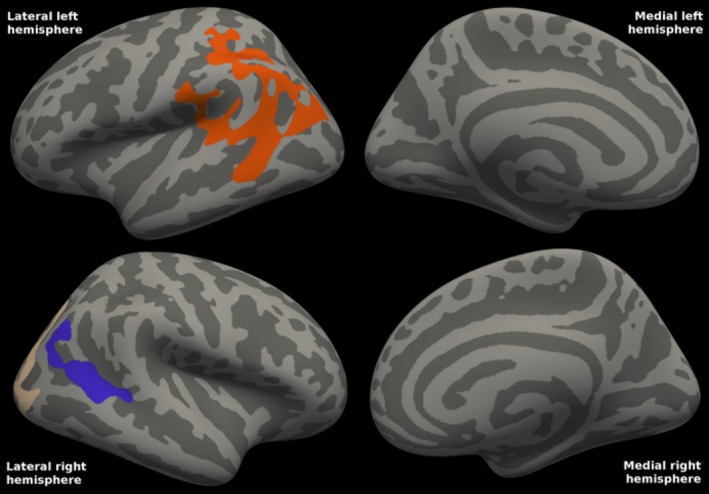
Correlations between FDG‐PET and CSF Aβ40 in Parkinson's disease. The statistical map shows one cluster in the left hemisphere and two clusters in the right hemisphere in which cortical metabolism in mild‐to‐moderate Parkinson's disease is positively correlated with CSF Aβ40 concentrations. For the left hemisphere cluster and the right hemisphere occipital cluster, cluster‐wise P = 0.0001. For the right hemisphere parietal cluster (shown in blue), cluster‐wise P = 0.0061. The clusters comprised 6% of the total surface area (8% of the left hemisphere surface area, and 5% of the right). R 2 was 0.277 in the left and 0.250 in the right combined hemisphere clusters (excluding the effects of age and gender). Mean CSF Aβ40 was 5125 ng/L (range: 2212–10512).
FDG‐PET and Aβ in healthy controls
There were no correlations between CSF Aβ42 concentrations and cortical FDG‐PET uptake in the control group. (Not corrected for multiple comparisons, still no voxels reached the P < 0.01 threshold). Further, there were no correlations between CSF Aβ42 concentrations and cortical thickness in the control group. (Not corrected for multiple comparisons, with the threshold set at P < 0.01 some small, distributed areas were detected.)
FDG‐PET and α‐synuclein in patients with PD
There was a significant correlation between CSF total α‐synuclein concentrations and FDG‐PET uptake in PD; lower CSF total α‐synuclein concentrations were found with more severe reductions on FDG‐PET. The statistical map (Fig. 5) shows decreased cortical metabolism in several cortical clusters. Cluster‐wise P = 0.0002 for the more frontal left clusters and the lateral right clusters, and P = 0.021 for the remaining left, and P = 0.028 for the remaining right cluster.
Figure 5.
Correlations between FDG‐PET and CSF total α‐synuclein in Parkinson's disease. The statistical map shows the clusters in each hemisphere in which cortical metabolism in mild‐to‐moderate Parkinson's disease is correlated with CSF t‐α‐syn concentrations. Mean CSF t‐α‐syn was 278 (range: 160–476). Cluster‐wise P = 0.0002 for the more frontal left clusters and the lateral right clusters, and P = 0.021 for the remaining left, and P = 0.028 for the remaining right cluster. The clusters comprised 13% of the total surface area (8% of the left and 19% of the right surface area). R 2 was 0.337 in the left and 0.339 in the right combined hemisphere clusters (excluding the effects of age and gender).
There were no correlations between CSF total α‐synuclein concentrations and cortical thickness in PD.
FDG‐PET and neurogranin in patients with PD
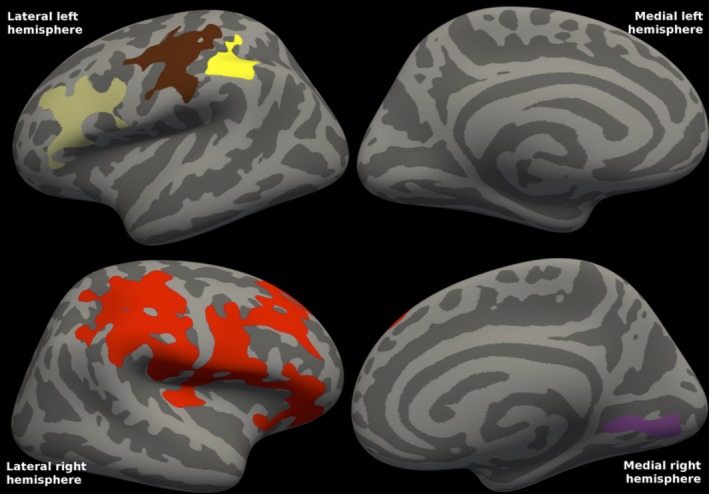
There was a significant correlation between CSF neurogranin concentrations and FDG‐PET uptake in PD; lower CSF neurogranin concentrations were found with more severe reductions on FDG‐PET. The statistical map (Fig. 6) shows decreased cortical metabolism in several cortical clusters. Cluster‐wise P = 0.008 for the lateral left and P = 0.002 for the medial left cluster, whereas P = 0.0002 for the single, larger right cluster.
Figure 6.
Correlations between FDG‐PET and CSF neurogranin in Parkinson's disease. The statistical map shows the clusters in each hemisphere in which cortical metabolism in mild‐to‐moderate Parkinson's disease is correlated with CSF neurogranin concentrations. Mean CSF neurogranin was 251 (range: 125–556). Cluster‐wise P = 0.008 for the lateral left and P = 0.002 for medial left cluster, whereas P = 0.0002 for the single, large right cluster. The clusters comprised 10.5% of the total surface area (4% of the left and 16% of the right surface area). R 2 was 0.330 in the left and 0.346 in the right combined hemisphere clusters (excluding the effects of age and gender).
There was a significant correlation between CSF neurogranin concentrations and cortical thickness in PD. (Not shown). There were five small clusters, cluster‐wise P = 0.001 for a frontal left and P = 0.002 for a parietal left cluster, whereas P = 0.042 for a parietal right, and P = 0.021 for a frontal, medial right cluster. Also, there was a right inferior temporal cluster, P = 0.002. The clusters comprised 3% of the left and 3% of the right hemisphere. R 2 was 0.655 in the left and 0.630 in the right combined hemisphere clusters.
Relationship between FDG‐PET clusters and cognition in patients with Parkinson's disease
For the cortical areas in which glucose metabolism was correlated with either CSF Aβ38, Aβ40, Aβ42, total α‐synuclein, or neurogranin, there were strong correlations between mean FDG uptake and most tests in the neuropsychological test battery, including measures of executive function (word fluency, response inhibition) and verbal and visual recall (Table 3). P‐values for COWAT verbal fluency, SCW response inhibition, RAVLT delayed verbal recall, and RCFT delayed visual reproduction correlations with FDG‐PET CSF‐based clusters were all <0.01. Correlations to TMT‐B divided attention were not significant.
Table 3.
Correlations between cognition and mean FDG‐PET in cortical clusters related to CSF biomarkers in Parkinson's disease
| Neuropsychological test battery | FDG‐PET CSF biomarker‐based cortical clusters | ||||
|---|---|---|---|---|---|
| Aβ42a | Aβ38a | Aβ40a | α‐synucleinb | Neurograninc | |
| RAVLT delayed verbal recall of 15 words after 30 min, T‐score | 0.566 (0.001) | 0.615 (<0.001) | 0.651 (<0.001) | 0.561 (0.004) | 0.616 (<0.001) |
| RCFT delayed visual reproduction after 30 min, T‐score | 0.608 (<0.001) | 0.655 (<0.001) | 0.667 (<0.001) | 0.551 (0.005) | 0.605 (0.001) |
| TMT‐A divided attention, T‐score | 0.650 (<0.001) | 0.602 (<0.001) | 0.607 (<0.001) | 0.727 (<0.001) | 0.504 (0.005) |
| TMT‐B divided attention, T‐score | 0.277 (0.145) | 0.248 (0.195) | 0.283 (0.136) | 0.249 (0.252) | 0.184 (0.350) |
| SCW response inhibition, T‐score | 0.617 (<0.001) | 0.613 (<0.001) | 0.621 (<0.001) | 0.549 (0.005) | 0.585 (0.001) |
| COWAT verbal fluency, T‐score | 0.499 (0.006) | 0.499 (0.006) | 0.539 (0.003) | 0.653 (0.001) | 0.488 (0.008) |
Entries are Spearman's rho Correlation Coefficient (P‐value). Bold entries are significant.
Aβ, amyloid‐β; COWAT, Controlled Oral Word Association Test; RAVLT, Rey Auditory Verbal Learning Test; RCFT, Rey Complex Figure Test; SCW, Stroop Color‐Word; TMT‐B, Trail Making Test‐B. 1‐3Names refer to the clusters significantly correlated with that CSF biomarker.
N = 30 for RAVLT, RCFT, and SCW. N = 29 for TMT‐B, COWAT, WAIS‐III.
N = 24 for RAVLT, RCFT, SCW, and COWAT. N = 23 for TMT‐B and WAIS‐III.
N = 29 for RAVLT, RCFT, and SCW. N = 28 for TMT‐B, COWAT, and WAIS‐III.
Relationship between FDG‐PET clusters, cognition, and cognitive decline in patients with Parkinson's disease
For the cortical areas in which glucose metabolism was correlated with CSF Aβ42, there were strong correlations (P ≤ 0.002) between mean FDG uptake and all tests in the neuropsychological test battery at baseline (as assessed by the mixed model approach described above). Only TMT‐A (F = 5.684, P = 0.27) and COWAT verbal fluency (F = 4.431, P = 0.48) were significantly changed from baseline to follow‐up, and for these tests, FDG‐PET cluster uptake was associated with change. (The interaction between repeated neuropsychological testing and cluster FDG‐PET uptake is a measure of this. F = 5.035, P = 0.36 for TMT‐A and F = 5.041, P = 0.36 for COWAT verbal fluency). TMT‐A performance and verbal fluency improved, and for both higher FDG‐PET uptake was associated with better performance at follow‐up.
Discussion
Combining clinical, imaging, and CSF‐proteomic techniques, this study links cortical glucose metabolism to Aβ metabolism, CSF α‐synuclein and neurogranin and cognitive impairment in PD. To the best of our knowledge, this is the first study to explore regional correlations between FDG‐PET, Aβ species, and cognition, and also relate these measures to an independent synaptic marker. The study results support our initial hypothesis, that is, that synaptic dysfunction is related to both reduced glucose metabolism and reduced levels of Aβ species, putatively related to presynaptic deposition of α‐synuclein. The highly significant associations to a wide range of cognitive functions, including memory and aspects of executive functions, demonstrate the clinical relevance of our findings. Although there was little change in cognitive performance from baseline to follow‐up in the PD on group level, performance changes were significantly associated with FDG‐PET.
We describe correlations between CSF Aβ38 and Aβ42 concentrations and FDG‐PET in parietal association, occipital and lateral frontal areas in PD even though levels of Aβ42 were within normal range for all included PD subjects. Similar associations were not found in healthy controls. Furthermore, within these same areas there were strong FDG‐PET correlations to CSF neurogranin concentrations. CSF neurogranin was also strongly correlated with concentrations of the Aβ species, and were significantly reduced compared to healthy controls at a group level. The broad cortical areas involved are mirrored by broad and highly significant cognitive associations.
As described in the introduction, the reduced FDG‐PET signal, the lowered CSF Aβ species and the reduced levels of α‐synuclein and neurogranin may all be linked to reduced synaptic activity. In AD, increased CSF neurogranin concentrations probably reflects synaptic degeneration with loss of integrity of postsynaptic spines, that results in increased CSF levels, and this is hypothesized specifically for Alzheimer's disease.37, 38 In PD, cortical presynaptic pathology has been demonstrated in the form of accumulation of α‐synuclein oligomers, accompanied by loss of dendritic spines but other postsynaptic injury was not described.5 This is consistent with our present findings of a reduced CSF neurogranin in the present PD population as compared to healthy controls. Thus, though synapses are a focus of both the Alzheimer and PD processes, the different mechanisms of attack may explain the marked differences in neurogranin levels observed in these diseases.38 The strong association observed here between CSF α‐synuclein and neurogranin is in line with such a mechanism, but other factors such as altered degradation or transport mechanisms may also be implicated. Late in the disease‐course PD cases suffer from more extensive multifactorial neurodegeneration, including amyloid pathology. The present cohort consisted of early cases (Table 1, mean disease duration 2.6 years), whereas mean disease duration in the PD cohort described in ref. 38 was 8 years. If active amyloid‐associated neurodegeneration causes the rise of CSF neurogranin in Alzheimer's disease, this may possibly explain why the latter cohort also had higher values than the present cohort. Thus, the present findings suggest that several disease markers and clinical parameters like UPDRS and cognitive function are linked to synaptic dysfunction in PD, and putatively demonstrate a clinical relevance of CSF neurogranin in PD via its correlation with the UPDRS motor scale.
Though reduced FDG‐PET uptake points to cortical involvement and the described cortical presynaptic accumulation of α‐synuclein points to a cortical focus, we cannot exclude subcortical pathology as contributing factors. The nucleus basalis of Meynert (in the basal forebrain) has widespread projecting cholinergic neurons to the entire neocortex, and is known to degenerate in PD (as well as Alzheimer's disease), leading to cortical dysfunction and predicting cognitive decline.39, 40, 41 Corticopetal dopaminergic pathways mainly project to the frontal cortex. In PD, reduced dopaminergic and cholinergic transmission has been demonstrated in a pattern coinciding well with the frontal and posterior clusters demonstrated in the present work.42 As such, the present findings in the PD group could, hypothetically, be construed as an effect of reduced dopaminergic (the frontal cluster) and reduced cholinergic transmission (the posterior cluster) in accordance with the dual syndrome hypothesis. However, here we describe very strong links between cognition, cortical glucose metabolism, and CSF Aβ species, both potentially linked to a cortical etiology. Also, neurobiological underpinnings linking Aβ and α‐synuclein physiology in the presynaptic terminal, evidence for cortical presynaptic buildup of α‐synuclein aggregates and postsynaptic spine retraction is in line with our demonstration of links to CSF neurogranin and α‐synuclein, and primary cortical etiology. Although the present findings do not primarily address mechanistic links, decades of preplaque Aβ pathology including oligomerization may well influence presynaptic α‐synuclein metabolism, and there is experimental evidence that Aβ42 may escalate production of toxic α‐synuclein oligomers – directly disrupting SNARE‐dependent vesicle function.43, 44
Although we find strong links to Aβ, a reverse causality cannot be excluded, in that synaptic dysfunction could be due to presynaptic α‐synuclein aggregates slightly reducing Aβ in proportion to the degree of α‐synuclein‐dependent neurodegeneration.5, 45 Alternatively, defective presynaptic proteolysis and lysosomal degradation could affect both Aβ and α‐synuclein metabolism.7, 8, 46 In either case, postsynaptic spines would be affected secondarily, likely leading to the observed reduced levels of neurogranin. Combined, pre‐ and postsynaptic dysfunction would result in loss of clinical and cognitive function as measured by the UPDRS and the cognitive measures. Putatively, these hypotheses could be tested or differentiated by also measuring presynaptic markers, like CSF synaptosomal‐associated protein 25 (SNAP25, a component of the trans‐SNARE complex)47 or synaptotagmin, expected to be changed if vesicle fusion is truly hampered.
There are limitations to the current work that needs to be addressed. The PET scans of the PD and control groups were acquired on two similar, but not identical scanners. However, the scan and image reconstruction parameters, and also the postprocessing procedure were identical between the scanners and all analyses were conducted within, and not between, groups. Care should nevertheless be taken when comparing the results between groups. Also, the sample size in the present work is limited, and our findings need to be reproduced in other populations (including drug naive), and although fluctuations are relatively uncommon at the present disease stage (Hoehn and Yahr stage <3, disease duration <6 years) the subjects should preferably have been tested at a standardized time in relation to medication. The sample size for the FDG‐PET analyzes with α‐synuclein and neurogranin where even smaller than for Aβ, and one might expect more widespread, significant clusters with a larger sample. Further, although FDG uptake reflects synaptic function, there exists no direct or absolute measure of synaptic function, and this should be taken into account when interpreting the present results.
All PD subjects had normal levels of CSF Aβ42, and were thus unlikely to harbor amyloid plaques. However, a presence of soluble, synaptotoxic Aβ oligomers cannot be excluded and could be an alternative explanation for the present findings related to Aβ. Measuring Aβ oligomers in the CSF of patients with PD may be a way to test this alternative explanation.
We were able to investigate the correlations between cortical metabolism and the alternative amyloid species Aβ38 and Aβ40 (considered less prone to aggregate) in the PD group, and interestingly the correlations between FDG‐PET and Aβ38 were comparable to those with Aβ42 (whereas the correlations with Aβ40 were more sparse). As described earlier,18 CSF Aβ species and α‐synuclein concentrations correlate strongly, strengthening the supposition that presynaptic α‐synuclein and Aβ metabolism may interact to produce the current findings.
On group level, the PD patients performed as well as presumptively healthy controls on neuropsychological tests except on a measure of divided attention (functions that may be affected both by impaired dopaminergic and cholinergic networks and frontoparietal hypometabolism48). The present results may have been more informative were the included PD subjects more cognitively impaired, or if the time from baseline to follow‐up was longer. However, there were strong correlations between cortical glucose metabolism and cognitive function in the PD group. Although there was sparse change in cognition at 2‐year follow‐up, cortical metabolism was significantly associated with this change. We hypothesize that baseline cortical glucose metabolism will predict further cognitive change and predict time from disease onset to dementia.
Herein, we describe a correlation between cortical glucose metabolism, cognitive functions, cognitive change, CSF Aβ species, neurogranin, and α‐synuclein in PD. The findings were robust even though CSF Aβ42 was within normal levels for all included subjects with PD, suggesting that cortical synaptic function is related to cognitive functioning, and is affected in PD. If confirmed, the present results will have important implications for understanding the role of synaptic dysfunction, Aβ and α‐synuclein in the evolution of PD. We further find lower CSF concentrations of neurogranin in these patients with mild‐to‐moderate PD, but further studies are needed to assess whether this may be of clinical relevance. Additionally, the findings question the previously postulated association of reduced CSF α‐synuclein concentration in PD with Lewy body pathology, in that reduced CSF α‐synuclein concentration may reflect synaptic degeneration and reduced release.
Author Contributions
PS drafted the manuscript, contributed to the conception and design of the study, acquisition and analysis of data. ALS contributed in revising a substantial portion of the manuscript and acquisition of data. KKJ contributed in revising a substantial portion of the manuscript and acquisition of data. AB contributed to the conception and design of the study, and acquisition of data. CC contributed to the acquisition and analysis of data. EA, LK, and ISA revised the manuscript and contributed to the acquisition of data. EH contributed to the conception and design of the study, and acquisition of data. HZ, KB, DA, and TF contributed in the conception and design of the study as well as acquisition of data and revision of the manuscript. All authors approved the final draft.
Conflicts of Interest
Dr. Selnes, Dr. Stav, Dr. Johansen, Dr. Bjørnerud, Dr. Kalheim, Dr. Almdahl, Dr. Hessen, and Dr. Auning have nothing to disclose. Dr. Coello reports personal fees from Imanova Ltd, outside the submitted work. Dr. Zetterberg reports personal fees from Roche Diagnostics, non‐financial support from Eli Lilly, personal fees from Pharmasum Therapeutics, outside the submitted work; and HZ is co‐founder of Brain Biomarker Solutions in Gothenburg AB, a GU Venture‐based platform company at the University of Gothenburg. Dr. Blennow reports personal fees from Fujirebio Europe, personal fees from Roche Diagnostics, personal fees from IBL International, outside the submitted work; and Co‐founder of Brain Biomarker Solutions in Gothenburg AB, a GU Venture‐based platform company at the University of Gothenburg. Dr. Aarsland reports personal fees from Novartis, personal fees from H Lundbeck, grants from Astra‐Zeneca, outside the submitted work. Dr. Fladby reports grants from Norwegian Research Council, grants from EU‐JPND, during the conduct of the study; in addition, Dr. Fladby has a patent PCT/EP2009/001210 issued, and a patent PCT/US2011/062233 pending.
Acknowledgments
The authors thank South‐Eastern Norway Regional Health Authority, the Research Council of Norway, Akershus University Hospital, and the University of Oslo for financial support and all study participants and personnel for their contributions. KB holds the Torsten Söderberg professorship of medicine. HZ is a Wallenberg Academy Fellow.
Funding Statement
This work was funded by South‐Eastern Norway Regional Health Authority grant 20111093; Research Council of Norway grants 217780 and 226074; EU‐JPND via the Research Council of Norway grant 237250; Akershus University Hospital grant ; Swedish Alzheimer Foundation grant 20111093; Swedish Brain Foundation grant ; University of Oslo grant ; Swedish Research Council grant ; Swedish State Support grant ; European Research Council grant .
References
- 1. Aarsland D, Bronnick K, Fladby T. Mild cognitive impairment in Parkinson's disease. Curr Neurol Neurosci Rep 2011;11:371–378. [DOI] [PubMed] [Google Scholar]
- 2. Aarsland D, Brønnick K, Larsen JP, et al. Cognitive impairment in incident, untreated Parkinson disease: the Norwegian ParkWest study. Neurology 2009;72:1121–1126. [DOI] [PubMed] [Google Scholar]
- 3. Pienaar IS, Burn D, Morris C, Dexter D. Synaptic protein alterations in Parkinson's disease. Mol Neurobiol 2012;45:126–143. [DOI] [PubMed] [Google Scholar]
- 4. Kramer ML, Schulz‐Schaeffer WJ. Presynaptic alpha‐synuclein aggregates, not Lewy bodies, cause neurodegeneration in dementia with Lewy bodies. J Neurosci 2007;27:1405–1410. [DOI] [PMC free article] [PubMed] [Google Scholar]
- 5. Schulz‐Schaeffer WJ. The synaptic pathology of α‐synuclein aggregation in dementia with Lewy bodies, Parkinson's disease and Parkinson's disease dementia. Acta Neuropathol 2010;120:131–143. [DOI] [PMC free article] [PubMed] [Google Scholar]
- 6. Kvartsberg H, Duits FH, Ingelsson M, et al. Cerebrospinal fluid levels of the synaptic protein neurogranin correlates with cognitive decline in prodromal Alzheimer's disease. Alzheimers Dement 2015;11:1180–1190. [DOI] [PubMed] [Google Scholar]
- 7. Sevlever D, Jiang P, Yen S‐HC Cathepsin d is the main lysosomal enzyme involved in the degradation of α‐synuclein and generation of its carboxy‐terminally truncated species†. Biochemistry 2008;47:9678–9687. [DOI] [PMC free article] [PubMed] [Google Scholar]
- 8. Saido T, Leissring MA. Proteolytic degradation of amyloid β‐protein. Cold Spring Harb Perspect Med 2012;2:a006379–a006379. [DOI] [PMC free article] [PubMed] [Google Scholar]
- 9. Hetz C, Mollereau B. Disturbance of endoplasmic reticulum proteostasis in neurodegenerative diseases. Nat Rev Neurosci 2014;15:233–249. [DOI] [PubMed] [Google Scholar]
- 10. Laßek M, Weingarten J, Wegner M, Volknandt W. The amyloid precursor protein‐a novel player within the molecular array of presynaptic nanomachines. Front Synaptic Neurosci 2015;7:21. [DOI] [PMC free article] [PubMed] [Google Scholar]
- 11. Cirrito JR, Kang J‐E, Lee J, et al. Endocytosis is required for synaptic activity‐dependent release of amyloid‐beta in vivo. Neuron 2008;58:42–51. [DOI] [PMC free article] [PubMed] [Google Scholar]
- 12. Checler F. Processing of the beta‐amyloid precursor protein and its regulation in Alzheimer's disease. J Neurochem 1995;65:1431–1444. [DOI] [PubMed] [Google Scholar]
- 13. Blennow K, Dubois B, Fagan AM, et al. Clinical utility of cerebrospinal fluid biomarkers in the diagnosis of early Alzheimer's disease. Alzheimers Dement 2015;11:58–69. [DOI] [PMC free article] [PubMed] [Google Scholar]
- 14. Parnetti L, Castrioto A, Chiasserini D, et al. Cerebrospinal fluid biomarkers in Parkinson disease. Nat Rev Neurol 2013;9:131–140. [DOI] [PubMed] [Google Scholar]
- 15. Stav AL, Aarsland D, Johansen KK, et al. Amyloid‐β and α‐synuclein cerebrospinal fluid biomarkers and cognition in early Parkinson's disease. Parkinsonism Relat Disord 2015;21:758–764. [DOI] [PubMed] [Google Scholar]
- 16. Alves G, Bronnick K, Aarsland D, et al. CSF amyloid‐β and tau proteins, and cognitive performance, in early and untreated Parkinson's Disease: the Norwegian ParkWest study. J Neurol Neurosurg Psychiatry 2010;81:1080–1086. [DOI] [PubMed] [Google Scholar]
- 17. Leverenz JB, Watson GS, Shofer J, Zabetian CP. Cerebrospinal fluid biomarkers and cognitive performance in non‐demented patients with Parkinson's disease. Parkinsonism Relat Discord 2011;17:61–64. [DOI] [PMC free article] [PubMed] [Google Scholar]
- 18. Stav AL, Johansen KK, Auning E, et al. Hippocampal subfield atrophy in relation to cerebrospinal fluid biomarkers and cognition in early Parkinson's disease: a cross‐sectional study. NPJ Parkinson's Dis 2016;2:15030. [DOI] [PMC free article] [PubMed] [Google Scholar]
- 19. Cummings DM, Liu W, Portelius E, et al. First effects of rising amyloid‐β in transgenic mouse brain: synaptic transmission and gene expression. Brain 2015;138:awv127–awv2004. [DOI] [PMC free article] [PubMed] [Google Scholar]
- 20. Patterson BW, Elbert DL, Mawuenyega KG, et al. Age and amyloid effects on human central nervous system amyloid‐beta kinetics. Ann Neurol 2015;78:439–453. [DOI] [PMC free article] [PubMed] [Google Scholar]
- 21. Burton EJ, McKeith IG, Burn DJ, et al. Cerebral atrophy in Parkinson's disease with and without dementia: a comparison with Alzheimer's disease, dementia with Lewy bodies and controls. Brain 2004;127:791–800. [DOI] [PubMed] [Google Scholar]
- 22. Compta Y, Ibarretxe‐Bilbao N, Pereira JB, et al. Grey matter volume correlates of cerebrospinal markers of Alzheimer‐pathology in Parkinson's disease and related dementia. Parkinsonism Relat Disord 2012;18:941–947. [DOI] [PubMed] [Google Scholar]
- 23. Beyer MK, Alves G, Hwang KS, et al. Cerebrospinal fluid Aβ levels correlate with structural brain changes in Parkinson's disease. Mov Disord 2013;28:302–310. [DOI] [PMC free article] [PubMed] [Google Scholar]
- 24. Eidelberg D, Moeller JR, Dhawan V, et al. The metabolic topography of Parkinsonism. J Cereb Blood Flow Metab 1994;14:783–801. [DOI] [PubMed] [Google Scholar]
- 25. Borghammer P. Perfusion and metabolism imaging studies in Parkinson's disease. Dan Med J 2012;59:B4466. [PubMed] [Google Scholar]
- 26. Rocher AB, Chapon F, Blaizot X, et al. Resting‐state brain glucose utilization as measured by PET is directly related to regional synaptophysin levels: a study in baboons. NeuroImage 2003;20:1894–1898. [DOI] [PubMed] [Google Scholar]
- 27. Jokinen P, Scheinin N, Aalto S, et al. [(11)C]PIB‐, [(18)F]FDG‐PET and MRI imaging in patients with Parkinson's disease with and without dementia. Parkinsonism Relat Disord 2010;16:666–670. [DOI] [PubMed] [Google Scholar]
- 28. Liepelt I, Reimold M, Maetzler W, et al. Cortical hypometabolism assessed by a metabolic ratio in Parkinson's disease primarily reflects cognitive deterioration—[18F]FDG‐PET. Mov Disord 2009;24:1504–1511. [DOI] [PubMed] [Google Scholar]
- 29. Bereczki E, Francis PT, Howlett D, et al. Synaptic proteins predict cognitive decline in Alzheimer's disease and Lewy body dementia. Alzheimer's Dement 2016;12:1149–1158. [DOI] [PubMed] [Google Scholar]
- 30. Berardelli A, Wenning GK, Antonini A, et al. EFNS/MDS‐ES/ENS [corrected] recommendations for the diagnosis of Parkinson's disease. Eur J Neurol 2013;20:16–34. [DOI] [PubMed] [Google Scholar]
- 31. Hessen E, Stav AL, Auning E, et al. Neuropsychological profiles in mild cognitive impairment due to Alzheimer”s and Parkinson”s Diseases. J Parkinsons Dis 2016;6:413–421. [DOI] [PMC free article] [PubMed] [Google Scholar]
- 32. Rey Auditory Verbal Learning Test [Internet]. Los Angeles: Western Psychological Services; 1996. Available from: http://books.google.no/books?id=UOcPRAAACAAJ&dq=intitle:Rey+Auditory+and+Verbal+Learning+Test+A+handbook+inauthor:schmidt&hl=&cd=1&source=gbs_api (Accessed March 2, 2017)
- 33. Fischl B, Salat DH, Busa E, et al. Whole brain segmentation: automated labeling of neuroanatomical structures in the human brain. Neuron 2002;33:341–355. [DOI] [PubMed] [Google Scholar]
- 34. Desikan RS, Ségonne F, Fischl B, et al. An automated labeling system for subdividing the human cerebral cortex on MRI scans into gyral based regions of interest. NeuroImage 2006;31:968–980. [DOI] [PubMed] [Google Scholar]
- 35. Selnes P, Grambaite R, Rincon M, et al. Hippocampal complex atrophy in poststroke and mild cognitive impairment. J Cereb Blood Flow Metab 2015;35:1729–1737. [DOI] [PMC free article] [PubMed] [Google Scholar]
- 36. Hagler DJ, Saygin AP, Sereno MI. Smoothing and cluster thresholding for cortical surface‐based group analysis of fMRI data. NeuroImage 2006;33:1093–1103. [DOI] [PMC free article] [PubMed] [Google Scholar]
- 37. Thorsell A, Bjerke M, Gobom J, et al. Neurogranin in cerebrospinal fluid as a marker of synaptic degeneration in Alzheimer's disease. Brain Res 2010;1362:13–22. [DOI] [PubMed] [Google Scholar]
- 38. Wellington H, Paterson RW, Portelius E, et al. Increased CSF neurogranin concentration is specific to Alzheimer disease. Neurology 2016;86:829–835. [DOI] [PMC free article] [PubMed] [Google Scholar]
- 39. Bohnen NI, Kaufer DI, Ivanco LS, et al. Cortical cholinergic function is more severely affected in parkinsonian dementia than in Alzheimer disease: an in vivo positron emission tomographic study. Arch Neurol 2003;60:1745–1748. [DOI] [PubMed] [Google Scholar]
- 40. Bohnen NI, Kaufer DI, Hendrickson R, et al. Cognitive correlates of cortical cholinergic denervation in Parkinson's disease and parkinsonian dementia. J Neurol 2006;253:242–247. [DOI] [PubMed] [Google Scholar]
- 41. Gratwicke J, Kahan J, Zrinzo L, et al. The nucleus basalis of Meynert: a new target for deep brain stimulation in dementia? Neurosci Biobehav Rev 2013;37(10 Pt 2):2676–2688. [DOI] [PubMed] [Google Scholar]
- 42. Klein JC, Eggers C, Kalbe E, et al. Neurotransmitter changes in dementia with Lewy bodies and Parkinson disease dementia in vivo. Neurology 2010;74:885–892. [DOI] [PubMed] [Google Scholar]
- 43. Lesné SE, Sherman MA, Grant M, et al. Brain amyloid‐β oligomers in ageing and Alzheimer's disease. Brain 2013;136:awt062–awt1398. [DOI] [PMC free article] [PubMed] [Google Scholar]
- 44. Choi B‐K, Kim J‐Y, Cha M‐Y, et al. β‐Amyloid and α‐synuclein cooperate to block SNARE‐dependent vesicle fusion. Biochemistry 2015;54:1831–1840. [DOI] [PMC free article] [PubMed] [Google Scholar] [Retracted]
- 45. Rockenstein E, Nuber S, Overk CR, et al. Accumulation of oligomer‐prone ‐synuclein exacerbates synaptic and neuronal degeneration in vivo. Brain 2014;137:1496–1513. [DOI] [PMC free article] [PubMed] [Google Scholar]
- 46. Bingol B, Sheng M. Deconstruction for reconstruction: the role of proteolysis in neural plasticity and disease. Neuron 2011;69:22–32. [DOI] [PubMed] [Google Scholar]
- 47. Rizo J, Südhof TC. Snares and munc18 in synaptic vesicle fusion. Nat Rev Neurosci 2002;3:641–653. [DOI] [PubMed] [Google Scholar]
- 48. Gratwicke J, Jahanshahi M, Foltynie T. Parkinson's disease dementia: a neural networks perspective. Brain 2015;1454–1476. [DOI] [PMC free article] [PubMed] [Google Scholar]