

Abstract
Key points
Dynamin 2 is a ubiquitously expressed protein involved in membrane trafficking processes.
Mutations in the gene encoding dynamin 2 are responsible for a congenital myopathy associated with centrally located nuclei in the muscle fibres.
Using muscle fibres from a mouse model of the most common mutation responsible for this disease in humans, we tested whether altered Ca2+ signalling and excitation–contraction coupling contribute to muscle weakness.
The plasma membrane network that carries the electrical excitation is moderately perturbed in the diseased muscle fibres.
The excitation‐activated Ca2+ input fluxes across both the plasma membrane and the membrane of the sarcoplasmic reticulum are defective in the diseased fibres, which probably contributes to muscle weakness in patients.
Abstract
Mutations in the gene encoding dynamin 2 (DNM2) are responsible for autosomal dominant centronuclear myopathy (AD‐CNM). We studied the functional properties of Ca2+ signalling and excitation–contraction (EC) coupling in muscle fibres isolated from a knock‐in (KI) mouse model of the disease, using confocal imaging and the voltage clamp technique. The transverse‐tubule network organization appeared to be unaltered in the diseased fibres, although its density was reduced by ∼10% compared to that in control fibres. The density of Ca2+ current through CaV1.1 channels and the rate of voltage‐activated sarcoplasmic reticulum Ca2+ release were reduced by ∼60% and 30%, respectively, in KI vs. control fibres. In addition, Ca2+ release in the KI fibres reached its peak value 10–50 ms later than in control ones. Activation of Ca2+ transients along the longitudinal axis of the fibres was more heterogeneous in the KI than in the control fibres, with the difference being exacerbated at intermediate membrane voltages. KI fibres exhibited spontaneous Ca2+ release events that were almost absent from control fibres. Overall, the results of the present study demonstrate that Ca2+ signalling and EC coupling exhibit a number of dysfunctions likely contributing to muscle weakness in DNM2‐related AD‐CNM.
Keywords: skeletal muscle, excitation‐contraction coupling, ryanodine receptor, sarcoplasmic reticulum Ca2+ release, dynamin 2
Key points
Dynamin 2 is a ubiquitously expressed protein involved in membrane trafficking processes.
Mutations in the gene encoding dynamin 2 are responsible for a congenital myopathy associated with centrally located nuclei in the muscle fibres.
Using muscle fibres from a mouse model of the most common mutation responsible for this disease in humans, we tested whether altered Ca2+ signalling and excitation–contraction coupling contribute to muscle weakness.
The plasma membrane network that carries the electrical excitation is moderately perturbed in the diseased muscle fibres.
The excitation‐activated Ca2+ input fluxes across both the plasma membrane and the membrane of the sarcoplasmic reticulum are defective in the diseased fibres, which probably contributes to muscle weakness in patients.
Abbreviations
- AD
autosomal dominant
- BIN1
amphiphysin 2
- CNM
centronuclear myopathy
- DNM2
dynamin 2
- EC
excitation–contraction
- FDB
flexor digitorum brevis
- FWHM
full width at half‐maximum
- KI
knock‐in
- MyHC
myosin heavy chain
- MTM1
myotubularin
- PBS
phosphate‐buffered saline
- PH
pleckstrin homology
- RYR1
type 1 ryanodine receptor
- SR
sarcoplasmic reticulum
- WT
wild‐type
Introduction
In skeletal muscle, Ca2+ released from the sarcoplasmic reticulum (SR) through type 1 ryanodine receptor (RYR1) channels generates the rise in cytosolic Ca2+ concentration that triggers contraction. The process is under the control of electrical activity in the transverse invaginations of the plasma membrane (the t‐tubules) where it is sensed by the dihydropyridine receptor Ca2+ channel CaV1.1, which physically controls RYR1 channel opening (Rios et al. 1992; Schneider, 1994; Dulhunty et al. 2017). Centronuclear myopathies (CNMs) encompass a group of inherited diseases that yield heterogeneous features in terms of age of onset and muscle weakness severity and progression, with all of them being associated with the presence of nuclei in a central position within the muscle fibres. Most well‐known mutations responsible for CNMs affect the genes encoding myotubularin (MTM1; Laporte et al. 1996), amphiphysin 2 (BIN1; Nicot et al. 2007) and dynamin 2 (DNM2; Bitoun et al. 2005). Although great progress has been made in the recent years with respect to the knowledge of the corresponding diseases, the underlying detailed pathophysiological mechanisms still remain unclear (Jungbluth & Gautel, 2014).
DNM2 is an ubiquitously expressed GTPase interacting with actin and microtubules and involved in endocytosis, membrane trafficking and centrosome cohesion (Durieux et al. 2010b). From the N‐ to C‐terminus, the protein is constituted by a GTPase domain, a ‘stalk’ region essential for the protein structure, a pleckstrin homology (PH) domain, a GTPase effector domain and a domain enriched in proline and arginine (Cao et al. 1998). DNM2‐related autosomal dominant (AD)‐CNM was initially characterized as a slowly‐progressing muscle weakness affecting distal muscles with onset in early adulthood, resulting from mutations affecting the stalk domain of the protein (Bitoun et al. 2005; Jeub et al. 2008). However, mutations affecting the PH domain were subsequently also identified in more severe neonatal sporadic forms of the disease (Bitoun et al. 2007). A knock‐in (KI) heterozygous mouse model of the most common mutation in the DNM2 human gene was generated by Durieux et al. (2010a, KI‐Dnm2 R465W) and found to reproduce the main symptoms of the human disease. In brief, mice develop progressive muscle weakness starting at ∼3 weeks of age, which occurs first with no associated loss in muscle mass or morphological abnormalities. Subsequently, at ∼2 months of age, atrophy develops, together with the appearance of alterations in mitochondria and the reticular membrane network, similar to those reported in biopsies from human patients. Defective membrane trafficking, including altered autophagy, was highlighted as a potentially major mechanism of the disease (Durieux et al. 2010a, b, 2012; Bohm et al. 2012). However, a possible contribution of disturbed intracellular Ca2+ homeostasis was also highlighted: indeed, the resting Ca2+ level and releasable sarcoplasmic reticulum Ca2+ content were reported to be elevated in muscle fibres from KI‐Dnm2 R465W mice, in concurrence with impaired contractile properties (Durieux et al. 2010a; Fraysse et al. 2016). Interestingly, defective intracellular Ca2+ homeostasis and excitation–contraction (EC) coupling are hallmarks of the centronuclear myopathy resulting from MTM1 deficiency (Al Qusairi et al. 2009; Kutchukian et al. 2016) and altered Ca2+ signals were also reported in muscle fibres down‐expressing BIN1 (Tjondrokoesoemo et al. 2011). Thus, Ca2+ homeostasis and EC coupling may represent commonly affected targets in all CNMs. The present study aimed to contribute to resolving this issue by investigating the detailed properties of voltage clamp‐activated sarcoplasmic reticulum Ca2+ release in muscle fibres isolated from KI‐Dnm2 R465W mice. Interestingly, the results obtained demonstrate that the pathophysiological consequences of the Dnm2 mutation on Ca2+ signalling and EC coupling share certain specific features with those associated with MTM1 deficiency (Kutchukian et al. 2016).
Methods
Ethical approval
All of the experiments and procedures were conducted in accordance with the guidelines of the local animal ethics committee of the University Claude Bernard – Lyon 1, the French Ministry of Agriculture (decree 87/848) and the revised European Directive 2010/63/EU and conform with the principles and regulations as described in Grundy (2015). All experiments were performed at room temperature (20–22°C).
Preparation of the muscle fibres
We used 6‐month‐old wild‐type (WT) and heterozygous KI‐Dnm2 R465W (also referred to as KI) male mice in the C57BL/6 genetic background (Durieux et al. 2010a). Mice were manipulated and taken care of in accordance with European recommendations on animal experimentation. Single fibres were isolated from the flexor digitorum brevis (FDB) and interosseus muscles in accordance with previously described procedures (Jacquemond, 1997). In brief, mice were anaesthetized with isoflurane and killed by cervical dislocation. Muscles were removed and incubated for 60 min at 37°C in the presence of external Tyrode solution containing 2 mg mL−1 collagenase (type 1; Sigma, St Louis, MO, USA). Single fibres were obtained by triturating the collagenase‐treated muscles within the experimental chamber. Fibre diameter was estimated from direct microscopic observation of isolated fibres viewed with a 40× objective. Comparisons were always made between groups of fibres issued from the same muscle type (either FDB or interosseous). Experiments were carried out on muscle fibres isolated from the muscles of both hindlimbs from three WT and four KI mice.
Electrophysiology
We used the silicone voltage clamp technique (Jacquemond, 1997; Lefebvre et al. 2014). In brief, fibres from the interosseous muscles were partly insulated with silicone grease so that only a short portion (50–100 μm long) of the fibre extremity remained out of the silicone. Fibres were bathed in the standard extracellular solution used for voltage clamp. An RK‐400 patch clamp amplifier (Bio‐Logic, Claix, France) was used in whole‐cell voltage clamp configuration in combination with an analogue–digital converter (Digidata 1440A; Axon Instruments, Foster City, CA, USA) controlled using pClamp 9 software (Axon Instruments). Voltage clamp was performed with a micropipette filled with a solution mimicking the ionic composition of the cytosolic compartment and also containing a high concentration of EGTA and the fluorescent Ca2+ ‐sensitive probe rhod‐2. The tip of the micropipette was inserted through the silicone, within the insulated part of the fibre, and it was gently crushed against the bottom of the chamber to ease intracellular equilibration. Analogue compensation was adjusted to further decrease the effective series resistance. Intracellular equilibration of the solution was allowed for a period of 30 min with the holding voltage held at −80 mV before initiating measurements. Membrane depolarizing steps of 0.5 s in duration were applied from a holding command potential of −80 mV. For calcium current analysis, the linear leak component of the membrane current was removed using the appropriately scaled value of the steady change in membrane current elicited by a 20 mV hyperpolarization from the holding potential. The voltage dependence of the peak current was fitted with the equation:
| (1) |
where I(V) is the peak current density at the command voltage V, G max is the maximum conductance, V rev is the apparent reversal potential, V 0.5 is the half‐activation potential and k is the steepness factor.
Confocal imaging and analysis
Confocal imaging was conducted with an LSM 5 Exciter microscope (Zeiss, Oberkochen, Germany) equipped with a 63× oil immersion objective (numerical aperture 1.4). For detection of rhod‐2 fluorescence, excitation was from the 543 nm line of a HeNe laser and fluorescence was collected above 560 nm. Rhod‐2 Ca2+ transients were imaged using the line‐scan mode (x,t) of the system with the line parallel to the longitudinal axis of the fibres. Images were taken with a scanning frequency of 1.15 ms per line. Rhod‐2 fluorescence changes were expressed as F/F 0 where F 0 is the baseline fluorescence. For imaging the t‐tubule network, FDB muscle fibres were incubated for 30 min in the presence of 10 μm di‐8‐anepps in Tyrode solution. For Ca2+ sparks measurements, FDB fibres were incubated for 30 min in the presence of Tyrode solution containing 10 μm fluo‐4 AM. For both di‐8‐anepps and fluo‐4 imaging, fluorescence was collected above 505 nm with 488 nm excitation. Estimation of the t‐tubule density from the di‐8‐anepps fluorescence was carried out from a largest possible region of interest excluding the plasma membrane, within each fibre. Two images were taken at distinct locations along each fibre. Analysis was carried out with ImageJ (NIH, Bethesda, MD, USA). Automatic thresholding with Otsu's method was used to create a binary image of the surface area occupied by t‐tubules. Then, the ‘skeletonize’ function was used to delineate the t‐tubule network. T‐tubule density was expressed as the percentage of positive pixels within the region.
Analysis of Ca2+ sparks was carried out in accordance with procedures described previously (Csernoch et al. 2008; Szabó et al. 2010). In brief, the region of the fibre and the background was defined on the first image of each x,y image series. The averaged background fluorescence was subtracted from each pixel of all images in one series. The calcium release events were detected by the stationary wavelet method. The filtering was made by soft thresholding wavelet detection. Finally, the amplitude and full width at half‐maximum (FWHM) of the sparks was calculated. Two FWHM values were calculated: perpendicular and parallel with the Z‐lines. To detect the Z‐lines, the frequency spectrum in each line of all images was calculated using fast Fourier transform. Finally, inverse fast Fourier transform of the frequency components correspond to sarcomeres was used to remove the Z‐lines from the images. The analysis of line scan images was performed with automatic event detection software (Szabo et al. 2010), which calculated the amplitude (F/F 0), FWHM and the duration of the identified events.
[Ca2+] and Ca2+ release calculation
The Ca2+ release flux underlying the rhod‐2 Ca2+ transients was estimated from the time derivative of the total myoplasmic Ca2+ ([CaTot]) obtained from the occupancy of intracellular calcium binding sites in accordance with a procedure described previously (Pouvreau et al. 2006; Lefebvre et al. 2011). For this, changes in [Ca2+] were calculated from the rhod‐2 signals using the pseudo‐ratio equation (Cheng et al. 1993) assuming a basal [Ca2+] of 0.1 μm and a K d of rhod‐2 for Ca2+ of 1.2 μm. The model included troponin C (TN) binding sites, parvalbumin binding sites and calcium transport across the SR membrane with the same parameters as those used in Lefebvre et al. (2011). Ca2+‐binding sites on EGTA provided the major contribution with a total sites concentration of 6 mm, an ‘on’ rate constant k on, EGTA of 0.056 μm −1 ms−1 and an ‘off’ rate constant koff, CaTN of 0.002 ms−1.
Quantification of the spatial heterogeneity of Ca2+ release activation was achieved as described previously (Kutchukian et al. 2016) by calculating the SD of the time to peak rate of rise in the rhod‐2 F/F 0 signal along the scanned line. To reduce noise, analysis was performed on a space‐ and time‐filtered version of the images of rate of change in rhod‐2 fluorescence: for this, line‐scan images of the rate of change in F/F 0 (dF/F 0/dt) were resampled from 512 to 64 pixels (0.1–0.8 μm per pixel) after linear averaging in the space domain, and the time derivative was calculated with a dt of 4 pixels (4.6 ms). Furthermore, the value for the time to peak dF/F 0/dt at a given position of the line was discarded if the corresponding absolute dF/F 0/dt value did not exceed five times the SD of the signal amplitude measured at the same line position, after the end of the pulse.
Myosin heavy chain (MyHC) composition
Fibre typing in muscle was determined according to the expression of MyHC isoforms by immunofluorescence analysis. Seven μm thick cryosections of tibialis anterior muscle from 5‐month‐old mice were made using a CM3050S cryostat (Leica). For immunostaining analysis, tissue sections were blocked for 1 h in 3% bovine serum albumin IgG‐free. Monoclonal antibodies against MyHC isoform slow MyHC‐1 (BA‐D5‐s, 1/2) and MyHC‐2A (SC‐71‐s, 1/2) were applied at room temperature for 2 h and then MyHC‐2B (BF‐F3‐s, 1/1) was applied at 4°C overnight. All MyHC antibodies were obtained from DSHB (Iowa City, IA, USA). Sections were respectively revealed by goat anti‐mouse IgG2b Cy3‐conjugated AffiniPure, goat anti‐mouse IgG1 DyLight 488‐conjugated AffiniPur and goat anti‐mouse IgM AMCA‐conjugated AffiniPur (Jackson ImmunoResearch Inc., West Grove, PA, USA) and mounted in Mowiol Medium. Image acquisition was performed using an AZ100 macroscope (Nikon, Tokyo, Japan) and the number of each fibre type was quantified using ImageJ.
Protein extraction and western blotting
Frozen tibialis anterior muscles were homogenized on ice, using a Potter‐Elvehjem homogenizer, in lysis buffer containing 50 mm of Tris‐HCl pH 7.5, 150 mm NaCl, 1 mm EDTA and NP40 1% supplemented with protease inhibitor cocktail 1% (Sigma‐Aldrich, Saint‐Quentin‐Fallavier, France). After centrifugation (14,000 g at 4°C for 15 min), the protein concentration in the supernatant was determined with a BCA Protein Assay Kit (Thermo Scientific Pierce, Villebon sur Yvette, France). Proteins (30 μg) were mixed with loading buffer (50 mm Tris‐HCl, SDS 2%, glycerol 10%, β‐mercaptoethanol 1% and bromophenol blue). Protein samples were separated on Nupage 4–12% Bis Tris gel (Life Technologies, Saint‐Aubin, France) and transferred onto nitrocellulose membranes (0.45 μm pore size; Life Technologies) overnight at 100 mA at 4°C. Membranes were blocked for 1 h at room temperature in phosphate‐buffered saline (PBS) containing non‐fat dry milk 5% and Tween‐20 0.1% and then exposed to mouse monoclonal anti‐α1 subunit of DHPR (Merck‐Millipore, Saint Quentin en Yvelines, France) or mouse monoclonal anti‐α tubulin (Sigma‐Aldrich) in PBS‐Tween‐20 0.1% and milk 1% overnight at 4°C. Membranes were rinsed in PBS‐Tween‐20 0.1% and incubated for 2 h with HRP‐conjugated secondary antibody (anti‐mouse from Jackson ImmunoResearch, Newmarket, UK) in PBS‐Tween‐20 0.1%. Chemiluminescence was detected using an ECL detection Kit (Merck‐Millipore) in a G‐Box imaging system (Ozyme, Montigny‐le‐Bretonneux, France) and signal quantification was performed using ImageJ.
Solutions
Tyrode solution contained (in mm): 140 NaCl, 5 KCl, 2.5 CaCl2, 2 MgCl2 and 10 Hepes. The extracellular solution used for voltage clamp contained (in mm) 140 TEA‐methanesulphonate, 2.5 CaCl2, 2 MgCl2, 1 4‐aminopyridine, 10 Hepes and 0.002 tetrodotoxin. The pipette solution contained (in mm) 120 K‐glutamate, 5 Na2‐ATP, 5 Na2‐phosphocreatine, 5.5 MgCl2, 15 EGTA, 6 CaCl2, 0.1 rhod‐2, 5 glucose and 5 Hepes. Di‐8‐anepps and fluo‐4 AM were dissolved and stored in dimethyl sulphoxide. All solutions were adjusted to pH 7.20.
Statistical analysis
Statistical analysis was performed using Origin, version 8.0 (OriginLab Corp., Northampton, MA, USA). For all comparisons, only muscle fibres issued from the same type of muscle (either FDB or interosseous) were used. Data values are presented as the mean ± SD for n fibres. Unless otherwise specified, statistical significance was determined using Student's t test (* P ≤ 0.05, ** P ≤ 0.01, *** P ≤ 0.001). Normality of datasets was checked for each statistical analysis.
Results
Mildly altered t‐tubule network in KI‐Dnm2 R465W muscle fibres
An altered t‐tubule network is a hallmark of the CNM resulting from MTM1 deficiency and contributes to the associated failing EC coupling (Al Qusairi et al. 2009). It was thus of great interest to determine whether a similar process occurs in the KI‐Dnm2 R465W model. Figure 1 A shows representative confocal frames of di‐8‐anneps fluorescence from WT and KI‐Dnm2 R465W fibres. The two images, together with corresponding longitudinal profiles of fluorescence intensity (Fig. 1 B) along the indicated regions of interest, demonstrate that there was no striking difference reproducibly catching the eye between WT and KI fibres. Assuming two t‐tubules per sarcomere, sarcomere length was estimated from the number of double‐peaks within the profile length. Mean ± SD absolute sarcomere length values were very similar in WT (1.96 ± 0.03, n = 29) and KI fibres (1.98 ± 0.04, n = 37, P = 0.04). To quantify the t‐tubule density, the network was outlined as illustrated in Fig. 1 C (see Methods) and expressed as a percentage of the total surface of the region. Corresponding values for t‐tubule density index are shown in Fig. 1 C.
Figure 1. T‐tubule network in WT and KI‐Dnm2 R465 fibres.
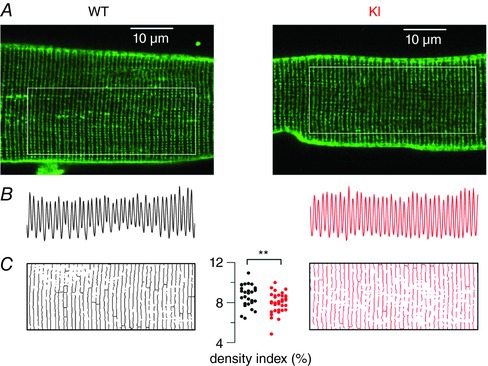
A, x,y fluorescence images of di‐8‐anepps staining of the t‐tubule network in a WT (left) and in a KI (right) muscle fibre. The analysis shown in (B) and (C) was performed within the region of interest highlighted by a white box in each image. B, longitudinal profile of fluorescence along the corresponding region of interest shown in (A). C, outlined t‐tubule network within each region of interest; thresholding was used to create a binary image of the network. The graph in the middle shows values for the t‐tubule density index in the two groups of fibres, calculated as the percentage of above‐threshold pixels in the regions of interest.
The mean ± SD density index was reduced by ∼10% in KI (7.97 ± 0.98, n = 37) compared to WT fibres (8.67 ± 1.1, n = 29, P = 0.008). Thus, altogether, the t‐tubule network appears far less affected in this model of CNM than in the case of MTM1 deficiency (Al Qusairi et al. 2009). However, it should be noted that local defects in the network similar to those reported in MTM1‐deficient muscle fibres (Al Qusairi et al. 2009; Kutchukian et al. 2016) were identified in three out of the 37 imaged KI fibres, with one fibre exhibiting extended alterations giving the lowest value of t‐tubule density index (4.8).
Another feature of MTM1‐deficiency is muscle atrophy (Buj Bello et al. 2002) and this was also a feature associated with impairment of contractile properties of the tibialis anterior of KI‐Dnm2 R465W mice (Durieux et al. 2010a). We thus checked whether this was also the case for the fibres used in the present study. The mean ± SD diameter was reduced by 8% in the KI group compared to the WT group (42.7 ± 8.5 μm, n = 81, vs. 39.4 ± 10.7 μm, n = 95, respectively, P = 0.03).
Depressed CaV1.1 Ca2+ current density in KI‐Dnm2 R465W muscle fibres
Membrane currents were measured simultaneously to rhod‐2 Ca2+ transients in response to voltage clamp depolarizing pulses of 0.5 s duration. The mean ± SD capacitance from WT and KI fibres measured from the change in current elicited by a 20 mV hyperpolarizing pulse from −80 mV was 2.2 ± 0.7 (n = 22) and 1.4 ± 0.4 nF (n = 25), respectively. The value was thus significantly reduced by 36% (P < 0.0001) in the KI fibres. Assuming that, on average, the same fibre length was voltage clamped in the two groups of fibres, this difference is quite substantial. Figure 2 A shows representative traces of CaV1.1 Ca2+ current in response to membrane depolarizing steps of increasing amplitude in a WT and in a KI muscle fibre. Figure 2 B shows the mean peak current density vs. voltage relationships from 22 WT and 23 KI fibres, whereas the mean parameters obtained from fitting each individual voltage‐dependence are shown in Fig. 2 C. There was a severe decrease in the peak amplitude of the current, which translated into a 70% decrease of the peak conductance associated with an 11 mV negative shift of the half‐activation voltage. The apparent reversal voltage also significantly differed between the two groups. However, this difference should be interpreted with caution considering that we did not measure the current at sufficiently large voltages to accurately appreciate this parameter. In any case, the results clearly highlight a severe alteration of CaV1.1‐mediated Ca2+ entry in the diseased fibres. The time course of inactivation was estimated by fitting a single exponential function to the decaying phase of the current for membrane voltage values between 0 and +40 mV. For voltages between 0 and +30 mV, mean values for the time constant tended to be larger in the KI than in WT fibres (by 10–30%). However differences between the two groups were not significant. For example, at +10 mV, mean ± SD values were 55.5 ± 15.6 ms (n = 22) and 73.9 ± 41.7 ms (n = 25, P = 0.056) in WT and KI fibres, respectively.
Figure 2. CaV.1.1 Ca2+ current in WT and KI‐Dnm2 R465 fibres.
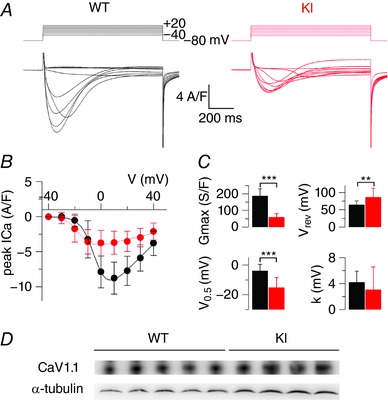
A, representative Ca2+ current traces in a WT and in a KI fibre in response to 0.5 s long depolarizing pulses from −80 mV to the range of indicated values, by 10 mV steps. B, mean voltage‐dependence of the peak Ca2+ current in the two groups of fibres from measurements performed as shown in (A). Superimposed continuous lines show the result from fitting the mean WT and KI data points with eqn (1). C, mean values for the parameters obtained from fitting each current vs. voltage dataset with eqn (1) (see Methods). D, expression of CaV1.1 in tibialis anterior muscles: western‐blot using an antibody against the α1 subunit of the dihydropyridine receptor was performed on protein extracts from five WT and four KI mice at 5 months of age. An α‐tubulin antibody was used as loading control.
To determine whether the depressed Ca2+ current density was the result of a reduced amount of CaV1.1 protein, a western blot analysis was performed on protein extracts from tibialis anterior muscles from WT and KI mice, with α‐tubulin used as loading control. The results are presented in Fig. 2 D. On average, the CaV1.1/tubulin ratio was 1.21 ± 0.31 and 0.95 ± 0.06 in extracts from 5 WT and 4 KI muscles, respectively. The difference was statistically not significant (P = 0.15; Mann–Whitney U test).
Altered SR Ca2+ release amplitude and kinetics in KI‐Dnm2 R465W muscle fibres
Figure 3 A shows rhod‐2 Ca2+ transients elicited by membrane depolarizing steps of increasing amplitude in a WT and in a KI fibre. As routinely observed under these conditions, transients in WT fibres exhibit a fast rising phase at the onset of the pulse, followed by a slower one at low and intermediate voltages and by a more or less steady or slowly decaying phase for the largest steps. As shown in Fig. 3 A, KI fibres exhibited an overall similar time‐course, although the initial rise of the transients appeared to be less sharp than in the WT fibres, and the maximum level reached during the pulse was somewhat less than in the WT fibres. Figure 3 B shows corresponding traces for the rate of SR Ca2+ release: both WT and KI fibres exhibited an early peak, the amplitude of which increased with the amplitude of the pulse, followed by a spontaneous decay down to a low level. In response to depolarizing steps of same amplitude, the peak Ca2+ release was lower in the KI than in the WT fibre. In addition, the time to reach the peak was increased in the KI fibre, as shown in the inset of Fig. 3 B, which provides an expanded view of peak rates of Ca2+ release of similar peak amplitude in the WT (at V = 0 mV) and in the KI fibre (at V = +40 mV).
Figure 3. Voltage‐activated SR Ca2+ release in WT and KI‐Dnm2 R465 fibres.
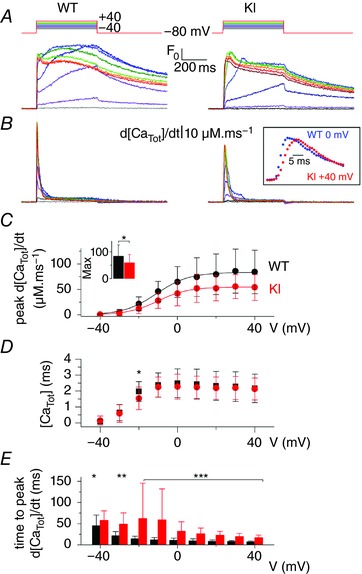
A, representative rhod‐2 Ca2+ transients in a WT and in a KI fibre in response to 0.5 s long depolarizing pulses from −80 mV to the range of indicated values, by 10 mV steps. B, corresponding Ca2+ release flux (d[CaTot]/dt) traces calculated as described in the Methods. C, mean voltage‐dependence of the peak rate of SR Ca2+ release in WT and KI fibres. Superimposed continuous lines show the result from fitting the mean WT and KI data points with a Boltzmann equation. The inset shows the mean values for maximal rate of SR Ca2+ release in the two groups of fibres, as assessed from Boltzmann fits to data from each fibre. D, mean values for the total amount of released Ca2+ calculated from the time integral of the Ca2+ release traces, in WT and KI fibres. E, mean values for the time to peak Ca2+ release in WT and KI fibres.
Mean ± SD values for the amplitude of peak rate of Ca2+ release vs. voltage are shown in Fig. 3 C in the two groups of fibres. Fitting the voltage dependence in each fibre with a Boltzmann function gave mean values for maximal rate, mid‐voltage and steepness of 83.4 ± 42.5 μm ms−1, −11.3 ± 7.1 mV and 7.4 ± 2.9 mV in WT fibres (n = 22) and 59.1 ± 31.2 μm ms−1, −8.1 ± 7.9 mV and 8.2 ± 2.7 mV in KI fibres (n = 24), respectively. The mean value for maximal rate was significantly reduced in KI compared to WT fibres by ∼30% (Fig. 3 C, inset, P = 0.03). Figure 3 D shows corresponding mean values for the total released Ca2+ (expressed in terms of myoplasmic volume) calculated from the time integral of the Ca2+ release traces. Assuming that some extent of SR Ca2+ depletion occurs during the pulses, any severe difference in SR Ca2+ content between WT and KI fibres would translate into an alteration of the plateau value of total released Ca2+ reached for the large pulses. The results in Fig. 3 D thus indicate that initial SR Ca2+ content was probably similar in the WT and KI fibres. Figure 3 E shows mean values for time to peak Ca2+ release in WT and KI fibres. Mean values were larger in KI fibres by 50 to 10 ms within the −20 to +40 mV range, respectively. To test whether a change in the time course of change in membrane voltage could contribute to the delayed time to peak Ca2+ release in KI fibres, an analysis of the time course of the capacitive current was performed. For this, the transient change in membrane current used to calculate the capacitance was fitted by a 2 exponential plus constant function. Mean ± SD values for the fast and slow time constant were 0.62 ± 0.2 ms and 4.8 ± 3.7 ms, respectively, in WT fibres and 0.36 ± 0.08 ms and 4.72 ± 1.16 ms, respectively, in KI fibres, providing no indication that a reduced speed of voltage establishment would contribute to delayed activation of ryanodine receptors in the KI fibres. Thus, altogether, voltage‐activated Ca2+ release is depressed and slowed in KI fibres, whereas voltage‐dependency and SR Ca2+ content are unaffected. To determine whether these Ca2+ release alterations could be associated with a change in fibre type composition of the muscles, the expression of MyHC isoforms was assessed by immunofluorescence analysis in tibialis anterior muscles. The results are presented in Table 1. They clearly demonstrate that there was no change in fibre type composition in the KI muscles, thus ruling out this possibility.
Table 1.
Fibre typing in tibialis anterior muscles from 5‐month‐old WT and KI‐Dnm2 R465W mice
| WT | KI | |
|---|---|---|
| Type I | 0.33 ± 0.09 | 0.23 ± 0.09 |
| Type IIa | 9.42 ± 0.77 | 7.79 ± 2.63 |
| Type IIb | 90.25 ± 0.69 | 91.98 ± 2.67 |
Type I, IIa and IIb muscle fibres were counted after co‐immunostaining of the three corresponding myosin isoforms on tibialis anterior sections. Values are indicated as the percentage of each fibre type relative to the total number of fibres (mean ± SD from four animals per genotype). Statistical analysis was performed using a Mann–Whitney U test (WT vs. KI for each fibre type). None of the mean values differed between the two groups (P > 0.05).
Spatial variability of Ca2+ release in KI‐Dnm2 R465W muscle fibres
Muscle fibres from the Mtm1‐KO mouse model of CNM were shown to exhibit spatial non uniformity of Ca2+ release along their longitudinal axis (Kutchukian et al. 2016). It was thus of interest to assess whether similar defects were detectable in the present model of DNM2‐related CNM. Figure 4 A shows a line‐scan image of rhod‐2 fluorescence from a WT (left) and from a KI fibre (right) taken when a pulse from −80 to −10 mV was applied. The traces underneath show the average time course of F/F 0 along the entire line of each corresponding line‐scan image. Figure 4 B shows corresponding images of the time derivative of the fluorescence [d(F/F 0)/dt]. The WT fibre exhibited a sharp peak, the time position of which was very well conserved along the line (Fig. 4 C, left). By contrast, the KI fibre exhibited a delayed peak for which the time position increased from the top to the bottom of the line (Fig. 4 C, right). Spatial variability of the time to peak Ca2+ release could take several forms, as illustrated in Fig. 5, which shows d(F/F 0)/dt images from three KI fibres (Fig. 5 A–C) depolarized at −10 and at +10 mV. Each of these three fibres was from a distinct KI mouse. In all cases, the time to peak Ca2+ release tended to vary much more along the line at −10 mV than at +10 mV, irrespective of whether it appeared early or late during the pulse. Figure 5 A illustrates an example where the time to peak Ca2+ release at −10 mV varies along the scanned line but remains close in time to the beginning of the pulse. By contrast, Fig. 5 B shows an example with time to peak still varying along the line but at very late times during the pulse. Finally, Fig. 5 C shows an example where two distinct peaks are observed during the pulse.
Figure 4. Spatial heterogeneity of time to peak SR Ca2+ release in KI‐Dnm2 R465 fibres.
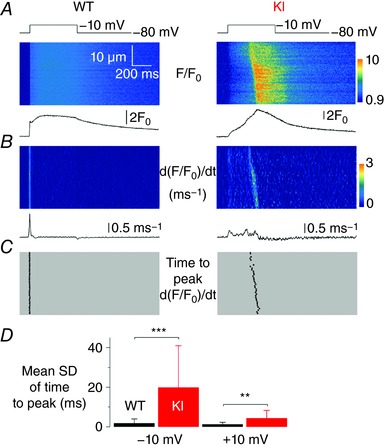
A, F/F 0 rhod‐2 line‐scan images taken from a WT and a KI fibre in response to a 0.5 s long depolarizing pulse from −80 to −10 mV. Traces below show the corresponding average F/F 0 signal over the full line. B, corresponding images of the rate of change in F/F 0 (dF/F 0/dt); these images were resampled from 512 to 64 pixels (0.1–0.8 μm per pixel) after linear averaging in the space domain, and the time derivative was calculated with a dt of 4 pixels (4.6 ms). Traces below show the average rate of change in F/F 0 over the full line. C, corresponding distribution of the time to peak rate of change in F/F 0 at each position along the scanned line. D, mean ± SD of the time to peak rate of change in rhod‐2 F/F 0 in WT (n = 21) and KI fibres (n = 25), in response to a pulse to −10 mV (left) and to +10 mV (right).
Figure 5. Examples of spatial variability of peak Ca2+ release rate in KI‐Dnm2 R465W fibres at −10 and + 10 mV.
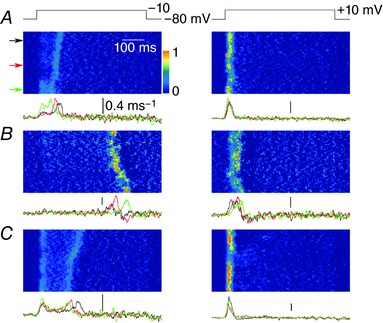
A–C, images of the rate of change in rhod‐2 fluorescence (dF/F 0/dt) in three distinct KI fibres, respectively, stimulated by a voltage pulse from −80 to −10 mV (left) and by a voltage pulse from −80 to +10 mV (right). Traces underneath each image show the time course of the rate of change in F/F 0 at the three positions indicated by arrows along the line. Scale bars = 0.4 ms−1.
Figure 4 D shows mean values for the SD of the time to peak of the derivative in WT and KI fibres at both −10 and +10 mV. The mean value was substantially elevated in the KI fibres at −10 mV and to a lesser extent at +10 mV. Altogether, there was a clear trend for a reduced spatial synchronicity of Ca2+ release in KI compared to WT fibres.
Spontaneous Ca2+ sparks in KI‐Dnm2 R465W muscle fibres
In differentiated muscle, the tight control of RYR1 channel opening by the t‐tubule CaV1.1 voltage‐sensors is presumed to repress Ca2+‐mediated activation of the channels. Consequently, Ca2+ sparks, which are a manifest expression of Ca2+‐induced Ca2+ release, are very rare in intact mammalian muscle fibres under physiological conditions (Shirokova et al. 1998, Zhou et al. 2006). We tested whether the present disease situation was associated with a perturbation of this process. Figure 6 A shows an example of the sum of 10 x,y confocal frames of fluo‐4 fluorescence taken from a KI fibre. The resulting image was inhomogeneous as a result of transient local increases in fluorescence at various locations throughout the fibre. Figure 6 B shows the baseline fluorescence‐corrected confocal frame exhibiting the brightest event of this series (highlighted in the square box). This event exhibited a peak amplitude of ∼3 F 0 and extended spatially over ∼5 μm (Fig. 6 C). In total, 532 Ca2+ sparks were detected in 28 out of 36 KI muscle fibres with a mean ± SD frequency of 153.1 ± 206.2 mm−2 s−1. In comparison, only 41 events were detected in 10 out of 30 WT fibres where they appeared with a significantly lower frequency (15.0 ± 33.6 mm−2 s−1, P < 0.001).
Figure 6. Ca2+ sparks in intact KI‐Dnm2 R465W fibres.
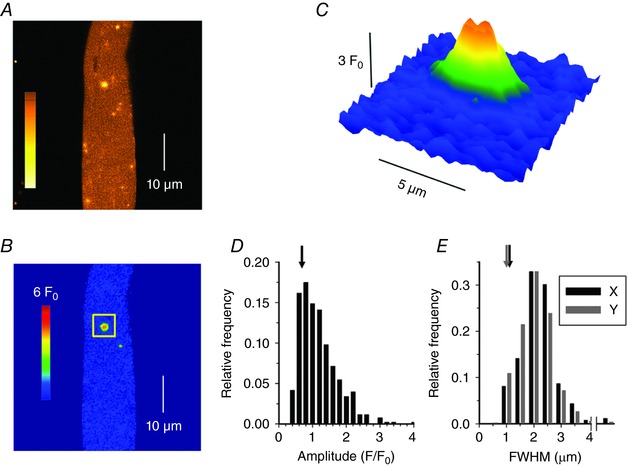
A, sum of 10 x,y confocal images of fluo‐4 fluorescence from an isolated KI muscle fibre showing a localized increase in [Ca2+]. Colour bar is in arbitrary units. B, first image from the cumulated series shown in (A) after correction for baseline fluorescence (F 0) and removal of structure elements (see Methods), expressed as F/F 0. C, enlarged view of the individual spark highlighted by the square box in (B). Colour bar is the same for (B) and (C). D, Ca2+ release events amplitudes. E, FWHM of the Ca2+ release events, for profiles parallel (X) and perpendicular (Y) to the fibres axis. Arrows in (D) and (E) indicate the corresponding average values measured for the few events detected in WT fibres.
Figure 6 D and E show the distribution of spark amplitude and FWMH in the KI fibres, respectively. The vast majority of events yielded a peak amplitude between 0.5 and 1.5 F 0 (mean of 1.07 ± 0.55) and a FWMH between 1 and 3 μm in both the x (mean of 1.94 ± 0.65 μm, black) and y (mean of 1.79 ± 0.62 μm, grey) directions. In Fig. 6 D and E, arrows indicate corresponding average values measured in WT fibres, demonstrating not only that the event frequency was enhanced in the KI fibres, but also that the amplitude and spatial spread of the events were significantly larger than those of the rare events detected in WT fibres (mean ± SD amplitude of 0.75 ± 0.36 F 0 and mean ± SD spatial spread of 1.20 ± 0.40 and 1.09 ± 0.44 μm in the x and y directions, respectively, P < 0.001 for all parameters). To characterize their temporal features, events were also detected in line‐scan mode in those fibres where the frequency was the largest. Examples are shown in Fig. 7 A–C, indicating the presence of either typical lone sparks (Fig. 7 A, arrow) or of long‐lasting lower amplitude events (Fig. 7 B, arrow). The amplitude and FWHM distribution of the lone sparks are shown in Fig. 7 D and E. The data originate from 272 events from 16 fibres. Mean ± SD values for event amplitude, FWHM and duration were 1.20 ± 0.74 F 0, 1.33 ± 0.85 μm and 19.7 ± 10.1 ms.
Figure 7. Ca2+ sparks in intact KI‐Dnm2 R465W fibres detected in line‐scan mode.
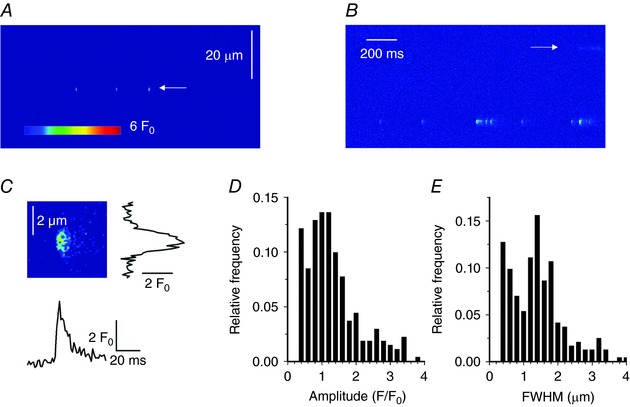
A and B, normalized line‐scan images (F/F 0) of fluo‐4 fluorescence from two KI fibres showing typical calcium release events corresponding to either lone Ca2+ sparks (A) or a series of such events (B, bottom of the image) or long embers (B, marked by arrow). C, enlarged portion of the image in (A) displaying an individual event at increased temporal and spatial resolution. Traces on the right and underneath show the corresponding spatial distribution and time course of the fluorescence transient, respectively. D and E, amplitude and FWHM histograms, respectively, of the lone calcium sparks from DNM2 KI fibres.
Discussion
The present investigation provides novel insights into the functional features and pathogenic mechanisms involved in DNM2‐related CNM. The results obtained demonstrate that muscle fibres from the KI‐Dnm2 R465W mouse model of the disease suffer from defective Ca2+ homeostasis and EC coupling, which probably contributes to muscle weakness. In addition, the results highlight not only similarities but also discrepancies with other models of CNM.
Most well‐known CNMs result from mutations in the genes encoding MTM1, DNM2 or BIN1, with all three proteins known to be involved in membrane remodelling and trafficking events. This could provide the basis for a common pathological mechanism (Cowling et al. 2012), whereas nuclei mis‐localization may represent an offshoot with no or less critical relevance to muscle weakness. Accordingly, it is of particular interest to assess, in all models, the features of processes identified as defective in one of them. Depressed Ca2+ release is a hallmark of MTM1 deficiency where it is associated with defective architecture of the t‐tubule network (Al Qusairi et al. 2009; Kutchukian et al. 2016). Defects in t‐tubule network linked with alterations in intracellular Ca2+ release were also reported following shRNA‐mediated knockdown of BIN1in adult muscle fibres (Tjondrokoesoemo et al. 2011). By contrast, in the present study, the majority of fibres isolated from 6‐month‐old KI‐Dnm2 R465W mice did not yield acute destructions of the t‐tubule network similar to those reported in the two other models. This is also consistent with previous observations of CaV1.1 immunostaining in muscle fibres from this same mouse model, from which no sign of alteration of the transverse striated expression pattern was detected (Durieux et al. 2010a). Altogether, this is evidence that critically altered maintenance of the t‐tubule network is not a pathogenic hallmark of the present Dnm2 mutation, whereas it is in the absence of MTM1 or BIN1. Conversely, this also suggests that t‐tubule disruption may be critically associated with the degree of severity of a given CNM. Still, the present analysis of the t‐tubule density revealed a small but significant reduction in the KI fibres, highlighting a certain extent of reduced t‐tubule development. Together with significant atrophy of the muscle fibres, this probably contributed to the observed reduced capacitance of the KI fibres compared to that of WT fibres. However, despite apparently normal integrity, the t‐tubule network in KI‐Dnm2 fibres possibly suffered from subtle alterations that remained undetectable from di‐8‐anepps fluorescence. CNM‐related Dnm2 mutations enhance DNM2 membrane fission activity and thus may be involved in such an effect (Chin et al. 2015). Also, reduced t‐tubule membrane folding was shown to contribute to reduced capacitance in cardiac cells deleted from BIN1 (Hong et al. 2014). Thus, a similar mechanism might occur in the present DNM2 CNM model.
The Ca2+ current density through t‐tubule CaV1.1 channels was severely reduced in the KI fibres, whereas the protein level was maintained. Because there is evidence in other cell systems that dynamin protein‐dependent endocytosis regulates Ca(V) channels density (Yang et al. 2010; Di Biase et al. 2011), reduced CaV1.1 membrane expression could be the underlying mechanism. In MTM1‐deficient muscle, CaV1.1 Ca2+ current density is also reduced, but this is in association with altered immunostaining and a reduced protein level (Al Qusairi et al. 2009). Thus, in the present model, a DNM2‐dependent mechanism, possibly related to its trafficking function, is responsible for the loss of Ca2+ channel activity in the t‐tubule membrane, independent of any reduced protein level.
Voltage‐activated SR Ca2+ release in the KI‐Dnm2 R465W fibres exhibits a reduced peak amplitude and an increased time‐to‐peak throughout the voltage range of activation. By contrast, Fraysse et al. (2016) reported no difference in peak and time‐to‐peak Ca2+ transients elicited by field stimulation between WT and KI‐Dnm2 R465W fibres. The difference may result from their use of the high‐affinity indicator fura‐2, which is kinetically limited and easily saturated under non‐Ca2+‐buffering conditions. Under these conditions, the relatively mild depression of Ca2+ release (by 30%) may escape being detected. The Ca2+ release alterations observed in the conditions employed in the present study are qualitatively similar to those reported in MTM1‐deficient muscle fibres. However, quantitatively, the extent of Ca2+ release depression in the present study in muscle fibres from 6‐month‐old KI‐Dnm2 R465W mice (by ∼30%) was not as dramatic as that observed in muscle fibres from Mtm1‐KO mice, reaching 60% at 4–5 weeks of age (Kutchukian et al. 2016). The much stronger early impairment in Mtm1‐KO fibres compared to KI‐Dnm2 R465W fibres is probably responsible for the dramatic weakness phenotype in the MTM1 mouse model and in MTM1 patients. Importantly, in the present study, the total amount of released Ca2+ for the largest depolarizing pulses did not differ between WT and KI‐Dnm2 R465W fibres, indicating that the SR content was maintained in the diseased fibres and was probably not the reason for the reduced peak rate of Ca2+ release. As an underlying mechanism, disturbed DNM2 membrane fission activity, as a consequence of the mutation, may be proposed to alter or destabilize CaV1.1‐RYR1 interactions and be responsible for the reduced amplitude of voltage‐activated Ca2+ release, as well as contribute to the loss of its spatial synchronicity.
The extent of increase in time to peak Ca2+ release reported in the present study in KI‐Dnm2 R465W fibres is remarkably similar to that reported in MTM1‐deficient muscle fibres. For example, for a pulse to +10 mV, the mean values for time‐to‐peak Ca2+ release in WT and Mtm1‐KO fibres were 10 and 28 ms, respectively (Kutchukian et al. 2016). For the same pulse, the mean values in WT and KI‐Dnm2 R465W fibres are 9 and 26 ms, respectively. Because the disease phenotype is much more severe in the case of MTM1‐deficiency, this quantitatively similar alteration probably has no critical role in the loss of muscle force. In Mtm1‐KO fibres, this effect results, at least in part, from contribution of Ca2+‐activated RYR1 channels to voltage‐activated Ca2+ release because of the presence of CaV1.1‐free RYR1 channels (Kutchukian et al. 2016) and this process is also considered to contribute to enhanced spatial variability of Ca2+ release. The enhanced spatial variability of Ca2+ release also observed in the present study in KI‐Dnm2 R465W fibres, together with the propensity for appearance of spontaneous Ca2+ sparks, is consistent with enhanced Ca2+‐induced Ca2+ release activity. This suggests that, despite no apparent acute disruption of the t‐tubule network, some RYR1 channels have lost their control by CaV1.1 voltage sensors and can be Ca2+‐activated.
The similarity between certain features of altered Ca2+ signalling in Mtm1‐KO fibres and in KI‐Dnm2 R465W fibres prompts the need to highlight the molecular and functional links between MTM1 and DNM2: indeed, both proteins, in association with amphiphysin 2 (BIN1) are considered to be important for membrane tubulation (Royer et al. 2013) and a proper balance between the tubulation activity of BIN1 and the fission activity of dynamin 2 has been suggested to be critical for t‐tubule maintenance; however, the details of how the three proteins, in association with phosphoinositide metabolism, ensure proper t‐tubule homeostasis/maintenance are far from completely understood and the role of MTM1 in the framework is specifically unclear (Hohendahl et al. 2016). One other equivocal aspect of this issue is that BIN1 and MTM1 appear to concentrate in the triadic region (Rodriguez et al. 2014; Lee et al. 2002), which is consistent with a role in t‐tubule membrane remodelling, whereas this is not the case for DNM2, which essentially localizes in the vicinity of the Z line (Durieux et al. 2010a). Thus, either there are different pools of DNM2 of distinct function, localization and concentration, or DNM2 has an indirect distant impact on t‐tubule/triad organization, or DNM2 is able to translocate from the Z line region to the triadic area when needed.
By contrast to some of these somewhat uncertain molecular and cellular features, remarkably clear functional links exist between MTM1 and DNM2 at the pathological level: indeed, MTM1‐deficiency is associated with overexpression of DNM2 whereas DNM2 down‐expression rescues the deleterious consequences of MTM1‐deficiency (Cowling et al. 2014). In addition, overexpression of DNM2 in normal muscle generates a myopathy phenotype (Cowling et al. 2011). Altogether, this is consistent with DNM2 disturbed/enhanced activity playing a role in the MTM1 pathology. Thus, some of the similarities in defective Ca2+ signalling between MTM1‐deficient fibres and Dnm2 R465W KI fibres, including the altered time course of Ca2+ release, may be a result of enhanced DNM2 expression and enhanced DNM2 activity, respectively. Again, changes in the triadic organization as a result of improperly balanced DNM2 activity may play an important role in these defects.
The Ca2+ sparks detected in the present study in the KI fibres occurred, on average, at a frequency one order of magnitude larger than that of the events detected in WT fibres. They also yielded a larger amplitude and spatial spread than in WT fibres. This may indicate that the underlying process does not simply correspond to enhanced activation of the mechanism that generates the erratic events in normal fibres but, instead, that a specific operating mode of the RYR1 channels was promoted in the disease condition. Saponin permeabilization is known to trigger the occurrence of Ca2+ sparks in mammalian muscle fibres because of disruption of the normal control of RYR1 by CaV1.1 (Csernoch, 2007). Absolute mean values for peak amplitude and FWHM in the x and y direction of events measured in the present study in KI fibres were similar to those of events measured with the indicator fluo‐3 in saponin‐permeabilized muscle fibres from control mice (1.07 vs. 1.13 F 0, 1.94 vs. 1.92 μm and 1.79 vs. 1.76 μm in KI and in permeabilized fibres, respectively, Rodriguez et al. 2014). This may be taken as an indication that a similar mechanism was involved, further promoting the possibility that, despite a normal t‐tubule network, RYR1 channels in the KI fibres exhibit an enhanced disposition for being activated by Ca2+. The frequency of Ca2+ sparks reported in the present study in intact KI fibres was one order of magnitude (∼30 times) lower than that reported in permeabilized mouse fibres (Rodriguez et al. 2014). Because saponin permeabilization is certainly promoting extensive disruption of RYR1 channel activity control by t‐tubule CaV1.1s, the present disease situation appears to be intermediate between the extreme (permeabilized fibres) and the normal (WT) situation. Finally, it is also worth noting that the present model corresponds to the second disease situation promoting spontaneous local Ca2+ release events in intact mammalian muscle fibres. Indeed, aberrant expression of the CaV1.1e splice variant, which correlates with muscle weakness in myotonic dystrophy, is also associated with presence of such events (Sultana et al. 2016). Accordingly, it is possible that the occurrence of Ca2+ sparks in intact mammalian muscle fibres is a feature of other muscle disease conditions and that the spark frequency correlates with the extent of loss of normal control of Ca2+ release by t‐tubule voltage and thus with the potential severity of altered EC coupling function. In the present disease model, this Ca2+ spark activity may have contributed to the increased resting Ca2+ level reported by Durieux et al. (2010a). Conversely, however, there is a low possibility that it affects the SR calcium content. Based on morphological observations and size of sparks, an upper limit of ∼4 μm2 can be assumed for the area that contains one release site in an x,y image of a fibre. Because the area of the entire fibre is ∼3000–4000 μm2 in the image, there are close to 1000 release sites per image. If it is assumed that a spark fully depletes its local SR, the total depletion would be the number of sparks per image divided by the number of release sites in the image. Because the average number of sparks per image in DNM2 KI fibres is less than 10, the overall depletion in the SR would be less than 1%.
In conclusion, the results of the present study demonstrate that altered SR Ca2+ release probably contributes to the muscle weakness associated with the Dnm2 R465W CNM mutation. Detailed features of the defects are similar to those observed in MTM1‐deficient muscle. However, overall preserved t‐tubule architecture and a more limited extent of Ca2+ release depression probably make a major contribution to the milder severity of the DNM2 disease compared to MTM1‐related CNM. Still, many problems remain unresolved, such as how phosphoinositide 3‐kinase inhibition has a beneficial effect in MTM1‐deficient muscle (Kutchukian et al. 2016) and whether it would also do so in models of DNM2‐associated CNM. Overall, a detailed understanding of how DNM2 is involved in the regulation of Ca2+ homeostasis and EC coupling will require further studies, which will also probably need to take into account the role of other proteins, including N‐WASP (Falcone et al. 2014) and SPEG (Agrawal et al. 2014).
Additional information
Competing interests
The authors declare that they have no competing financial interests.
Author contributions
Single muscle fibre experiments were performed at Institut NeuroMyoGène, University Claude Bernard, Lyon 1. Fibre typing and immunoblot measurements were performed at the Research Centre for Myology, UPMC Univ Paris 06. Marc B and PG designed and generated the KI‐Dnm2 R465W mouse model. Marc B and VJ designed the study. CK and VJ performed the electrophysiological and confocal imaging experiments. Marc B, Maud B and DT performed the MyHC and immunoblot experiments and conducted the analysis. CK, PS, BA, DT, Maud B, CB, YT, LC, Marc B and VJ contributed to the analysis and interpretation of data, as well as to the critical revisions of the manuscript. PS and LC specifically performed the calcium spark analysis. All authors approved the final version of the manuscript, agree to be accountable for all aspects of the work in ensuring that questions related to the accuracy or integrity of any part of the work are appropriately investigated and resolved. All persons designated as authors qualify for authorship, and all those who qualify for authorship are listed.
Funding
This work was supported by grants from CNRS, INSERM, the Université Claude Bernard – Lyon 1 and the Association Française contre les Myopathies (AFM‐Téléthon: Alliance MyoNeurALP program) to the Institut NeuroMyoGène, as well as by the Hungarian National Research, Development and Innovation Office (NKFIH NK‐115461 to LC) and the Agence Nationale de la Recherche (grant ANR‐14‐CE12‐0009 to MB), and also by a grant from the Société Française de Myologie (SFM) (to CK).
Acknowledgements
We thank the Pitié‐Salpêtrière Imaging Platform (PICPS) for providing light microscopy imaging facilities.
Edited by: Don Bers & Michael Shattock
References
- Agrawal PB, Pierson CR, Joshi M, Liu X, Ravenscroft G, Moghadaszadeh B, Talabere T, Viola M, Swanson LC, Haliloğlu G, Talim B, Yau KS, Allcock RJ, Laing NG, Perrella MA & Beggs AH (2014). SPEG interacts with myotubularin, and its deficiency causes centronuclear myopathy with dilated cardiomyopathy. Am J Hum Genet 95, 218–226. [DOI] [PMC free article] [PubMed] [Google Scholar]
- Al‐Qusairi L, Weiss N, Toussaint A, Berbey C, Messaddeq N, Kretz C, Sanoudou D, Beggs AH, Allard B, Mandel JL, Laporte J, Jacquemond V & Buj‐Bello A (2009). T‐tubule disorganization and defective excitation‐contraction coupling in muscle fibers lacking myotubularin lipid phosphatase. Proc Natl Acad Sci USA 106, 18763–18768. [DOI] [PMC free article] [PubMed] [Google Scholar]
- Bitoun M, Maugenre S, Jeannet PY, Lacène E, Ferrer X, Laforêt P, Martin JJ, Laporte J, Lochmüller H, Beggs AH, Fardeau M, Eymard B, Romero NB & Guicheney P (2005). Mutations in dynamin 2 cause dominant centronuclear myopathy. Nat Genet 37, 1207–1209. [DOI] [PubMed] [Google Scholar]
- Bitoun M, Bevilacqua JA, Prudhon B, Maugenre S, Taratuto AL, Monges S, Lubieniecki F, Cances C, Uro‐Coste E, Mayer M, Fardeau M, Romero NB & Guicheney P (2007). Dynamin 2 mutations cause sporadic centronuclear myopathy with neonatal onset. Ann Neurol 62, 666–670. [DOI] [PubMed] [Google Scholar]
- Böhm J, Biancalana V, Dechene ET, Bitoun M, Pierson CR, Schaefer E, Karasoy H, Dempsey MA, Klein F, Dondaine N, Kretz C, Haumesser N, Poirson C, Toussaint A, Greenleaf RS, Barger MA, Mahoney LJ, Kang PB, Zanoteli E, Vissing J, Witting N, Echaniz‐Laguna A, Wallgren‐Pettersson C, Dowling J, Merlini L, Oldfors A, Bomme Ousager L, Melki J, Krause A, Jern C, Oliveira AS, Petit F, Jacquette A, Chaussenot A, Mowat D, Leheup B, Cristofano M, Poza Aldea JJ, Michel F, Furby A, Llona JE, Van Coster R, Bertini E, Urtizberea JA, Drouin‐Garraud V, Béroud C, Prudhon B, Bedford M, Mathews K, Erby LA, Smith SA, Roggenbuck J, Crowe CA, Brennan Spitale A, Johal SC, Amato AA, Demmer LA, Jonas J, Darras BT, Bird TD, Laurino M, Welt SI, Trotter C, Guicheney P, Das S, Mandel JL, Beggs AH & Laporte J (2012). Mutation spectrum in the large GTPase dynamin 2, and genotype‐phenotype correlation in autosomal dominant centronuclear myopathy. Hum Mutat 33, 949–959. [DOI] [PMC free article] [PubMed] [Google Scholar]
- Buj‐Bello A, Laugel V, Messaddeq N, Zahreddine H, Laporte J, Pellissier JF & Mandel JL (2002). The lipid phosphatase myotubularin is essential for skeletal muscle maintenance but not for myogenesis in mice. Proc Natl Acad Sci USA 99, 15060–15065. [DOI] [PMC free article] [PubMed] [Google Scholar]
- Cao H, Garcia F & McNiven MA (1998). Differential distribution of dynamin isoforms in mammalian cells. Mol Biol Cell 9, 2595–2609. [DOI] [PMC free article] [PubMed] [Google Scholar]
- Chin YH, Lee A, Kan HW, Laiman J, Chuang MC, Hsieh ST & Liu YW (2015). Dynamin‐2 mutations associated with centronuclear myopathy are hypermorphic and lead to T‐tubule fragmentation. Hum Mol Genet 24, 5542–5554. [DOI] [PubMed] [Google Scholar]
- Cowling BS, Chevremont T, Prokic I, Kretz C, Ferry A, Coirault C, Koutsopoulos O, Laugel V, Romero NB & Laporte J (2014). Reducing dynamin 2 expression rescues X‐linked centronuclear myopathy. J Clin Invest 124, 1350–1363. [DOI] [PMC free article] [PubMed] [Google Scholar]
- Cowling BS, Toussaint A, Amoasii L, Koebel P, Ferry A, Davignon L, Nishino I, Mandel JL & Laporte J (2011). Increased expression of wild‐type or a centronuclear myopathy mutant of dynamin 2 in skeletal muscle of adult mice leads to structural defects and muscle weakness. Am J Pathol 178, 2224–2235. [DOI] [PMC free article] [PubMed] [Google Scholar]
- Cowling BS, Toussaint A, Muller J & Laporte J (2012). Defective membrane remodeling in neuromuscular diseases: insights from animal models. PLoS Genet 8, e1002595. [DOI] [PMC free article] [PubMed] [Google Scholar]
- Csernoch L (2007). Sparks and embers of skeletal muscle: the exciting events of contractile activation. Pflügers Archiv 454, 869–878. [DOI] [PubMed] [Google Scholar]
- Csernoch L, Pouvreau S, Ronjat M & Jacquemond V (2008). Voltage‐activated elementary calcium release events in isolated mouse skeletal muscle fibers. J Membr Biol 226, 43–55. [DOI] [PMC free article] [PubMed] [Google Scholar]
- Di Biase V, Tuluc P, Campiglio M, Obermair GJ, Heine M & Flucher BE (2011). Surface traffic of dendritic CaV1.2 calcium channels in hippocampal neurons. J Neurosci 31, 13682–13694. [DOI] [PMC free article] [PubMed] [Google Scholar]
- Dulhunty AF, Wei‐LaPierre L, Casarotto MG & Beard NA (2017). Core skeletal muscle ryanodine receptor calcium release complex. Clin Exp Pharmacol Physiol 44, 3–12. [DOI] [PubMed] [Google Scholar]
- Durieux AC, Prudhon B, Guicheney P & Bitoun M (2010b). Dynamin 2 and human diseases. J Mol Med 88, 339–350. [DOI] [PubMed] [Google Scholar]
- Durieux AC, Vassilopoulos S, Lainé J, Fraysse B, Briñas L, Prudhon B, Castells J, Freyssenet D, Bonne G, Guicheney P & Bitoun M (2012). A centronuclear myopathy–dynamin 2 mutation impairs autophagy in mice. Traffic 13, 869–879. [DOI] [PubMed] [Google Scholar]
- Durieux AC, Vignaud A, Prudhon B, Viou MT, Beuvin M, Vassilopoulos S, Fraysse B, Ferry A, Lainé J, Romero NB, Guicheney P & Bitoun M (2010a). A centronuclear myopathy‐dynamin 2 mutation impairs skeletal muscle structure and function in mice. Hum Mol Genet 19, 4820–4836. [DOI] [PubMed] [Google Scholar]
- Falcone S, Roman W, Hnia K, Gache V, Didier N, Lainé J, Auradé F, Marty I, Nishino I, Charlet‐Berguerand N, Romero NB, Marazzi G, Sassoon D, Laporte J & Gomes ER (2014). N‐WASP is required for amphiphysin‐2/BIN1‐dependent nuclear positioning and triad organization in skeletal muscle and is involved in the pathophysiology of centronuclear myopathy. EMBO Mol Med 6, 1455–1475. [DOI] [PMC free article] [PubMed] [Google Scholar]
- Fraysse B, Guicheney P & Bitoun M (2016). Calcium homeostasis alterations in a mouse model of the dynamin 2‐related centronuclear myopathy. Biol Open 5, 1691–1696. [DOI] [PMC free article] [PubMed] [Google Scholar]
- Grundy D (2015). Principles and standards for reporting animal experiments in The Journal of Physiology and Experimental Physiology . J Physiol 593, 2547–2549. [DOI] [PMC free article] [PubMed] [Google Scholar]
- Hohendahl A, Roux A & Galli V (2016). Structural insights into the centronuclear myopathy‐associated functions of BIN1 and dynamin 2. J Struct Biol 196, 37–47. [DOI] [PMC free article] [PubMed] [Google Scholar]
- Hong T, Yang H, Zhang SS, Cho HC, Kalashnikova M, Sun B, Zhang H, Bhargava A, Grabe M, Olgin J, Gorelik J, Marbán E, Jan LY & Shaw RM (2014). Cardiac BIN1 folds T‐tubule membrane, controlling ion flux and limiting arrhythmia. Nat Med 20, 624–632. [DOI] [PMC free article] [PubMed] [Google Scholar]
- Jacquemond V (1997). Indo‐1 fluorescence signals elicited by membrane depolarization in enzymatically isolated mouse skeletal muscle fibers. Biophys J 73, 920–928. [DOI] [PMC free article] [PubMed] [Google Scholar]
- Jeub M, Bitoun M, Guicheney P, Kappes‐Horn K, Strach K, Druschky KF, Weis J & Fischer D (2008). Dynamin 2‐related centronuclear myopathy: clinical, histological and genetic aspects of further patients and review of the literature. Clin Neuropathol 27, 430–438. [DOI] [PubMed] [Google Scholar]
- Jungbluth H & Gautel M (2014). Pathogenic mechanisms in centronuclear myopathies. Front Aging Neurosci 6, 339. [DOI] [PMC free article] [PubMed] [Google Scholar]
- Kutchukian C, Lo Scrudato M, Tourneur Y, Poulard K, Vignaud A, Berthier C, Allard B, Lawlor MW, Buj‐Bello A & Jacquemond V (2016). Phosphatidylinositol 3‐kinase inhibition restores Ca2+ release defects and prolongs survival in myotubularin‐deficient mice. Proc Natl Acad Sci USA 113, 14432–14437. [DOI] [PMC free article] [PubMed] [Google Scholar]
- Laporte J, Hu LJ, Kretz C, Mandel JL, Kioschis P, Coy JF, Klauck SM, Poustka A & Dahl N (1996). A gene mutated in X‐linked myotubular myopathy defines a new putative tyrosine phosphatase family conserved in yeast. Nat Genet 13, 175–182. [DOI] [PubMed] [Google Scholar]
- Lee E, Marcucci M, Daniell L, Pypaert M, Weisz OA, Ochoa GC, Farsad K, Wenk MR & De Camilli P (2002). Amphiphysin 2 (Bin1) and T‐tubule biogenesis in muscle. Science 297, 1193–1196. [DOI] [PubMed] [Google Scholar]
- Lefebvre R, Legrand C, González‐Rodríguez E, Groom L, Dirksen RT & Jacquemond V (2011). Defects in Ca2+ release associated with local expression of pathological ryanodine receptors in mouse muscle fibres. J Physiol 589, 5361–5382. [DOI] [PMC free article] [PubMed] [Google Scholar]
- Lefebvre R, Pouvreau S, Collet C, Allard B & Jacquemond V (2014). Whole‐cell voltage clamp on skeletal muscle fibers with the silicone‐clamp technique. Methods Mol Biol 1183, 159–170. [DOI] [PubMed] [Google Scholar]
- Nicot AS, Toussaint A, Tosch V, Kretz C, Wallgren‐Pettersson C, Iwarsson E, Kingston H, Garnier JM, Biancalana V, Oldfors A, Mandel JL & Laporte J (2007). Mutations in amphiphysin 2 (BIN1) disrupt interaction with dynamin 2 and cause autosomal recessive centronuclear myopathy. Nat Genet 39, 1134–1139. [DOI] [PubMed] [Google Scholar]
- Pouvreau S, Csernoch L, Allard B, Sabatier JM, De Waard M, Ronjat M & Jacquemond V (2006). Transient loss of voltage control of Ca2+ release in the presence of maurocalcine in skeletal muscle. Biophys J 91, 2206–2215. [DOI] [PMC free article] [PubMed] [Google Scholar]
- Ríos E, Pizarro G & Stefani E (1992). Charge movement and the nature of signal transduction in skeletal muscle excitation‐contraction coupling. Annu Rev Physiol 54, 109–133. [DOI] [PubMed] [Google Scholar]
- Rodríguez EG, Lefebvre R, Bodnár D, Legrand C, Szentesi P, Vincze J, Poulard K, Bertrand‐Michel J, Csernoch L, Buj‐Bello A & Jacquemond V (2014). Phosphoinositide substrates of myotubularin affect voltage‐activated Ca²⁺ release in skeletal muscle. Pflügers Archiv 466, 973–985. [DOI] [PubMed] [Google Scholar]
- Royer B, Hnia K, Gavriilidis C, Tronchère H, Tosch V & Laporte J (2013). The myotubularin‐amphiphysin 2 complex in membrane tubulation and centronuclear myopathies. EMBO Rep 14, 907–915. [DOI] [PMC free article] [PubMed] [Google Scholar]
- Shirokova N, García J & Ríos E (1998). Local calcium release in mammalian skeletal muscle. J Physiol 512, 377–384. [DOI] [PMC free article] [PubMed] [Google Scholar]
- Schneider MF (1994). Control of calcium release in functioning skeletal muscle fibers. Annu Rev Physiol 56, 463–484. [DOI] [PubMed] [Google Scholar]
- Sultana N, Dienes B, Benedetti A, Tuluc P, Szentesi P, Sztretye M, Rainer J, Hess MW, Schwarzer C, Obermair GJ, Csernoch L & Flucher BE (2016). Restricting calcium currents is required for correct fiber type specification in skeletal muscle. Development 143, 1547–1559. [DOI] [PMC free article] [PubMed] [Google Scholar]
- Szabó LZ, Vincze J, Csernoch L & Szentesi P (2010). Improved spark and ember detection using stationary wavelet transforms. J Theor Biol 264, 1279–1292. [DOI] [PubMed] [Google Scholar]
- Tjondrokoesoemo A, Park KH, Ferrante C, Komazaki S, Lesniak S, Brotto M, Ko JK, Zhou J, Weisleder N & Ma J (2011). Disrupted membrane structure and intracellular Ca²⁺ signaling in adult skeletal muscle with acute knockdown of Bin1. PLoS ONE 6, e25740. [DOI] [PMC free article] [PubMed] [Google Scholar]
- Yang T, Xu X, Kernan T, Wu V & Colecraft HM (2010). Rem, a member of the RGK GTPases, inhibits recombinant CaV1.2 channels using multiple mechanisms that require distinct conformations of the GTPase. J Physiol 588, 1665–1681. [DOI] [PMC free article] [PubMed] [Google Scholar]
- Zhou J, Yi J, Royer L, Launikonis BS, González A, García J & Ríos E (2006). A probable role of dihydropyridine receptors in repression of Ca2+ sparks demonstrated in cultured mammalian muscle. Am J Physiol Cell Physiol 290, C539–C553. [DOI] [PubMed] [Google Scholar]