

Abstract
Some powered hand tools can generate significant vibration at frequencies below 25 Hz. It is not clear whether such vibration can be effectively transmitted to the upper arm, shoulder, neck, and head and cause adverse effects in these substructures. The objective of this study is to investigate the vibration transmission from the human hands to these substructures. Eight human subjects participated in the experiment, which was conducted on a 1-D vibration test system. Unlike many vibration transmission studies, both the right and left hand-arm systems were simultaneously exposed to the vibration to simulate a working posture in the experiment. A laser vibrometer and three accelerometers were used to measure the vibration transmitted to the substructures. The apparent mass at the palm of each hand was also measured to help in understanding the transmitted vibration and biodynamic response. This study found that the upper arm resonance frequency was 7–12 Hz, the shoulder resonance was 7–9 Hz, and the back and neck resonances were 6–7 Hz. The responses were affected by the hand-arm posture, applied hand force, and vibration magnitude. The transmissibility measured on the upper arm had a trend similar to that of the apparent mass measured at the palm in their major resonant frequency ranges. The implications of the results are discussed.
Relevance to industry
Musculoskeletal disorders (MSDs) of the shoulder and neck are important issues among many workers. Many of these workers use heavy-duty powered hand tools. The combined mechanical loads and vibration exposures are among the major factors contributing to the development of MSDs. The vibration characteristics of the body segments examined in this study can be used to help understand MSDs and to help develop more effective intervention methods.
Keywords: Hand-arm vibration, Hand-transmitted vibration, Shoulder, Neck, Head
1. Introduction
Wrist, elbow, shoulder, and neck disorders are among the major components of upper extremity musculoskeletal disorders (MSDs) (Bernard, 1997; NRC, 2001). They remain major occupational diseases for further studies (Linaker and Walker-Bone, 2015). The use of vibrating hand tools or vibration exposure is one of the primary work-related factors of these disorders (Bovenzi et al., 1987; Gemne and Saraste, 1987; Van der Windt et al., 2000; Ariens et al., 2000; Miranda et al., 2008). This may be because the vibration exposure can affect joint mechanical stability and muscle activities (Rohmert et al., 1989; Romaiguère et al., 1993). Large vibrations or shocks may also cause injuries of the hard tissues and soft tissues of these joint structures. While the exact roles of vibration in the development of these MSDs remain unclear, a reliable dose-response relationship between the disorders and the vibration exposure has not been established (Bovenzi et al.,1987; Gemne and Saraste,1987; Bovenzi, 1998). Further studies are also required to develop more effective methods for preventing these disorders.
Biomechanical stimuli such as stresses and strains of biological tissues are essential factors that control the growth, remodeling, and morphogenesis of a biological system (Taber, 1995). Vibration-induced stresses, strains, and power absorptions of the tissues are part of the biomechanical stimuli. While it is very difficult to directly measure these vibration stimuli, they are usually estimated using biodynamic models developed based on measurable response functions such as vibration transmissibility and driving-point response functions (apparent mass and mechanical impedance) of the hand-arm system (Wu et al., 2010). Therefore, the measurements and analyses of these biodynamic response functions are important steps towards understanding vibration-induced MSDs. These response functions are also very important for designing, analyzing, and testing tools and vibration-reducing devices.
Many studies have investigated the driving-point response functions of the hand-arm system (Gurram et al., 1995; Marcotte et al., 2005; Kihlberg, 1995; Dong et al., 2008, 2013a). Other studies have also measured the vibration transmissibility at the wrist, elbow, forearm, and upper arm (Pyykko et al., 1976; Reynolds and Angevine, 1977; Aatola, 1989; Gurram et al., 1994; Adewusi et al., 2010; Thomas and Beauchamp, 1998; Xu et al., 2009, 2015; Welcome et al., 2015; Marchetti et al., 2015). The theoretical relationship between the transmissibility and the driving-point response functions have also been described (Dong et al., 2013b). These studies have provided some useful knowledge of the responses of the hand-arm system to vibration. For example, while the palm-wrist-forearm-elbow-upper arm-shoulder subsystem theoretically has an infinite number of natural frequencies, only a few major resonances can be consistently observed in the reported experimental data. Unlike the resonances of many metal structures, the transmissibility resonances of the hand-arm system are not sharp and the peak transmissibility value is usually less than 3.0. These phenomena indicate that the hand-arm system exhibits large damping properties that effectively suppress the vast majority of the resonances. These natural properties can help protect the hand-arm system from damage or injuries. However, it is still desired to avoid the remaining hand-arm resonances to protect the system from potentially-harmful vibration exposures. One of the major remaining resonances usually occurs in the range of 20–40 Hz. It can be clearly identified from the vibration transmissibility measured at the wrist, forearm, and elbow (Thomas and Beauchamp, 1998; Xu et al., 2009, 2015; Welcome et al., 2015; Marchetti et al., 2015). It can also be clearly observed in the impedance data, but the impedance resonant frequency is higher than the transmissibility or apparent mass resonant frequency; the impedance is equal to the apparent mass multiplied by the frequency. This resonant frequency depends primarily on the palm contact stiffness and the effective mass of the palm-wrist-forearm substructures (Dong et al., 2008). This explains why the specific resonant frequency is primarily affected by the palm contact force, hand and arm postures, handle geometry, vibration direction, and dynamic properties of the individual. A vibration-reducing glove basically reduces the palm contact stiffness and the related resonant frequency (Dong et al., 2009). This explains why the vibration-reducing effectiveness of such gloves is usually limited to vibration frequencies above 25 Hz, as observed in the transmissibility spectra of gloves (Welcome et al., 2012; McDowell et al., 2013). Another important resonant frequency is usually observed in the range of 8–12.5 Hz (Marchetti et al., 2015; Adewusi et al., 2010; Xu et al., 2015), the specific value of which also depends primarily on the above-mentioned influencing factors. It can be clearly identified from the vibration transmissibility spectra measured at the upper arm, elbow, and wrist, as well as the apparent mass measured at the palm of the hand (Adewusi et al., 2010; Marchetti et al., 2015; Xu et al., 2015). The independence from the measurement location indicates that this resonance is a global resonance of the entire hand-arm system, although the resonance is most obvious in the upper arm (Adewusi et al., 2010; Xu et al., 2015). Coincidently, the highest frequency weighting defined in the current standard for risk assessments of hand-transmitted vibration exposures occurs at 12.5 Hz (ISO 5349-1, 2001), which is at the upper boundary of this frequency range. This suggests that the vibration perception of the entire hand-arm system is largely influenced by the overall biodynamic response of the system, as the frequency weighting function is derived primarily based on the equal sensation contours of the vibration perception of the entire hand-arm system (Miwa, 1967; Brammer, 1986). It is hypothesized that the resonances of the shoulder, back, neck, and head to hand-transmitted vibration occur at lower magnitudes at lower frequencies, as these locations are farther from the vibration excitation location, and these substructures have larger effective masses and constraints than the hand-arm system. However, very limited data of the transmissibility at these locations have been reported (Sakakibara et al., 1986; Odenwalda and Krumma, 2014). The specific vibration response characteristics at these locations remain either unclear or unknown.
As the first step to enhance the understanding of the vibration effects on the shoulder and neck MSDs, the objective of this study is to investigate the vibration transmission from both hands to the upper arms, shoulders, back, neck, and head. The apparent mass at the palm of the hand, which should be closely related to the transmissibility on these substructures according to the relationship theorem (Dong et al., 2013b), are also measured. The implications of the experimental results are discussed.
2. Method
2.1. Experimental instrumentation
The experiment was conducted on a 1-D Hand-Arm Vibration Test System (MB Dynamics). The vibration was delivered to the hands along the forearm direction (Z axis) through symmetrical, dual instrumented handles. A pictorial view of the instrumentation setup and subject posture during the experiment is shown in Fig. 1 (a). The left and right instrumented handles were equipped with tri-axial accelerometers (PCB 356A12 and Endevco 65–100, respectively) for measuring input acceleration. A pair of force sensors (Kistler 9212) were attached in each handle to measure the grip force from each hand. A force plate (Kistler, 9286AA) was used to measure the push force applied to the handles. The applied and target grip and push forces were displayed on two virtual dial gauges on a monitor to guide the subject in controlling the hand forces. A 3-D scanning laser vibrometer (Polytec, PSV-500) was used to measure vibration on the subject’s skin at five locations distributed on the upper arm, shoulder, back, and neck. To enhance the signal quality, retro-reflective tape was applied on the skin at each of the measurement locations. In order to measure the vibration transmitted to three locations not accessible to the laser vibrometer (i.e., both wrists and the forehead), three accelerometer instrumented adapters were also used. These three adapters were fabricated using different materials based on the geometric design recommended in the standardized glove test (ISO 10819, 1998) and evaluated in a previous study (Xu et al., 2015). As shown in Fig. 1(b), Adapter A was made of magnesium; Adapter B was made of wood; and Adapter C was made of polylactic acid (PLA) using a 3-D printer. The adapters A, B, and C were equipped with tri-axial accelerometers (Endevco, M35A) and weighed 13 g, 15 g, and 7 g, respectively. The same adapters were attached to the same locations for all the subjects and trials.
Fig. 1.

Pictorial views of the instrumentation setup, a test subject with one of the two arm postures, and the adapters. (a) Retro-reflective tape was attached to the skin at 5 measurement locations for laser measurements. Transmissibility to the wrists and head were measured with three tri-axial accelerometer-equipped adapters. (b) The three adapters that were used during the experiments.
Broadband random vibrations from 4 to 100 Hz were used as the excitations. Vibration at frequencies above 100 Hz cannot be effectively transmitted to the human arms and upper body. In addition, powered hand tools do not usually generate substantial vibrations below 5 Hz, and the standard method for hand-transmitted vibration exposure risk assessment focuses on frequencies above 5 Hz (ISO 5349-1, 2001). Therefore, this study investigated the vibration transmissibility in the frequency range between 4 and 100 Hz. The vibration signals measured with the 3-D laser vibrometer were acquired, analyzed, and stored using the vibrometer system’s PSV software. The vibration transmissibility frequency spectra were presented in equal band. The simultaneously measured vibration data from the adapters, as well as the grip force from both hands were input into a separate data acquisition system (B&K 3032A) and analyzed using B&K Pulse software. The transmissibility and biodynamic responses were obtained and expressed in one-third octave bands with center frequencies from 4 to 400 Hz.
2.2. Subjects and measurement procedures
A total of eight healthy adults (six males and two females) participated in this study. Their major anthropometrics are listed in Table 1. The study protocol was reviewed and approved by the NIOSH Human Subjects Review Board.
Table 1.
Anthropometry data of the subjects in the vibration experiments (hand length = tip of middle finger to crease at wrist; hand breadth = the width measured at metacarpal; hand/forearm/arm volume = volume of water displaced by immersion).
| Subject | Height (cm) | Weight (kg) | Hand length (mm) | Hand breadth (mm) | Hand volume (ml) | Forearm volume (ml) | Arm volume (ml) | Dominant hand |
|---|---|---|---|---|---|---|---|---|
| 1 | 177.80 | 77.11 | 194 | 101 | 350 | 1315 | 3200 | R |
| 2 | 176.53 | 77.11 | 198 | 110 | 420 | 1660 | 3690 | R |
| 3 | 182.25 | 65.32 | 196 | 103 | 372 | 1295 | 2855 | R |
| 4 | 187.96 | 81.65 | 195 | 102 | 380 | 1410 | 3575 | R |
| 5 | 182.88 | 84.82 | 192 | 106 | 480 | 1550 | 3695 | R |
| 6 | 157.48 | 56.70 | 182 | 97 | 290 | 1115 | 2345 | L |
| 7 | 180.34 | 88.09 | 204 | 114 | 470 | 1805 | 4000 | R |
| 8 | 175.26 | 88.45 | 189 | 110 | 395 | 1585 | 4110 | R |
| Mean | 177.56 | 77.41 | 193.75 | 105.38 | 394.63 | 1466.88 | 3433.75 | |
| SD | 10.61 | 10.67 | 6.48 | 5.66 | 62.42 | 224.29 | 598.43 |
As shown in Fig. 1(a), each subject used both hands to grip and push on the handles fixed on the 1-D vibration test system. The subject was instructed to grip the handle with the forearm parallel to the floor and aligned with the Z axis, and two arm postures with elbow bending angles of 90° and 120° were examined in this study. Fig. 1(a) shows one posture with the 120° elbow bending angle. Three levels of push force were tested (50 N, 75 N, and 100 N), while the grip force for each hand was kept at 10 N. Therefore, during each test trial, the subject exerted the target grip force combined with one of the randomized push force levels and with one of the selected postures. Two replicate trials were performed for each force and posture combination. In order to evaluate the effect of input vibration magnitude on transmissibility, two levels of input vibration were utilized as excitations. The spectra of these two input vibrations are shown in Fig. 2. The comparatively higher level vibration at 1.1 g was the main excitation, all 12 treatments (3 force level × 2 posture × 2 replicates) were tested with this input. The lower level vibration at 0.6 g was only tested with 4 treatments (75 N push force × 2 posture × 2 replicates).
Fig. 2.
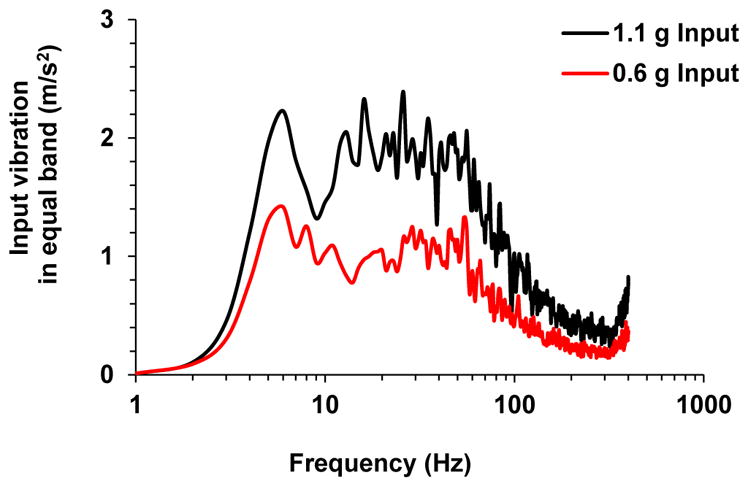
Input vibration spectra.
After signing the consent form, the subject was first trained to control the target grip and push forces, especially under vibration conditions. Then, the three adapters were attached to both wrists and to the forehead of the subject using elastic cloth bands. A medium level of attachment tightness was applied based on the recommendation from a previous study (Xu et al., 2015). To maintain relatively consistent attachment forces, the same researcher attached the elastic cloths for all adapters and subjects. During each trial, data acquisition started when the subject reached and maintained a constant grip and push force. The laser vibrometer scanned through the 5 predefined measurement points in the sequences listed in Fig. 1(a). The three adapters simultaneously recorded the vibration transmissibility to both wrists and the forehead. To ensure reliable measurements, the subject was instructed to maintain the assigned constant hand forces until completion of each trial. The actual measuring duration may vary with each trial, which depends on the measurement efficiency at each point with the scanning laser vibrometer. It was observed that the measurement at each scanning point took about 15–20 s, which varied with subjects and the specific measuring points. Therefore, it took about 60 seconds to complete the measurements in each trial. Two minutes of rest were taken between trials to avoid fatigue.
In addition to vibration transmissibility, the apparent mass at the palm of the hand along the forearm direction was also simultaneously measured using a method reported before (Dong et al., 2006). The duration of the apparent mass measurement was 20 s, which allowed at least two measurements during each trial. The results of the two measurements were averaged and used to represent the apparent mass for each trial.
2.3. Calculation of vibration transmissibility
This study used the same concept as that used to compute glove vibration transmissibility in the standard glove test (ISO 10819, 2013). The transmissibility in each of the three directions was defined as:
| (1) |
| (2) |
where Ai_R_Handle is the input acceleration in each direction measured with the tri-axial accelerometer installed in the right handle; Ai_Adapter is the acceleration measured with the adapters; Ai_Laser is the acceleration measured using the laser. The total vibration transmissibility measured with the adapter or laser was computed from
| (3) |
First, the baseline transmissibility on the bare handle was measured with laser and adapter (Xu et al., 2015), and used to correct the transmissibility of the subjects. The calibrated subject transmissibility (Tr) was calculated using the baseline transmissibility (Tr_Baseline) and the directly-measured transmissibility (Tr_Subject), which is expressed as follows:
| (4) |
Tr_Baseline and Tr_Subject were calculated based on Eqs. (1)–(3).
2.4. Statistical analyses
Whenever applicable, a general linear model for the analysis of variance (ANOVA) was used to determine the significance of the effects of test conditions on the dependent variable (e.g., vibration magnitude, peak frequency, etc.). Whenever necessary, stratified ANOVAs were also performed to determine the significance of the factors on the vibrations in a specific frequency range. The ANOVAs were performed using SPSS statistical software (IBM SPSS Statistics, version 19.0). Differences were considered significant at the p < 0.05 level.
3. Results
3.1. Vibration transmissibility to different measurement locations
Figs. 3 and 4 show the averaged transmissibility to the wrists, arm, back of upper body, neck and head for 8 subjects under 6 different treatment conditions. The two plots in each row display a comparison of transmissibility for the different arm postures under the same grip and push forces, while the three plots in each column are the transmissibility with the same arm posture but different hand forces. The transmissibility spectra to both wrists and forehead were measured with 3 adapters and displayed in Fig. 3. Consistent with previous studies, the resonant frequency of the wrist transmissibility is at around 20 Hz, with a magnitude of around 2.0. Fig. 3 also clearly shows that in all six treatment conditions the resonant peak of the left wrist shifted toward a higher frequency with a slightly higher magnitude. The frequency shift is statistically significant (p < 0.001). The resonant frequency of the forehead may be in a lower frequency range than excited and collected. With our lowest input of 4 Hz, up to 50% of vibration was transmitted to the forehead. Fig. 5 shows the vibration transmissibility measured at the forehead in all 3 directions from one subject. Unlike the other measurement locations, the main vibration direction at forehead is in the global Y axis, not the Z axis, even though the Z axis is the direction of the vibration input.
Fig. 3.

The averaged total vibration transmissibility of the 8 subjects at the forehead and both wrists measured with the 3 adapters.
Fig. 4.

The averaged total vibration transmissibility of the 8 subjects at the neck (P1), back (P2 and P3), shoulder (P4), and upper arm (P5) measured with the 3-D laser vibrometer.
Fig. 5.
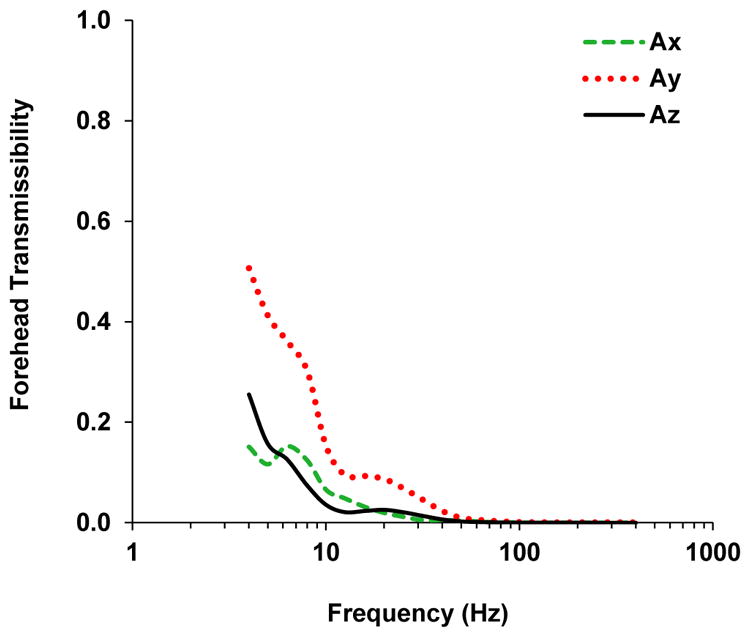
Transmissibility to the forehead in all three vibration directions measured from one subject.
The transmissibility spectra in Fig. 4 were measured with the 3-D laser vibrometer on the surfaces of the subject’s upper body. As expected, the transmissibility decreased with the increased distance from the vibrating source. The highest transmissibility is observed at the upper arm (P5), with a resonant peak of 1.5 and above at around 7–12 Hz. The shoulder (P4) transmissibility peak is approximately 0.5 at around 7–9 Hz. The other 3 locations at the back (P2 and P3) and neck (P1) show similar transmissibility spectra, with the resonant peaks of approximately 0.3 at around 6–7 Hz. The transmissibility spectra of P1 to P4 show two resonant peaks in most treatment conditions. The first peak somewhat aligns with the resonant peak of P5, while the second peak occurs around 16–20 Hz. The shoulder transmissibility (P4) clearly shows the second peak at all three push force levels, particularly for the arm posture of 120° elbow bending angle compared with the spectra of the 90° elbow posture. Similar second peaks are also clearly identified with the back and neck transmissibility (P1 to P3) under all 6 treatments. Compared with the averaged transmissibility in Fig. 4, detailed resonant peaks are shown from the transmissibility spectra of individual subjects. Fig. 6(a) shows an example plot of the transmissibility from a specific trial of one subject. The second resonant peak at around 20 Hz is shown in all 5 measurement locations, even though most of the subjects do not exhibit the second peak in the upper arm transmissibility. For some subjects, the transmissibility from the back and neck shows a higher second peak than the first peak. Fig. 6(b) displays back (P2) transmissibility from two individual subjects, one with the 90° elbow posture and the other with 120° elbow posture. Both of them exhibit a first peak at around 8–10 Hz, and a higher second peak at around 16–20 Hz.
Fig. 6.

3-D laser vibrometer measured total vibration transmissibility spectra of (a) one individual subject at all 5 measurement locations; (b) two subjects at the back of upper body (P2) with different arm postures.
3.2. Effect of push force
Fig. 7 displays the effect of hand force on the transmissibility, using the averaged shoulder (P4), upper arm (P5) and the right wrist transmissibility. Marginal differences were observed in averaged transmissibility with the same trend. The resonant peak frequency slightly shifted toward a higher frequency with the increased push force. In the transmissibility at the shoulder with the 120° elbow posture, such trends were observed with both peaks. Statistical analysis with the data from all subjects and trials shows that hand force is a statistically significant factor for peak frequency (p < 0.001). In terms of peak magnitude, increased push force slightly increased the peak magnitude with the 90° elbow posture. While with the 120° elbow posture, opposite results were obtained for shoulder and upper arm transmissibility. Hand force is also a statistically significant factor on peak magnitude (p < 0.008). Similar trends were also observed at the other measurement locations on the subjects’ back, neck, and head. Since the transmissibility at those locations were comparatively low, the force effect was barely recognized visually, and the results for those locations were excluded. For the same reason, we only used transmissibility at the shoulder, upper arm, and wrists when investigating other influencing factors. It is also important to note that when performing statistical analysis for all different influencing factors, subject and measurement location are always the top significant factors for both peak frequency and peak magnitude (p < 0.001). Trial sequence was not a significant factor.
Fig. 7.

Effect of push force on the averaged vibration transmissibility.
3.3. Effect of the arm posture
Fig. 8 presents the effect of arm posture on the averaged transmissibility at each push force level. Different effects are shown for different locations, although the differences are not statistically significant for either peak frequency or peak magnitude (p > 0.39). At the shoulder, the 90° elbow posture consistently displayed higher resonant peaks at all 3 push force levels. However at the upper arm, the 120° elbow posture showed either similar or slightly higher transmissibility at the resonant frequency range compared with the 90° elbow posture. Mixed effects were shown for the wrist transmissibility. In addition, the second resonant peaks are shown in all 3 force levels with 120° elbow posture for shoulder transmissibility, but not with 90° elbow posture and in upper arm and wrist transmissibility spectra.
Fig. 8.

Effect of arm posture on the averaged vibration transmissibility.
3.4. Effect of the magnitude of input vibration
Fig. 9 shows the changes of averaged transmissibility due to the differences of input vibration magnitude. With higher input vibration, the resonant peak frequency shifts slightly toward a lower frequency. The difference is statistically significant (p < 0.001). Such characteristics were not affected by arm posture or measurement location. The resonant peak magnitude is slightly increased with the increased input vibration at the shoulder and upper arm, but decreased at the wrist. However, such effects are not statistically significant (p > 0.05).
Fig. 9.

Effect of input vibration magnitude on the averaged vibration transmissibility.
3.5. Transmissibility and apparent mass
Fig. 10 shows the comparison between the transmissibility spectra measured on the upper arm with the apparent mass measured at the palm of the hand for each of the eight subjects. The mean transmissibility and mean apparent mass are also superimposed on each plot. These plots show the subjects’ responses to the vibration input in terms of both transmissibility and apparent mass. The correlation between transmissibility and apparent mass for most of the subjects can also be observed. Particularly, the mean transmissibility and mean apparent mass are highly correlated. The peak frequency of the mean transmissibility measured on the upper arm occurs at 10 Hz; the same peak frequency is also observed in the mean apparent mass.
Fig. 10.

Correlations of the upper arm transmissibility and apparent mass at the palm from the spectra of individual subjects and the mean of eight subjects.
4. Discussion
For the first time, the vibrations transmitted from the hands to the human back and neck were measured using a 3D laser vibrometer in this study. The vibrations transmitted to the head, upper arm, and wrist were also measured to help understand the transmitted vibrations. This study confirmed that the vibration transmission generally is reduced with the increase in distance from the hand interface with the vibration source. The frequency of primary concern for hand-transmitted vibration exposure starts at 6.3 Hz in the one-third octave bands (ISO 5349-1, 2001). At frequencies above 40 Hz, the average transmissibility measured on the upper arm, shoulder, back, neck, and head is generally less than 0.1, as shown in Figs. 3 and 4. Hence, the major frequencies of concern for these substructures are in the range of 6.3–40 Hz. The following discussions are focused on the responses in this frequency range.
4.1. Comparisons of the measured and reported transmissibility data
The vibration transmission in the hand-arm system and its biodynamic response are usually studied with one hand-arm system (i.e., left or right system). The current study considered the exposures of both the left and right hand-arm systems in the experiment, as shown in Fig. 1; this experimental setup provides a better simulation of the operations of heavy handheld tools such as road breakers, jack hammers, rock drills, and road tampers. The input excitations shown in Fig. 2, the exact hand-arm postures, and the applied hand forces were also different from the previous studies. These differences did not change the basic trends of the vibration spectra measured at the wrist and upper arm. This is demonstrated in Fig. 11, which shows the comparisons of the vibration transmissibility spectra measured at the right wrist and upper arm in the current study and those measured in a previous study (Xu et al., 2015). The consistent trends confirm that the one-arm test method used in the vast majority of the reported studies is acceptable for understanding the basic characteristics of the vibration transmission in the hand-arm system. However, there are differences in the magnitudes of the responses, also shown in Fig. 11. This suggests that the actual exposure conditions should be considered when the vibration transmissibility measured in the laboratory tests is used to predict or compare with the transmitted vibrations measured from tools at workplaces.
Fig. 11.

The averaged total transmissibility measured at the wrist and upper arm from a previous study (Xu et al., 2015) and the current study.
4.2. The influencing factors of the vibration transmission
The results of this study confirmed that many factors can affect the vibration transmission. Besides the measurement location and subject, this study examined the effects of excitation, hand force, and posture. Similar to that observed in the whole-body vibration response, increasing the input vibration magnitude slightly reduced the fundamental resonant peak frequency, as shown in Fig. 9. This is likely to be because the palm contact stiffness and the system mechanical properties exhibit some non-linear features (Dong et al., 2008). Increasing the applied hand force increased the peak frequency, as shown in Fig. 7. This is also because the contact stiffness and system stiffness generally increase with the increase in the applied force (Dong et al., 2008). The effect of the hand-arm posture on the vibration transmission is complex, which varied with the location on the system and the applied hand force, as shown in Fig. 8.
In principle, the vibration transmissibility spectra measured at the left and right wrists should be similar, as their structures are generally symmetrical. However, the results in Fig. 3 show some significant differences. The resonant peak frequency at the left wrist was observed at a higher frequency than the right wrist under all treatment conditions. Such a frequency shift might come from the unequal push force applied on the two handles. While the total push force was controlled, the force applied on each handle was not separately measured and controlled. The hand force control and display system was placed at the right side of the subject, the subject might lean his/her body more to the left to look at the displayed force. Such a posture might increase the push force and thus the peak frequency on the left hand.
A major cross-axis effect was observed on the response of the head, as shown in Fig. 5. The response in the vertical direction (Y) is much greater than that in the vibration input direction (Z). This is likely to be because the input vibration from the hands caused a rotational response of the head at the neck.
4.3. The vibration responses of the entire system
The theoretical relationship between the apparent mass of the hand-arm system and the vibration transmissibility distributed throughout the system can be expressed as follows (Dong et al., 2013b):
| (5) |
The apparent mass measured at the fingers (MFingers) is approximately equal to the first term on the right side of the equation, which is related to the transmissibility of the fingers; hence, these terms can be removed from Eq. (5). The transmissibility on the other body substructures that were not examined in this study is likely to be lower than that on the back, because these substructures are farther from the excitation than the back is. Their related term (Others) in the equation can thus be ignored. Then, Eq. (5) can be reduced as follows:
| (6) |
As an example, Fig. 12 shows the transmissibility functions measured on the substructures involved in Eq. (6), together with the corresponding apparent mass measured at the palm (M Palm). Practically, the transmissibility spectra measured at the wrist, upper arm, shoulder, back, neck, and head can be used to approximately represent TPalm–wrist–forearm, TUpper–arm, TShoulder, TBack, TNeck, and THead, respectively. Below 10 Hz, the transmissibility spectrum at the wrist is very similar to that on the upper arm, as shown in Fig. 12. This means that the wrist, forearm, and upper-arm move approximately together in the first resonant mode with its peak frequency near 10 Hz. The response of the shoulder also has a trend similar to that of the upper arm, which suggests that part of shoulder also moves together with the upper arm in the first resonant mode. Furthermore, the vibration magnitudes on these substructures are much larger than those on the back, neck, and head, as also shown in Fig. 12. As indicated by Eq. (6), the responses of these substructures must play a dominant role in determining the apparent mass measured at the palm in the first resonant mode. This explains why the transmissibility of the upper arm exhibits a trend very similar to that of the palm-measured apparent mass in the first resonance of the hand-arm system, as shown in Figs.10 and 12. Above 10 Hz, the trend of the transmissibility at the wrist becomes largely different from that of the upper arm. This significantly changes the trend of the palm-measured apparent mass at frequencies above 16 Hz. Also, as shown in Fig. 12, the apparent mass depends almost fully on the responses of the palm-wrist-forearm substructures at frequencies above 100 Hz when the transmissibility of other substructures can be ignored.
Fig. 12.
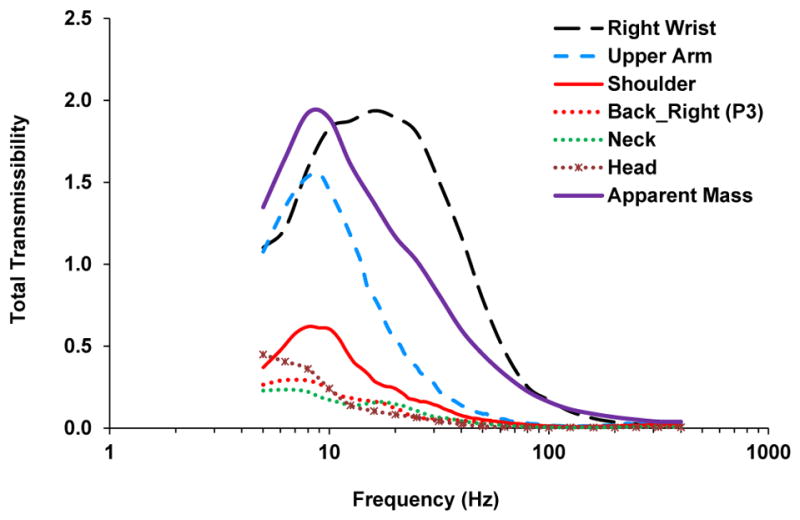
The averaged total transmissibility functions at six measurement locations and the apparent mass measured at the palm.
Furthermore, as shown in Fig. 12, the transmissibility values of the back, neck, and head are generally small, compared with those on the hand-arm system. The above analysis and discussion also suggest that the response of the back, neck, and head do not substantially affect the biodynamics of the hand-arm system in the entire frequency range of concern. However, the peak response may also cause some large vibration stresses and strains in the tissues of local substructures if the input vibration is substantial. This should also be avoided as much as possible.
4.4. Potential health effects of hand-transmitted vibration on the shoulder, back, neck, and head
A few studies reported that the vibration exposure transmitted from the hands to the head could be related to some auditory effect (Tirabasso et al., 2015; Pyykko et al., 1986, 1994). It remains unclear whether the hand-transmitted vibration could cause any significant health effects in the shoulder, back, neck, and head. The results of this study suggest that only low-frequency vibration can be partially transmitted to the shoulder, back, neck, and head. The effects of such exposures are likely to be combined with those of other biomechanical and ergonomic hazards. Hand-transmitted vibration exposure may also indirectly affect the development of these MSDs through increasing the biomechanical loads due to the increased controlling forces or overexertion under the vibration conditions.
Psychophysical studies found that the vibration sensation or perception is especially sensitive to low-frequency vibration exposures (Miwa, 1968; Morioka and Griffin, 2006). This is likely to be partially because there are some low-frequency resonances in the upper arm, shoulder, back, and neck, as shown in Fig. 4. The standardized frequency weighting for assessing the risk of hand-arm vibration syndrome is derived primarily based on the equal sensation contours of the vibration exposure (Brammer, 1986). As a result, this weighting emphasizes the effect of low-frequency vibrations. This suggests that the weighted acceleration may be used as a crude quantification of the vibration exposure in the shoulder, back, neck, and head. However, it may be more reliable to use the location-specific transmissibility as a weighting factor to quantify the location-specific vibration exposure for these substructures.
5. Conclusions
This study confirms that the hand-transmitted vibration transmissibility generally reduces with the increase in distance from the vibration source. The peak transmissibility values on the shoulder, back, neck, and head are generally less than 0.7, which are much less than those measured on the wrist and upper arm. Many factors such as vibration excitations, individual, applied hand forces, and hand-arm postures can significantly affect the biodynamic responses of these substructures. However, these factors do not change the basic trends of the responses, and their effects are generally marginal. The peak frequency of the vibration transmissibility on the upper arm is in the range of 7–12 Hz. It is 7–9 Hz on the shoulder, and 6–7 Hz on the back and neck. These peak frequencies at least partially explain why the most sensitive vibration sensation or perception to hand-transmitted vibration exposure is in the low-frequency range (<16 Hz). Because the current standardized frequency weighting function is defined primarily based on equal sensation contours, the large weighting factors are mostly in this frequency range. This also suggests that the frequency-weighted acceleration may be used as a crude approximation to quantify the vibration exposure of the shoulder, back, and neck. However, it may be more reliable to use the measured vibration transmissibility as a weighting function to estimate the vibration exposure of each of these substructures.
Footnotes
Disclaimer
The findings and conclusions in this paper are those of the authors and do not necessarily represent the official position of the National Institute for Occupational Safety & Health. The mention of trade names, commercial products, or organizations does not imply endorsement by the U.S. Government.
References
- Aatola S. Transmission of vibration to the wrist and comparison of frequency response function estimators. J Sound Vib. 1989;131:497–507. [Google Scholar]
- Adewusi SA, Rakheja S, Marcotte P, Boutin J. Vibration transmissibility characteristics of the human hand-arm system under different postures, hand forces and excitation levels. J Sound Vib. 2010;329:2953–2971. [Google Scholar]
- Ariens GA, Van Mechelen W, Bongers PM, Bouter LM, Van der Wal G. Physical risk factors for neck pain. Scan J Work Environ Health. 2000;26(1):7–19. doi: 10.5271/sjweh.504. [DOI] [PubMed] [Google Scholar]
- Bernard BP. Musculoskeletal Disorders and Workplace Factors. NIOSH; Cincinnati: 1997. A critical review of epidemiologic evidence for work-related musculoskeletal disorders of the neck, upper-extremity, and low back. DHHS (NIOSH) publication. [Google Scholar]
- Bovenzi M, Fiorito A, Volpe C. Bone and joint disorders in the upper extremities of chipping and grinding operators. Int Achieves Occup Environ Health. 1987;59:189–198. doi: 10.1007/BF00378496. [DOI] [PubMed] [Google Scholar]
- Bovenzi M. Exposure-response relationship in the hand-arm vibration syndrome: an overview of current epidemiology research. Int Arch Occup Environ Health. 1998;71(8):509–519. doi: 10.1007/s004200050316. [DOI] [PubMed] [Google Scholar]
- Brammer AJ. Dose-response relationship for hand-transmitted vibration. Scand J Work Environ Health. 1986;12:284–288. doi: 10.5271/sjweh.2139. [DOI] [PubMed] [Google Scholar]
- Dong RG, Welcome DE, McDowell TW, Wu JZ. Measurement of biodynamic response of human hand-arm system. J Sound Vib. 2006;294(4–5):807–827. [Google Scholar]
- Dong JH, Dong RG, Rakheja S, Welcome DE, McDowell TW, Wu JZ. A method for analyzing absorbed power distribution in the hand and arm substructures when operating vibrating tools. J Sound Vib. 2008;311:1286–1309. [Google Scholar]
- Dong RG, McDowell TW, Welcome DE, Warren C, Wu JZ, Rakheja S. Analysis of anti-vibration gloves mechanism and evaluation methods. J Sound Vib. 2009;321:435–453. [Google Scholar]
- Dong RG, Welcome DE, McDowell TW, Wu JZ. Modeling of the biodynamic responses distributed at the fingers and palm of the hand in three orthogonal directions. J Sound Vib. 2013a;332:1125–1140. doi: 10.1016/j.jsv.2012.10.003. [DOI] [PMC free article] [PubMed] [Google Scholar]
- Dong RG, Welcome DE, McDowell TW, Wu JZ. Theoretical relationship between vibration transmissibility and driving-point response functions of the human body. J Sound Vib. 2013b;332(24):6193–6202. doi: 10.1016/j.jsv.2013.07.017. [DOI] [PMC free article] [PubMed] [Google Scholar]
- Gemne G, Saraste H. Bone and joint pathology in workers using hand-held vibrating tools. Scand J Work Environ Health. 1987;13(4):290–300. doi: 10.5271/sjweh.2048. [DOI] [PubMed] [Google Scholar]
- Gurram R, Rakheja S, Gouw GJ. Vibration transmission characteristics of the human hand-arm system and gloves. Int J Ind Ergon. 1994;13(3):217–234. [Google Scholar]
- Gurram R, Rakheja S, Brammer AJ. Driving-point mechanical impedance of the human hand-arm system: synthesis and model development. J Sound Vib. 1995;180:437–458. [Google Scholar]
- ISO 5349-1. Mechanical Vibration – Measurement and Evaluation of Human Exposure to Hand-transmitted Vibration – Part 1: General Requirements. International Organization for Standardization; Switzerland, Geneva: 2001. [Google Scholar]
- ISO 10819. Method for the Measurement and Evaluation of the Vibration Transmissibility of Gloves at the Palm of the Hand. International Organization for Standardization; Switzerland; Geneva: 2013. Mechanical vibration and shock. [Google Scholar]
- Kihlberg S. Biodynamic response of the hand–arm system to vibration from an impact hammer and a grinder. Int J Ind Ergon. 1995;16:1–8. [Google Scholar]
- Linaker CH, Walker-Bone K. Shoulder disorders and occupation. Best Pract Res Clin Rheumatology. 2015;29(3):405–423. doi: 10.1016/j.berh.2015.04.001. [DOI] [PMC free article] [PubMed] [Google Scholar]
- Marchetti E, Sisto R, Lunghi A, Sacco F, Sanjust F, Giovanni RD, Botti T, Tirabasso A. Hand-arm vibration transmissibility measurement for assessing hearing impairment. The Proceedings of the 13th International Conference on Hand-arm Vibration; Beijing, China. 2015. [Google Scholar]
- Marcotte P, Aldien Y, Boileau PE, Rakheja S, Boutin J. Effect of handle size and hand-handle contact force on the biodynamic response of the hand-arm system under zh-axis vibration. J Sound Vib. 2005;283(3–5):1071–1091. [Google Scholar]
- McDowell TW, Dong RG, Welcome DE, Warren C, Xu XS. Vibration-reducing gloves: transmissibility at the palm of the hand in three orthogonal directions. Ergonomics. 2013;56(12):1823–1840. doi: 10.1080/00140139.2013.838642. [DOI] [PMC free article] [PubMed] [Google Scholar]
- Miranda H, Punnett L, Viikari-Juntura E, Heliövaara M, Knekt P. Physical work and chronic shoulder disorder. Results of a prospective population-based study. Ann Rheumatic Dis. 2008;67:218–223. doi: 10.1136/ard.2007.069419. [DOI] [PubMed] [Google Scholar]
- Miwa T. Evaluation Methods for Vibration Effect. Part 3: measurements of threshold and equal sensation contours on hand for vertical and horizontal sinusoidal vibrations. Ind Health. 1967;5:213–220. [Google Scholar]
- Miwa T. Evaluation methods for vibration effect: part 6: measurements of unpleasant and tolerance limit levels for sinusoidal vibrations. Ind Health. 1968;6:18–27. [Google Scholar]
- Morioka M, Griffin MJ. Magnitude-dependence of equivalent comfort contours for fore-and-aft, lateral and vertical hand-transmitted vibration. J Sound Vib. 2006;295:633–648. [Google Scholar]
- National research council (NRC) Musculoskeletal Disorders and the Work-place: Low Back and Upper Extremity Musculoskeletal Disorders. National Academy Press; Washington DC: 2001. (The National Academy of Sciences) [Google Scholar]
- Odenwalda S, Krumma D. Effects of elastic compression sleeves on the biodynamic response to external vibration of the hand-arm system. Procedia Eng. 2014;72:114–119. [Google Scholar]
- Pyykko I, Farkkila M, Toivanen J, Korhonen O, Hyvarinen J. Transmission of vibration in the hand–arm system with special reference to changes in compression and acceleration. Scand J Work Environ Health. 1976;2:87–95. doi: 10.5271/sjweh.2820. [DOI] [PubMed] [Google Scholar]
- Pyykko I, Starck J, Pekkarinen J. Further evidence of a relation between noise-induced permanent threshold shift and vibration-induced digital vasospasm. Am J Otolaryngol. 1986;4:391–398. doi: 10.1016/s0196-0709(86)80013-8. [DOI] [PubMed] [Google Scholar]
- Pyykko I, Farkkila M, Inaba R, Starck J, Pekkarinen J. Effect of hand-arm vibration on inner ear and cardiac functions in man. Nagoya J Med Sci. 1994;57(Suppl l):113–119. [PubMed] [Google Scholar]
- Reynolds DD, Angevine EN. Hand–arm vibration. Part II: vibration transmission characteristics of the hand and arm. J Sound Vib. 1977;51:255–265. [Google Scholar]
- Rohmert W, Wos H, Norlander S, Helbig R. Effects of vibration on arm and shoulder muscles in three body postures. Eur J Appl Physiol Occup Physiol. 1989;59(4):243–248. doi: 10.1007/BF02388323. [DOI] [PubMed] [Google Scholar]
- Romaiguère P, Vedel JP, Pagni S. Effects of tonic vibration reflex on motor unit recruitment in human wrist extensor muscles. Brain Res. 1993;602(1):32–40. doi: 10.1016/0006-8993(93)90237-h. [DOI] [PubMed] [Google Scholar]
- Sakakibara H, Kondo T, Miyao M, Yamada S, Nakagawa T, Kobayashi F, Ono Y. Transmission of hand–arm vibration to the head. Scand J Work Environ Health. 1986;12:359–361. doi: 10.5271/sjweh.2146. [DOI] [PubMed] [Google Scholar]
- Tirabasso A, Botti T, Lunghi A, Giovanni RD, Sacco F, Marchetti E, Cerini L, Sanjust F, Moleti A, Sisto R. Combined effect of noise and hand-arm vibration exposure on the cochlear function. The Proceedings of the 13th International Conference on Hand–arm Vibration; Beijing, China. 2015. [Google Scholar]
- Taber LA. Biomechanics of growth, remodeling, and morphogenesis. Appl Mech Rev. 1995;48(8):487–545. [Google Scholar]
- Thomas M, Beauchamp Y. Development of a new frequency weighting filter for the assessment of grinder exposure to wrist transmitted vibration. Comput Ind Eng. 1998;35(3–4):651–654. [Google Scholar]
- Van der Windt DA, Thomas E, Pope DP, Winter AF, Macfarlane GJ, Bouter LM, Silman AJ. Occupational risk factors for shoulder pain: a systematic review. Occup Environ Med. 2000;57(7):433–442. doi: 10.1136/oem.57.7.433. [DOI] [PMC free article] [PubMed] [Google Scholar]
- Welcome DE, Dong RG, Xu XS, Warren C, McDowell TW. An evaluation of the proposed revision of the anti-vibration glove test method defined in ISO-10819 (1996) Int J Ind Ergon. 2012;42(1):143–155. [Google Scholar]
- Welcome DE, Dong RG, Xu XS, Warren C, McDowell TW, Wu JZ. An examination of the vibration transmissibility of the hand-arm system in three orthogonal directions. Int J Ind Ergon. 2015;45:21–34. doi: 10.1016/j.ergon.2014.11.001. [DOI] [PMC free article] [PubMed] [Google Scholar]
- Wu JZ, Dong RG, Welcome DE, Xu SX. A method for analyzing vibration power absorption density in human fingertip. J Sound Vib. 2010;329:5600–5614. [Google Scholar]
- Xu XS, Welcome DE, McDowell TW, Warren C, Dong RG. An investigation on characteristics of the vibration transmitted to wrist and elbow in the operation of impact wrenches. Int J Ind Ergon. 2009;39:174–184. [Google Scholar]
- Xu XS, Dong RG, Welcome DE, Warren C, McDowell TW. An examination of an adapter method for measuring the vibration transmitted to the human arms. Measurement. 2015;73:318–334. doi: 10.1016/j.measurement.2015.05.039. [DOI] [PMC free article] [PubMed] [Google Scholar]