

Abstract
Small‐cell lung carcinoma releases progalanin. The released progalanin is activated via a nonclassical processing pathway, being processed into an active form of galanin (1–20) by plasmin in extracellular components. Plasmin is produced from plasminogen activators. To clarify the regulation of progalanin via plasminogen activation by urokinase and tissue‐plasminogen activator (t‐PA), we investigated the regulation mechanism for urokinase and t‐PA expression and their effect on galanin activation. Additionally, we studied the effect of activated galanin on angiogenesis. To determine the effect of cell density, we measured the expression levels of urokinase and t‐PA using real‐time PCR and plasminogen/gelatin zymography in a cell culture. The urokinase expression increased under both high cell density and presence of cell membrane fractions. However, urokinase increments induced by conditioned medium were low. These results indicate that expression of plasminogen activators is regulated by cell membrane factors. We used tumor‐bearing mice to clarify the expression of plasminogen activators and galanin activation. Real‐time PCR showed that urokinase was substantially higher in the central parts of tumors compared to the periphery, and this was confirmed by plasminogen/gelatin zymography. To evaluate the biological effect of plasminogen activators on tumor growth, we used tranexamic acid as a plasminogen inhibitor. Tranexamic acid decreased galanin (1–20) and the hemoglobin content of tumors and suppressed tumor growth. Additionally, galanin had no effect on the hemoglobin content of tumors derived from cells lacking GALR2. These results demonstrate the regulation of urokinase expression in tumors through progalanin activation in extracellular compartments, and confirm that galanin plays a role in angiogenesis.
Keywords: adhesion molecule, extracellular processing, galanin, neuropeptide, plasminogen activator, tumor growth
Abbreviations
- Hb
hemoglobin
- HRP
horseradish peroxidase
- MMP
matrix metalloproteinase
- RIA
radioimmunoassay
- SCLC
small‐cell lung carcinoma
- t‐PA
tissue‐plasminogen activator
- u‐PA
urokinase
Tumors are regulated by several mechanisms, such as growth factors, tumor factors, and hormonal peptides. The tumor tissue environment continues to change during tumor growth 1. Angiogenesis in particular requires control because tumor growth requires many essential nutrients and oxygen. Tumors therefore induce angiogenesis via VEGF 2, 3, bFGF 4, angiopoietin 3, matrix metalloproteinase (MMP) 5, and plasmin 5, making angiogenesis an important target in suppressing tumor growth and metastasis.
Plasmin, a serine protease, is a tryptic protease. There are many reports on the effects of plasmin on tumor growth, invasion, and metastasis, particularly its effect on angiogenesis and cell migration 5, 6. Plasmin is converted from plasminogen by two plasminogen activators, urokinase (u‐PA) and tissue‐plasminogen activator (t‐PA) 7. Some cancer cells produce u‐PA and there is a positive correlation between the amount of u‐PA expression and malignancy 8, 9.
Some ectopic hormone‐producing tumors express neuropeptides 10, 11, 12, 13, 14, 15. However, lack of prohormone convertase and/or constitutive release was found to cause the release of these neuropeptides in a precursor form 16, 17, 18. In addition, there are many cases where these ectopic hormone‐producing tumors express their hormone‐specific receptors 19, 20, 21, 22, 23, 24. However, precursor peptides usually show a low binding potential to their own specific receptors. Our previous studies show that small‐cell lung carcinoma (SCLC) produced and released progalanin, a galanin precursor, and that plasmin converted progalanin to an active form of galanin (1–20) 25, 26, 27. In addition, the activation mechanism of progalanin induced angiogenesis via incrementation of MMP expression 27. This activation mechanism is different from a classical peptide processing pathway, so there exists little evidence regarding the activation of precursor peptides in the extracellular environment. In this study, we aimed to clarify expression of plasminogen activators during tumor growth and the effect of plasminogen activators on progalanin activation. In addition, we studied the effect of activated galanin on angiogenesis.
Materials and methods
Cell culture
Human SCLC cell lines SBC‐3A 27 and SBC‐3A‐Y were used. The SBC‐3A cells expressed the type 2 galanin receptor (GALR2), while the SBC‐3A‐Y cells were isolated from a subclone that lacked GALR2 (Figs S1 and S2). These cells were cultured in RPMI‐1640 medium (Nissui Pharmaceutical, Tokyo, Japan) supplemented with 10% (v/v) FBS (Moretate Biotech, Bulimba, Australia) in a humidified atmosphere of 5% CO2 and 95% air at 37 °C. When cells reached 80% confluency, they were dispersed with 0.05% (w/v) trypsin in phosphate‐buffered saline (PBS) and harvested at a concentration of 104 cells·mL−1.
Animals
Animal experimental protocols were approved by the ethics committee of the University of Shizuoka and performed in accordance with the guidelines for the Care and Use of Laboratory Animals of the University of Shizuoka. Male KSN/slc mice were purchased from Nippon SLC Ltd. (Shizuoka, Japan) and housed under standard laboratory conditions (23 ± 1 °C, 55 ± 5% humidity) with access to tap water and food ad libitum. Lights were automatically turned on at 08:00 h and off at 20:00 h.
Expression of plasminogen activators depends on cell density
The SBC‐3A cells were seeded in culture dishes at densities of 104, 105, or 106 cells/10 cm2. After 24 h, the culture media and cells were collected. The culture media were used to assess plasminogen activator activity with fluorescent substrates and plasminogen/gelatin zymography. The cells were used to measure plasminogen activator mRNA expression, via real‐time PCR.
Regulation of expression of plasminogen activators by conditioned media and cell membranes
Conditioned media were prepared as follows: 50% confluent SBC‐3A cells were cultured for 48 h, after which the cultured media were centrifuged at 3000 g for 30 min. Supernatants were stored at −20 °C and used as conditioned media. The cell membranes were prepared as described below. Briefly, SBC‐3A cells were collected with a scraper. The cells were homogenized using a Teflon glass homogenizer. The homogenate was centrifuged at 1000 g for 30 min and the supernatant collected. The supernatant was centrifuged at 30 000 g at 4 °C for 30 min, and the resulting pellets were used as the cell membrane fraction.
SBC‐3A cells were cultured in media containing the conditioned media or the cell membrane fractions for 24 h, after which the cultured cells were collected. The plasminogen activator mRNA expression in the cells was measured via real‐time PCR.
Expression of plasminogen activators in tumors
Tumor samples were obtained as previously described 28. Briefly, KSN/slc mice were implanted with SBC‐3A cells (1 × 10⁶ cells/100 μL Matrigel) subcutaneously on the dorsal side. When the tumors reached a diameter of 7–10 mm, they were excised. The tumors were separated into two parts: central and peripheral. For hemoglobin content measurement, western blot analysis, and plasminogen/gelatin zymography, the samples were homogenized in a protein extraction buffer (500 mm Tris/HCl, pH 6.8, 0.1% Triton X‐100) using a Polytron homogenizer. The homogenates were centrifuged at 3000 g for 30 min, and the supernatant was used as the tumor extract. The protein concentration of the extract was measured using the Coomassie Brilliant Blue method, with BSA as the standard. For real‐time PCR analysis, total RNA was extracted from the tumor with TriPure Isolation Reagent (Roche, Basel, Switzerland).
Preparation of tumor extracts for gel filtration chromatography
KSN/slc mice were implanted with SBC‐3A cells (1 × 10⁶ cells/100 μL Matrigel) subcutaneously on the dorsal side. To suppress plasmin activity, tranexamic acid was administered intraperitoneally at a dose of 30 mg·day−1. When the tumors reached a diameter of 7–10 mm, they were excised. To determine the molecular forms of galanin, the collected samples were heated in a boiling water bath for 10 min in 0.1 m acetic acid. After cooling, the acetic acid concentration was increased to 1 m and samples were homogenized in a Teflon pestle homogenizer. The homogenates were then centrifuged at 3000 g for 30 min. Supernatants were lyophilized and used as tumor extracts. Tumor extracts were eluted on a Sephadex G‐50 fine column (1.0 × 100 cm, GE Healthcare UK, Chalfont St Giles, UK) using 1 m acetic acid as the eluent. The eluate was collected in 0.9 mL volumes and lyophilized. The lyophilized fractions were dissolved in the standard RIA diluent. The column was calibrated with BSA (molecular weight 69 kDa, void volume), lysozyme (14.4 kDa), human galanin (3 kDa), and dibutyryl cAMP (total volume).
The effect of type 2 galanin receptors on tumor growth
KSN/slc mice were implanted with SBC‐3A or SBC‐3A‐Y cells (1 × 10⁶ cells/100 μL Matrigel) subcutaneously on the dorsal side. To suppress plasmin activity, tranexamic acid was administered intraperitoneally at a dose of 30 mg·day−1. Stimulation galanin was injected, at a volume of 50 μL and a concentration of 50 ng/50 μL in saline, directly into the tumor. We used a saline control. Ten days after the cells had been implanted, the tumors were collected, weighed, and extracted using homogenizer, for the measurement of the hemoglobin content.
Real‐time PCR
Total RNA was extracted from SBC‐3A cells and tumors with TriPure Isolation Reagent (Roche, Basel, Switzerland). Genomic DNA was removed with DNase I. cDNA was synthesized using ReverTra Ace (Toyobo, Osaka, Japan) according to the manufacturer's instructions. Specific primers were designed to amplify human t‐PA (sense: GAGGACCAGGGCATCAGCTA; antisense: CGTGCCCCTGTAGCTGAT), human u‐PA (sense: CACCACCATCGAGAACCAGC; antisense: CGGTGCCTCCTGTAGATGG), and human β‐actin (sense: GCGGGAAATCGTGCGTGACATT; antisense: GATGGAGTTGAAGGTAGTTTCGTG). Real‐time PCR was performed with Thunderbird SYBR qPCR Mix (Toyobo) using LightCyclerNano (Toyobo) and StepOne systems (Thermo Fisher Scientific, Waltham, MA, USA). The PCR products were evaluated using melting curve analysis.
Radioimmunoassay
Radioimmunoassay (RIA) was performed at 4 °C as described previously 29. R0672 antibodies specific to the N‐terminal region of galanin were raised in rabbits against synthetic human galanin (1–15).
Western blot analysis
Samples (5 μg) of the cell lysates were separated on a 15% (w/v) polyacrylamide gel 30. Proteins were blotted onto a nitrocellulose membrane (Protran BA85, GE Healthcare UK) in a semidry blotting system (NA‐1513, Nihon Eidoh, Japan) 31. Nitrocellulose membranes were blocked with 1% (w/v) BSA. Blocked membranes were incubated with anti‐HIF‐1α antibody for HIF‐1α (× 1000, Bethyl Laboratories, Montgomery, TX, USA), then with horseradish peroxidase (HRP)‐conjugated anti‐rabbit IgG goat antibody (Biosource, Camarillo, CA, USA). The blots were subsequently developed on a chemiluminescent detection system 32 or Imobiron (Merck Millipore, Billerica, MA, USA) using LuminoGraph (Atto, Amherst, NY, USA). The bands were densitometrically analyzed using cs analyzer software (Atto corp., Tokyo, Japan).
Plasminogen/gelatin zymography
We measured plasminogen activator activity using plasminogen/gelatin zymography 33. The tumor extracts were separated with 10% polyacrylamide gel containing plasminogen and 1 mg·mL−1 gelatin. After electrophoresis, the SDS in the gels was removed with Tris/HCl buffer (pH 7.4) containing 2.5% Triton X‐100, then incubated in Tris/HCl containing 12.5 mm MgCl2 buffer for 24 h to allow digestion of the gelatin. The gels were visualized using Coomassie Brilliant Blue R250.
Detection of plasminogen activator‐like enzyme activity by Pyr‐Gly‐Arg‐MCA cleavage assay
We determined plasminogen activator‐like enzyme activity in cell extracts using a Pyr‐Gly‐Arg‐MCA (Peptide Institute, Osaka, Japan) cleavage assay as follows. The cell extracts were diluted in 50 mm Tris/HCl buffer (pH 7.4), after which Pyr‐Gly‐Arg‐MCA (final concentration 100 μm) was added to the solution, including the extracts. The solution was incubated at 37 °C for 2 h, and cleaved 7‐amino‐4‐methyl coumarin was measured (excitation/emission, 355/460 nm).
Hemoglobin content in tumor
We assessed angiogenesis by measuring hemoglobin (Hb) content. Hb was measured by a slightly modified cyanmethemoglobin method 34. The tumor extracts from the Matrigel plugs were diluted with 100 μL of 0.5 mm sodium hydroxide, to which were added 20 μL of 2% (w/v) potassium ferricyanide and 20 μL of 0.5% (w/v) sodium cyanide. After 30 min of incubation, Hb concentrations were determined by measuring absorbance at 550 nm.
Data analysis and statistics
Data are represented as means ± SEM. Tukey's tests were used for statistical analysis program (R).
Results
Expression of plasminogen activators in culture cells
We determined the effect of cell seed density on u‐PA and t‐PA expression using real‐time PCR analysis, protease activity, and plasminogen/gelatin zymography. The mRNA contents of u‐PA increased gradually with cell density (Fig. 1B). Additionally, the expressions of u‐PA and t‐PA proteases were measured by fluorescent substrate and plasminogen/gelatin zymography analysis. We detected protease activity of fluorescent substrate from the high sensitivity and total enzymatic activity of u‐PA and t‐PA. Plasminogen activity gradually increased with cell density (Fig. 1C). In plasminogen/gelatin zymography, plasminogen in the gels was found to be activated where u‐PA and t‐PA were present. We detected u‐PA and t‐PA at about 50 kDa and 70 kDa, respectively (Fig. 1D). Accumulated plasminogen activation was found to be similarly activated, especially in the presence of high amounts of u‐PA. We then explored what factors regulated u‐PA and t‐PA expression, focusing on cell adhesion and/or tumor factors. We assessed the effects of cell adhesion via coculturing with cell membranes prepared from SBC‐3A cells and evaluated tumor factors using SBC‐3A cells in culture‐conditioned media. Membranes were prepared from cultured cells at a density of 104, 105, or 106 cells/10 cm2. The expression of u‐PA induced by cell membranes, particularly membranes prepared from 106 cells, increased significantly (Fig. 1E). Conditioned media also tended to induce u‐PA expression, although to a lesser degree (Fig. 1F). These results indicate that the u‐PA‐inducing factor exists in cell membranes and the extracellular environment, such as between‐cell adhesion, controls expression of u‐PA‐inducing factors.
Figure 1.
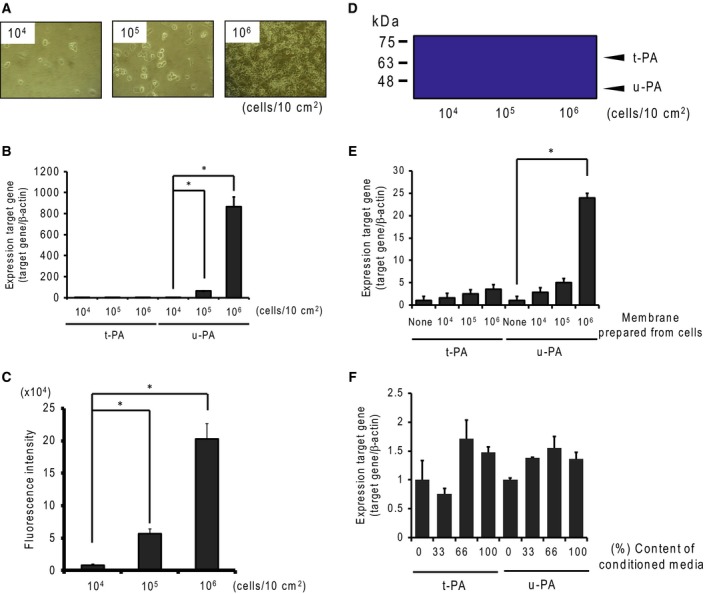
Induction of plasminogen activators in SBC‐3A cells. (A) SBC‐3A cells were seeded in a culture dish at a density of 104, 105, or 106 cells/10 cm2. (B) The effects of cell seed density on plasminogen activator mRNA expression were determined by real‐time PCR analysis. Cells seeded at several densities were cultured for 24 h, and RNA was isolated. Expression of u‐PA and t‐PA mRNA was measured by real‐time PCR analysis. β‐Actin mRNA was used as a reference gene. N = 3–4, *P < 0.05 vs. 104 cells. (C) Plasminogen activator activity was measured using fluorescent substrate (Pyr‐Gly‐Arg‐MCA). The substrate was digested with culture medium, after which the digest was measured by fluorescence (355 nm/460 nm). N = 3–4, *P < 0.05 vs. 104 cells. (D) Plasminogen activator activity and molecular forms were determined by plasminogen/gelatin zymography. Samples of 50 μg per lane were loaded for electrophoresis, using 10% acrylamide gel containing 1% gelatin and 50 μg·mL−1 plasminogen. t‐PA and u‐PA were detected at ~70 kDa and ~50 kDa, respectively. The effect of cell membrane fraction (E) and conditioned media (F) on plasminogen activators mRNA expression was determined by real‐time PCR analysis. N = 3–4, *P < 0.05.
Hemoglobin content and expression of HIF‐1 and u‐PA in tumor tissue
To evaluate the hypoxic environment, we measured hemoglobin content and HIF‐1 expression. Hemoglobin content was correlated with the number of blood vessels, and HIF‐1 expression was induced under hypoxic conditions. Tumors reaching 7–10 mm were separated into central and peripheral regions, and we collected approximately 2 mm2 of tumor tissue from each region. The hemoglobin content of the central region was lower than that of the peripheral region, indicating a lower number of blood vessels in the central region (Fig. 2A). In addition, expression of HIF‐1α in the central region was slightly higher than that in the peripheral region (Fig. 2B). The densitometry analysis of the ratio of HIF‐1α to actin showed that the density of the central region was 1.4 times that of the peripheral region. These results indicate that the central and peripheral parts of the tumor differ in extracellular environmental conditions, such as oxygen saturation and nutrition.
Figure 2.
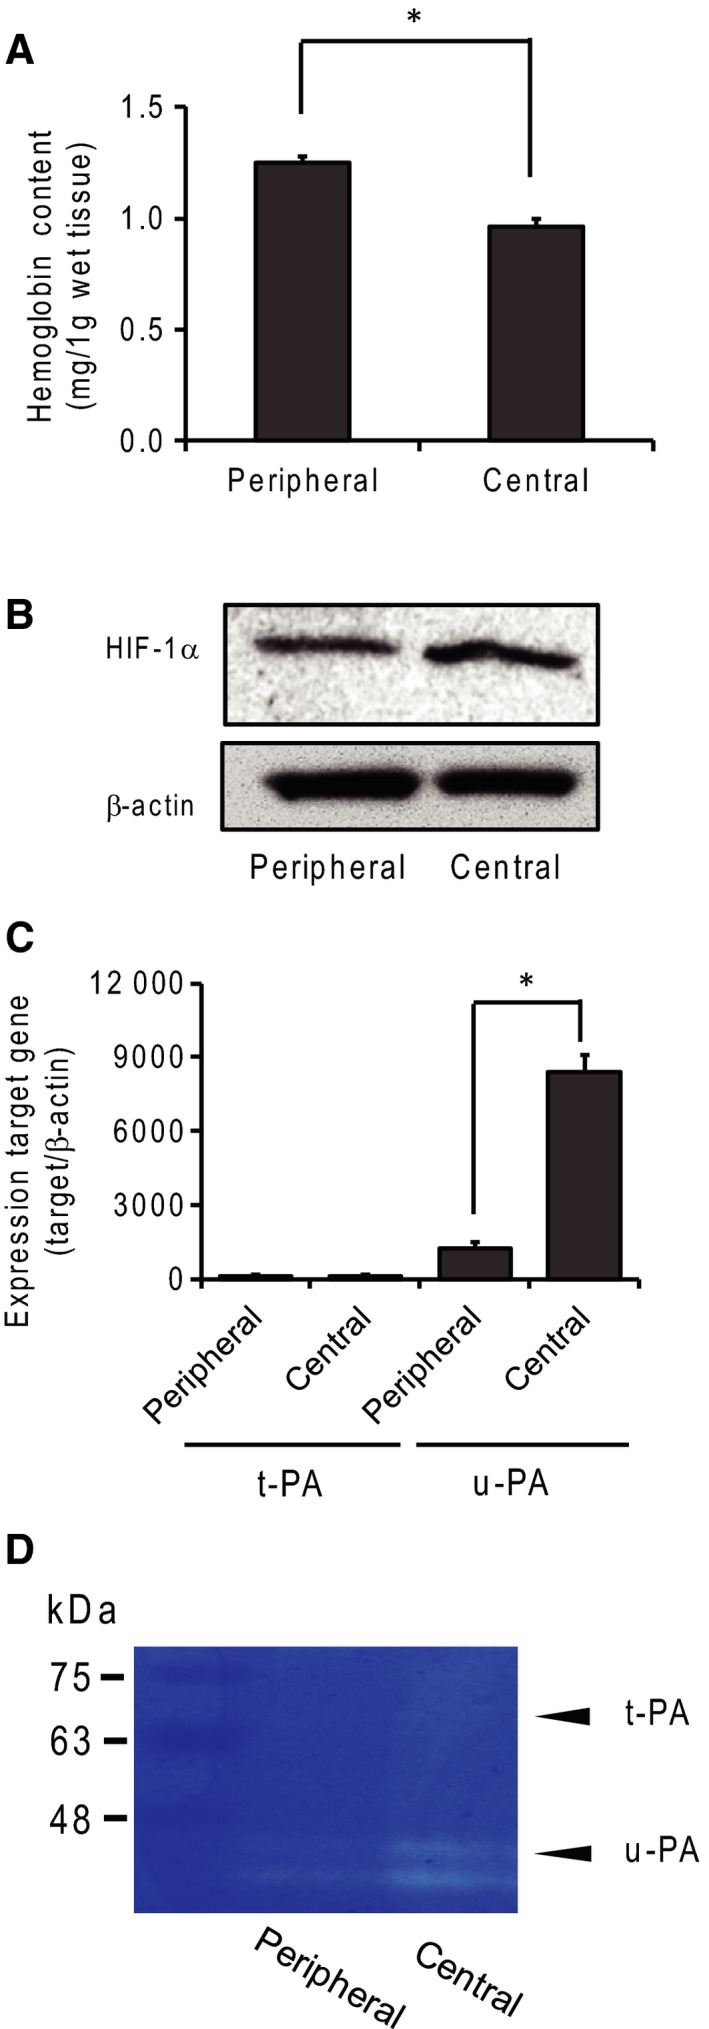
Expression of plasminogen activators in tumor tissue. (A) Hemoglobin content in the central and peripheral tumor regions. Hemoglobin content was measured with the cyanmethemoglobin method and found to be related to angiogenesis in tumor regions. N = 4, *P < 0.05. (B) HIF‐1α expression was detected by western blotting analysis under hypoxic conditions. (C) Expression of t‐PA and u‐PA mRNA in the peripheral and central tumor regions was measured by real‐time PCR. N = 4, *: P < 0.05. (D) The expression of plasminogen activators was determined by plasminogen/gelatin zymography.
To determine the expression of plasminogen activators in tumors, we performed real‐time PCR and plasminogen/gelatin zymography. A higher expression of u‐PA mRNA than of t‐PA mRNA was detected in both tumor regions (Fig. 2C). In addition, the expression of u‐PA mRNA was about sevenfold higher in the central than in the peripheral region. Enzymatic activity was detected by plasminogen/gelatin zymography. The major plasminogen activator was u‐PA, and t‐PA expression was low. In addition, u‐PA expression was higher in the central than in the peripheral region (Fig. 2D).
The effect of plasminogen activators on galanin activation and tumor growth
We evaluated tumor growth by measuring cell diameter after implanting small‐cell lung carcinoma cells mixed in Matrigel (Fig. 3A). We used tranexamic acid, a plasmin inhibitor, to evaluate galanin activation and tumor growth. Galanin activation was evaluated using a molecular form of galanin‐like immunoreactivity. The molecular forms of galanin‐LI were determined using gel filtration chromatography. The galanin‐LI in tumor‐bearing nude mice existed in a ~2‐kDa form (Fig. 3B). In the tranexamic acid‐treated mice, the amount of 2‐kDa molecular forms of galanin‐LI decreased and the 12‐kDa forms of galanin‐LI, indicating the presence of the progalanin form, increased relative to it (Fig. 3C). Tumors continued to grow over time. Tranexamic acid treatment inhibited tumor growth by about 30% relative to the nontreated group (Fig. 3D). Hemoglobin content, which correlates with the number of blood vessels, also decreased following tranexamic acid treatment (Fig. 3E). Tumor growth and hemoglobin content recovered following the application of galanin directly to the tumor. In contrast, hemoglobin content did not recover in the tumors originating from SBC‐3A‐Y cells, which were the SBC‐3A subclones lacking the type 2 galanin receptor (Fig. 3F).
Figure 3.
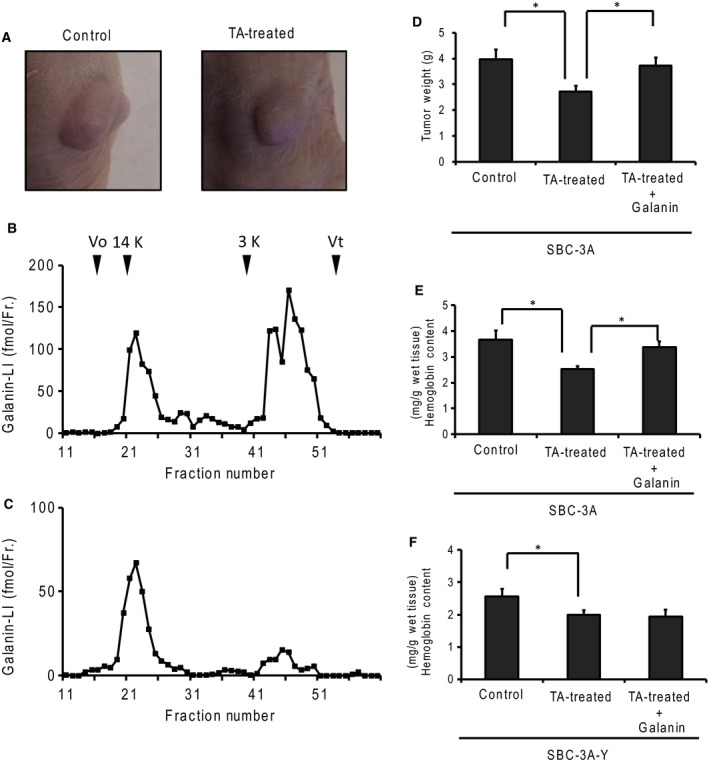
Involvement of plasminogen activators in galanin production and tumor growth. (A) Tumors generated in tumor‐bearing mice. SBC‐3A cells were injected into the subcutaneous layer. The tumor was grown to a diameter of 7–10 mm. To suppress plasmin activity, the mice were administered tranexamic acid (TA). The molecular forms of galanin‐like immunoreactivity in the tumor (B) were treated with tranexamic acid (C) using gel filtration. The gel was carried by Sephadex G‐50 fine (1.0 cm × 80 cm) and 1 m acetic acid as an eluent. The column was calibrated with bovine serum albumin (Vo), lysozyme (14 kDa), human galanin (3 kDa), and dibutyryl cAMP (Vt). (D) Tumor growth was measured by tumor weight at 10 days after implanting SBC‐3A cells into the subcutaneous layer. The mice were treated with TA (30 mg·day−1, intraperitoneal administration) to suppress plasmin activity. N = 4, *P < 0.05. (E and F) Hemoglobin content was measured in tumors derived from SBC‐3A or SBC‐3A‐Y cells, using the cyanmethemoglobin method. Hemoglobin decreased with TA treatment, but recovered under galanin administration (1 μg·day−1, direct injection into tumor). N = 4, *P < 0.05.
Discussion
The plasminogen activation system is composed of two plasminogen activators, t‐PA and u‐PA 7. This system plays an important role in tumor growth by affecting extracellular matrix digestion, matrix metalloprotease activation, and growth factor activation 5, 6. The plasminogen system is essential for angiogenesis in hypoxic environments. It is well known that oxygen and nutrient supply was important during tumor growth because tumor cell activity was high and tumor cells were actively dividing. Although tumor expansion led to hypoxia and malnutrition owing to increasing diffusion distances from vascular tissue and tumor cells consuming oxygen and nutrients, tumors required new vessel formation, thus supporting cell division. There are many reports connecting tumor growth and angiogenesis. The plasminogen system is a well‐known angiogenesis mechanism involved in tumor growth 35, 36. u‐PA in particular was found to be widely expressed in several cancer cells and to play a role in tumor progression, invasion, and metastasis 8. In the present study, we demonstrated the regulation of plasminogen activator expression using in vitro and in vivo approaches. In the SCLC cell line SBC‐3A, which also expresses u‐PA mRNA, the expression of u‐PA mRNA and u‐PA‐like enzyme activity increased with cell density and tumor factors. We verified this via an in vivo study using SCLC tumor‐bearing model mice. We prepared the central part of the tumor tissue as a hypoxic and malnourished region and the peripheral part under normal conditions. This resulted in higher u‐PA expression in the central than in peripheral tumor region. The mechanism behind this induced u‐PA expression is unclear, but may be more strongly influenced by membrane factors than tumor factors. It is well known that adhesion affects cell condition 37, 38, 39. In this study, SBC‐3A cells were affected not only by the extracellular matrix, but also by factors in the cell membrane, which in turn were regulated by cell density. These results lead to the not unreasonable conclusion that expression of u‐PA was induced when angiogenesis and metastasis were required.
Neuropeptides mature in intracellular environments such as the Golgi body and secretory vesicles. In some tumor and normal cells, cells released neuropeptides in precursor form 16, 17, 18, 40, 41. We previously demonstrated that progalanin released from SCLC was cleaved to galanin (1–20) by trypsin‐like protease, with plasmin as the major protease 25, 26, 27. Activated galanin induced expression of matrix metalloproteases‐2 and ‐9, following angiogenesis and metastasis 27. The present study showed that tranexamic acid suppressed hemoglobin content and the production of galanin (1–20) in tumor tissue. In addition, supplying galanin to the tumor resulted in the recovery of hemoglobin content. This result supports the previous report that shows galanin induced angiogenesis in tumor and granulation tissue 42, 43. Furthermore, our results supported the idea that the u‐PA‐plasminogen system regulates the mechanism behind progalanin activation, a reasonable conclusion given that u‐PA actively converts plasminogen to plasmin and plasmin affects angiogenesis and metastasis, including progalanin activation.
The present study showed that GALR2‐deficient SBC‐3A cells did not respond to galanin with an increase in hemoglobin content. This indicates that GALR2 plays an important role in increasing the hemoglobin content, implying that galanin affects angiogenesis via the GALR2 expressed in SCLC cells. There are some reports that GALR2 is expressed in tumors and plays a role in the acceleration or inhibition of tumor growth 44, 45, 46. The u‐PA/plasmin/galanin system is thus one mechanism for regulating tumor growth, and it appears to be an anomalous autocrine mechanism.
In summary, we demonstrated that cell membrane factors induce u‐PA expression. The expression of these factors increased with increasing cell density. In addition, u‐PA expression in tumors activated progalanin via plasminogen cleavage. Our results suggest that excessive tumor growth induces progalanin activation via the u‐PA/plasminogen system.
Author contributions
HY and KU contributed to the experimental design. HY, RO, and YH performed the experiment. HY wrote the manuscript.
Supporting information
Fig. S1. RT‐PCR.
Fig. S2. [Ca2+]i response to galanin in SBC‐3A and SBC‐3A‐Y cells.
Acknowledgements
This work was supported in part by Nihon Pharmaceutical University Research Grant from Nihon Pharmaceutical University (2016).
References
- 1. Folkman J (2000) Tumor angiogenesis In Cancer Medicine (Bast RC, Jr., ed.), pp. 161–194. BC Decker, Hamilton, ON. [Google Scholar]
- 2. Plate KH, Breier G, Weich HA and Risau W (1992) Vascular endothelial growth factor is a potential tumour angiogenesis factor in human gliomas in vivo. Nature 359, 845–848. [DOI] [PubMed] [Google Scholar]
- 3. Holash J, Maisonpierre PC, Compton D, Boland P, Alexander CR, Zagzag D, Yancopoulos GD and Wiegand SJ (1999) Vessel cooption, regression, and growth in tumors mediated by angiopoietins and VEGF. Science 284, 1994–1998. [DOI] [PubMed] [Google Scholar]
- 4. Moscatelli D, Presta M, Joseph‐Silverstein J and Rifkin DB (1986) Both normal and tumor cells produce basic fibroblast growth factor. J Cell Physiol 129, 273–276. [DOI] [PubMed] [Google Scholar]
- 5. Thorgeirsson UP, Lindsay CK, Cottam DW and Gomez DE (1994) Tumor invasion, proteolysis, and angiogenesis. J Neurooncol 18, 89–103. [DOI] [PubMed] [Google Scholar]
- 6. McMahon BJ and Kwaan HC (2015) Components of the plasminogen‐plasmin system as biologic markers for cancer. Adv Exp Med Biol 867, 145–156. [DOI] [PubMed] [Google Scholar]
- 7. Lijnen HR and Collen D (1988) Mechanisms of plasminogen activation by mammalian plasminogen activators. Enzyme 40, 90–96. [DOI] [PubMed] [Google Scholar]
- 8. Noh H, Hong S and Huang S (2013) Role of urokinase receptor in tumor progression and development. Theranostics 3, 487–495. [DOI] [PMC free article] [PubMed] [Google Scholar]
- 9. Duffy MJ and Duggan C (2004) The urokinase plasminogen activator system: a rich source of tumour markers for the individualised management of patients with cancer. Clin Biochem 37, 541–548. [DOI] [PubMed] [Google Scholar]
- 10. Weber S, Zuckerman JE, Bostwick DG, Bensch KG, Sikic BI and Raffin TA (1985) Gastrin releasing peptide is a selective mitogen for small cell lung carcinoma in vitro. J Clin Invest 75, 306–309. [DOI] [PMC free article] [PubMed] [Google Scholar]
- 11. Yamaguchi K, Abe K, Adachi I, Kimura S, Suzuki M, Shimada A, Kodama T, Kameya T and Shimosato Y (1985) Peptide hormone production in primary lung tumors. Recent Results in Cancer Res 99, 107–116. [DOI] [PubMed] [Google Scholar]
- 12. Moody TW, Pert CB, Gazdar AF, Carney DN and Minna JD (1981) High level of intracellular bombesin characterize human small‐cell lung carcinoma. Science 214, 1246–1248. [DOI] [PubMed] [Google Scholar]
- 13. Woll PJ and Rozengurt E (1990) A neuropeptide antagonist that inhabits the growth of small cell lung cancer in vitro. Cancer Res 50, 3968–3973. [PubMed] [Google Scholar]
- 14. Yanaihara N, Suzuki T, Sato Hoshino H, Okaru Y and Yanaihara C (1981) Dibutyryl cAMP stimulation of production and release of VIP‐like immunoreactivity in a human neuroblastoma cell line. Biomed Res 2, 728–734. [Google Scholar]
- 15. Hoshino M, Yanaihara C, Ogino K, Iguchi K, Sato H, Suzuki T and Yanaihara N (1984) Production of VIP‐related and PHM (human PHI)‐related peptides in human neuroblastoma cells. Peptides 5, 155–160. [DOI] [PubMed] [Google Scholar]
- 16. Ogata M, Kajiyama F, Iguchi K, Mochizuki T and Hoshino M (2000) Production and secretion of galanin‐related peptides in human small cell lung carcinoma In Peptide Science 1999 (Fujii N, ed.), pp. 213–216. The Japanese Peptide Society, Osaka, Japan. [Google Scholar]
- 17. Miyake Y, Kodama T and Yamaguchi K (1994) Pro‐gastrin‐releasing peptide (31–98) is a specific tumor marker in patients with small cell lung carcinoma. Cancer Res 54, 2136–2140. [PubMed] [Google Scholar]
- 18. Bertagna XY, Nicholson WE, Sorenson GD, Pettengill OS, Mount CD and Orth DN (1978) Corticotropin, lipotropin, and beta‐endorphin production by a human nonpituitary tumor in culture: evidence for a common precursor. Proc Natl Acad Sci USA 75, 5160–5164. [DOI] [PMC free article] [PubMed] [Google Scholar]
- 19. Papotti M, Kumar U, Volante M, Pecchioni C and Patel YC (2001) Immunohistochemical detection of somatostatin receptor types 1‐5 in medullary carcinoma of the thyroid. Clin Endocrinol 54, 641–649. [DOI] [PubMed] [Google Scholar]
- 20. Panetta R and Patel YC (1995) Expression of mRNA for all five human somatostatin receptors (hSSTR1‐5) in pituitary tumors. Life Sci 56, 333–342. [DOI] [PubMed] [Google Scholar]
- 21. Reubi JC, Schaer JC, Waser B and Mengod G (1994) Expression and localization of somatostatin receptor SSTR1, SSTR2 and SSTR3 mRNAs in primary human tumors using in situ hybridization. Cancer Res 54, 3455–3459. [PubMed] [Google Scholar]
- 22. Valdehita A, Bajo AM, Fernández‐Martínez AB, Arenas MI, Vacas E, Valenzuela P, Ruíz‐Villaespesa A, Prieto JC and Carmena MJ (2010) Nuclear localization of vasoactive intestinal peptide (VIP) receptors in human breast cancer. Peptides 31, 2035–2045. [DOI] [PubMed] [Google Scholar]
- 23. Szilasi M, Buglyo A, Treszl A, Kiss L, Schally AV and Halmos G (2011) Gene expression of vasoactive intestinal peptide receptors in human lung cancer. Int J Oncol 39, 1019–1024. [DOI] [PubMed] [Google Scholar]
- 24. Morgan K, Meyer C, Miller N, Sims AH, Cagnan I, Faratian D, Harrison DJ, Millar RP and Langdon SP (2011) GnRH receptor activation competes at a low level with growth signaling in stably transfected human breast cell lines. BMC Cancer 11, 476. [DOI] [PMC free article] [PubMed] [Google Scholar]
- 25. Yamamoto H, Iguchi K, Ohno S, Yokogawa T, Nishikawa K and Hoshino M (2011) Activation of large form galanin‐LI by extracellular processing in small cell lung carcinoma tissue. Protein Pept Lett 18, 1058–1064. [DOI] [PubMed] [Google Scholar]
- 26. Yamamoto H, Ben S, Saitoh S, Kamata K, Iguchi K and Hoshino M (2011) Plasmin: Its role in the extracellular processing of progalanin in tumor tissue. Protein Pept Lett 18, 1204–1211. [DOI] [PubMed] [Google Scholar]
- 27. Miyamoto H (1986) Establishment and characterization of anadrianycun‐ resistant subline of human small cell lung cancer cells. Acta Med Okayama 40, 65–73. [DOI] [PubMed] [Google Scholar]
- 28. Yamamoto H, Okada R, Iguchi K, Ohno S, Yokogawa T, Nishikawa K, Unno K, Hoshino M and Takeda A (2013) Involvement of plasmin‐mediated extracellular activation of progalanin in angiogenesis. Biochem Biophys Res Commun 430, 999–1004. [DOI] [PubMed] [Google Scholar]
- 29. Habu A, Ohishi T, Ohkubo S, Hong YM, Mochizuki T and Yanaihara N (1994) Isolation and sequence determination of galanin from the pituitary of yellowfin tuna. Biomed Res 15, 357–362. [Google Scholar]
- 30. Laemmli UK (1970) Cleavage of structural proteins during the assembly of the head of bacteriophage T4. Nature 227, 680–685. [DOI] [PubMed] [Google Scholar]
- 31. Burnette WN (1981) Western blotting: electrophoretic transfer of proteins from sodium dodecyl sulfate‐polyacrylamide gels to unmodified nitrocellulose and radiographic detection with antibody and radioiodinated protein A. Anal Biochem 112, 146–203. [DOI] [PubMed] [Google Scholar]
- 32. Yakunin AF and Hallenbeck PC (1988) A luminol/iodophenol chemiluminescent detection system for western immunoblots. Anal Biochem 258, 146–149. [DOI] [PubMed] [Google Scholar]
- 33. Ito A, Nakajima S, Sasaguri Y, Nagase H and Mori Y (1995) Co‐culture of human breast adenocarcinoma MCF‐7 cells and human dermal fibroblasts enhances the production of matrix metalloproteinases 1, 2 and 3 in fibroblasts. Br J Cancer 71, 1039–1045. [DOI] [PMC free article] [PubMed] [Google Scholar]
- 34. van Kampen EJ and Zijlstra WG (1961) Standardization of hemoglobinometry II. The Hemoglobincyanide method. Clin Chim Acta 6, 538–544. [DOI] [PubMed] [Google Scholar]
- 35. Rabbani SA and Mazar AP (2001) The role of the plasminogen activation system in angiogenesis and metastasis. Surg Oncol Clin N Am 10, 393–415. [PubMed] [Google Scholar]
- 36. Wong CC, Kai AK and Ng IO (2014) The impact of hypoxia in hepatocellular carcinoma metastasis. Front Med 8, 33–41. [DOI] [PubMed] [Google Scholar]
- 37. Hakim AA (1987) Cellular growth modulation. I. Effects of extracellular matrix and tumor cell conditioned medium. Exp Cell Biol 54, 193–211. [PubMed] [Google Scholar]
- 38. Morimoto C, Rudd CE, Letvin NL and Schlossman SF (1987) A novel epitope of the LFA‐1 antigen which can distinguish killer effector and suppressor cells in human CD8 cells. Nature 330, 479–482. [DOI] [PubMed] [Google Scholar]
- 39. Fukai F (2017) New type of antitumor agent targeting the cell adhesion molecule. Integrin Yakugaku Zasshi 137, 137–139. [DOI] [PubMed] [Google Scholar]
- 40. Yamamoto H, Yamane T, Iguchi K, Tanaka K, Iddamalgoda A, Unno K, Hoshino M and Takeda A (2015) Melanin production through novel processing of proopiomelanocortin in the extracellular compartment of the auricular skin of C57BL/6 mice after UV‐irradiation. Sci Rep 5, 14579. [DOI] [PMC free article] [PubMed] [Google Scholar]
- 41. Yamamoto H, Iguchi K, Unno K, Kaji K and Hoshino M (2014) Expression and release of progalanin in fibroblasts. Regul Pept 194–195, 55–62. [DOI] [PubMed] [Google Scholar]
- 42. Banerjee R, Van Tubergen EA, Scanlon CS, Vander Broek R, Lints JP, Liu M, Russo N, Inglehart RC, Wang Y, Polverini PJ et al (2014) The G protein‐coupled receptor GALR2 promotes angiogenesis in head and neck cancer. Mol Cancer Ther 13, 1323–1333. [DOI] [PMC free article] [PubMed] [Google Scholar]
- 43. Yamamoto H, Arai T, Ben S, Iguchi K and Hoshino M (2011) Expression of galanin and galanin receptor mRNA in skin during the formation of granulation tissue. Endocrine 40, 400–407. [DOI] [PubMed] [Google Scholar]
- 44. Gudermann T and Roelle S (2006) Calcium‐dependent growth regulation of small cell lung cancer cells by neuropeptides. Endocr Relat Cancer 13 (4), 1069–1084. [DOI] [PubMed] [Google Scholar]
- 45. Sethi T and Rozengurt E (1991) Galanin stimulates Ca2+ mobilization, inositol phosphate accumulation, and clonal growth in small cell lung cancer cells. Cancer Res 51, 1674–1679. [PubMed] [Google Scholar]
- 46. Sethi T, Langdon S, Smith J and Rozengurt E (1992) Growth of small cell lung cancer cells: stimulation by multiple neuropeptides and inhibition by broad spectrum antagonists in vitro and in vivo. Cancer Res 52, 2737s–2742s. [PubMed] [Google Scholar]
Associated Data
This section collects any data citations, data availability statements, or supplementary materials included in this article.
Supplementary Materials
Fig. S1. RT‐PCR.
Fig. S2. [Ca2+]i response to galanin in SBC‐3A and SBC‐3A‐Y cells.