

Abstract
Objectives
To assess the use and timing of scheduled cesareans and other categories of cesarean delivery and the prevalence of neonatal morbidity among cesareans in Oregon before and after the implementation of Oregon's statewide policy limiting elective early deliveries.
Data Sources
Oregon vital statistics records, 2008–2013.
Study Design
Retrospective cohort study, with multivariable logistic regression, regression controlling for time trends, and interrupted time series analyses, to compare the odds of different categories of cesarean delivery and the odds of neonatal morbidity pre‐ and postpolicy.
Data Collection/Extraction Methods
We analyzed vital statistics data on all term births in Oregon (2008–2013), excluding births in 2011.
Principal Findings
The odds of early‐term scheduled cesareans decreased postpolicy (adjusted odds ratio [aOR], 0.70; 95 percent confidence interval [CI], 0.66–0.74). In the postpolicy period, there were mixed findings regarding assisted neonatal ventilation and neonatal intensive care unit admission, with regression models indicating higher postpolicy odds in some categories, but lower postpolicy odds after controlling for time trends.
Conclusions
Oregon's hard stop policy limiting elective early‐term cesarean delivery was associated with lower odds of cesarean delivery in the category of women who were targeted by the policy; more research is needed on impact of such policies on neonatal outcomes.
Keywords: Health policy/politics/law/regulation, obstetrics/gynecology, maternal and perinatal care and outcomes
Over the past few decades, obstetric practice has been influenced by several factors, including the increasing frequency of advanced maternal age and increasing rates of maternal comorbidities (Kenny et al. 2013). Within the past decade, there has been a growing focus on increased public reporting and accountability of obstetric quality measures driven by major national quality movements, including the March of Dimes, the American College of Obstetricians and Gynecologists, and the Joint Commission. Focus on early‐term deliveries in the absence of medical or obstetric indications has received national attention for more than 5 years (Spong et al. 2011). Recent evidence has highlighted that term pregnancy is a heterogeneous period for neonatal risk, with neonates born in the early‐term period (i.e., 37–38 weeks' gestation) at elevated risk for adverse outcomes (Cheng et al. 2008; Reddy et al. 2009). Policies limiting the practice of early‐term deliveries are increasingly being implemented by hospitals and health systems within and outside the United States (Oshiro et al. 2009; Donovan et al. 2010; Ehrenthal et al. 2011; Hutcheon et al. 2015). Studies to date on the health impact of shifting deliveries from the early‐term to the full‐term or late‐term period have had mixed results. Early elective deliveries prior to 39 weeks have been associated with increases in neonatal morbidity in some studies (Tita et al. 2009; Doan, Gibbons, and Tudehope 2014; Gawlik et al. 2014; Parikh et al. 2014), but other studies report no benefit of decreasing the use of elective early delivery (Glavind et al. 2013; Howell et al. 2014; Little et al. 2014; Hutcheon et al. 2015).
The term “elective” is generally used to denote the absence of a medical or obstetric indication. However, it is common practice in obstetrics to schedule cesarean deliveries for women with certain baseline conditions (i.e., conditions generally present before the term period) such as breech presentation, prior cesarean delivery, or active herpes infection. For such women, cesareans can be considered medically indicated (ACOG 2013; Salim and Shalev 2010). In 2011, Oregon became the first state to implement a statewide hard stop policy limiting elective early deliveries (Snowden et al. 2016). One of the goals of the hard stop policy was to prevent the elective scheduling of such procedures in the early‐term period, thereby delaying the timing of antepartum indicated cesareans to full term (i.e., 39 weeks or beyond). The policy required review and approval for scheduled cesareans and inductions of labor occurring prior to 39 weeks' gestation with no documented medical indication. The policy was championed by the Oregon Perinatal Collaborative and was implemented at the hospital and health system level. Maternity hospitals serving over half of the state's population, including all in the Portland Metropolitan area, adopted the policy in 2011 and by 2012, 49 of the 52 hospitals in Oregon who provide obstetric care, signed on to the hard stop policy. A prior study on Oregon's hard stop policy found that elective early‐term induction of labor and cesarean delivery decreased after policy implementation, although the hoped‐for neonatal health benefits were not realized (Snowden et al. 2016). In this study, we aimed to build on this work by (1) further refining definitions of elective early‐term cesarean delivery in vital records data, (2) examining how various categories of early‐term cesarean delivery changed after the hard stop policy, and (3) employing alternative methodological approaches to assess robustness of findings, accounting for secular time trends.
The objective of the current study was to assess changes in the use and timing of antepartum indicated cesareans and other categories of cesarean in Oregon before and after the implementation of Oregon's hard stop policy, using various methods to control for secular trends in elective early delivery before and after the hard stop policy. We were also interested in studying how neonatal complication rates changed after the hard stop policy. We hypothesized a decrease in early‐term scheduled cesareans. We also hypothesized that the policy would delay delivery for women with antepartum indications for cesarean, resulting in an increase in labored, unscheduled cesarean deliveries in the full‐term periods among these women (an unintended policy effect). We hypothesized no change in intrapartum cesarean deliveries without antepartum indications. By studying patterns of cesarean delivery and neonatal complications following a statewide hard stop policy, we sought to inform policy efforts aimed at improving the best practices and quality of care in obstetrics.
Methods
This was a retrospective cohort study that examined the implementation of a hard stop policy in Oregon. We utilized Oregon birth certificate data from 2008 to 2013 provided by the Oregon Center for Health Statistics—a division of the Oregon Health Authority. Generally, data on the birth certificate regarding type of delivery and medical history are derived from patient's clinical records. We were primarily interested in timing of cesarean delivery among women with antepartum indications for cesarean, but where early‐term timing of delivery was not specifically indicated, as such deliveries were a primary target of the policy. Therefore, we excluded women with gestational and pregestational diabetes and chronic hypertension, as these conditions may be indications for early scheduling of delivery. We also excluded preterm (<37 weeks) deliveries, anomalous neonates, multiple gestations, and out‐of‐hospital births. Our primary exposure was Oregon's hard stop policy, which was implemented in early 2011. Therefore, we defined a prepolicy period (2008–2010) and a postpolicy period (2012–2013) and excluded 2011 as a transition period.
Categorizing Cesarean Delivery
Our primary outcome of interest was the prevalence of cesarean delivery by gestational age. Cesarean deliveries were identified from mode of birth reported on birth certificates. Cesarean deliveries fall into different categories based on the presence of medical indications (i.e., indicated cesarean, nonindicated cesarean), the timing of these indications with regard to labor (i.e., antepartum indications such as breech fetal presentation versus intrapartum indications such as fetal intolerance of labor), and the presence or absence of labor. Each category is different with regard to obstetric management and practice considerations. Therefore, we defined four mutually exclusive cesarean delivery categories using information available on the birth certificate. The purpose of this classification system was to distinguish between cesarean deliveries that were targeted by the hard stop policy (e.g., some categories of early‐term cesarean delivery where cesarean is indicated, but delivery before 39 weeks' gestation is not medically necessary) from those that were not targeted by the policy (e.g., emergent cesareans). Although a prior study on Oregon's hard stop policy used a simpler definition of “elective early‐term cesarean delivery” (based on the Joint Commission's definition), in the present study we sought to add more nuance and detail to categorization of cesarean delivery that may be achieved using secondary data (Snowden et al. 2016). In particular, we considered prior cesarean delivery to be an indication for repeat cesarean delivery in some—but not all—instances, distinct from both the prior study and the Joint Commission's definition.
We developed an algorithm to define four categories of cesarean delivery based on the presence of baseline indications for cesarean, the presence of a trial of labor, and the presence of other markers of labor as recorded on the birth certificate (Figure 1). Birth certificate‐based algorithms have been developed for research on other outcomes (e.g., spontaneous vs. provider‐initiated preterm birth) (Klebanoff et al. 2016) and claims data‐based algorithms exist for elective cesarean (Gregory et al. 2002), and here, we applied a similar approach to categorize term cesarean deliveries.
Figure 1.
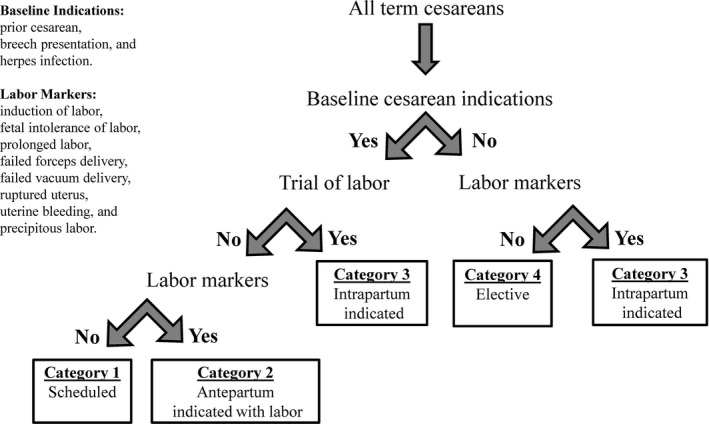
Classification of Cesarean Deliveries
The first consideration in our algorithm was the presence or absence of antepartum indications for cesarean, that is, those which are present before labor but which do not require an early‐term delivery. Based on the Joint Commission criteria, prior cesarean and breech presentation meet these criteria (Kozhimannil, Macheras, and Lorch 2014). We also included herpes infection (assumed to be an active infection if recorded on the birth certificate) as an antepartum indication for cesareans based on previous literature and conventional obstetric practice (ACOG and SMFM 2014). The exception to the above was if there was a trial of labor, in which case we had evidence that the woman and her provider did not consider these factors to be indications for cesarean, because a vaginal birth was attempted (thus departing from the Joint Commission's definition of elective early‐term cesarean and incorporating more nuance about intended mode of delivery). In the Oregon birth certificate, trial of labor is only coded for women who have had a prior cesarean section. There are other markers of labor recorded on the birth certificate: induction of labor, fetal intolerance of labor, prolonged labor, failed forceps delivery, failed vacuum delivery, ruptured uterus, uterine bleeding, and precipitous labor. Together, these three factors (antepartum indications for cesarean, trial of labor, and other labor markers) were used in our algorithm to categorize cesarean deliveries.
Based on these definitions, cesareans were assigned to one of the following four categories, as depicted by the flow diagram in Figure 1. Antepartum indicated and scheduled cesareans (category 1): These were cesarean deliveries to women with baseline indications for cesarean delivery (e.g., breech presentation) with no trial of labor, and no record of labor having occurred. Antepartum indicated cesareans with labor (category 2) were cesarean deliveries to women with baseline indications for cesarean delivery such as breech presentation, or prior cesarean with no trial of labor attempted, but with markers of labor present. Cesarean births in this category were likely intended to be scheduled, but it can be inferred that labor occurred prior to the scheduled date. Intrapartum indicated cesareans (category 3) were cesarean deliveries either to women with prior cesarean who did have a trial of labor, or women with no baseline cesarean indications who experienced labor before delivery. Because there were no baseline indications for cesarean delivery present (or, the woman attempted a trial of labor in the case of prior cesarean), these could not be considered antepartum indicated cesareans (as Category 2 are), but cesarean delivery became indicated during the course of labor (i.e., intrapartum). Finally, elective cesareans (category 4) were cesarean deliveries where antepartum indications for cesarean were absent, and there was no record of labor having occurred.
To demonstrate how this categorization system applies to the Oregon hard stop policy, the policy sought to decrease scheduled cesareans and elective cesareans in the early‐term period (categories 1 and 4). Antepartum indicated cesareans with labor and intrapartum indicated cesareans (categories 2 and 3) were not targeted by the policy. However, decreasing early‐term scheduled cesareans (i.e., births intended to be category 1 cesareans) prolongs gestation, whether by days or weeks, and this has the potential to inadvertently increase the frequency of labored cesarean delivery among this group of women who were indicated for a cesarean delivery (i.e., to increase the likelihood of category 2, a potential unintended result of the policy). Concretely, a woman with a breech fetal presentation who had intended a scheduled cesarean delivery at 37 weeks before the policy might end up going into labor at 38 weeks, becoming an antepartum indicated cesarean with labor in the postpolicy period, requiring an unscheduled cesarean in labor, with potential implications for maternal/infant health (e.g., intrapartum injury to the fetus) and health care systems (e.g., straining labor and delivery capacity with an unplanned high‐risk birth at an unpredictable time) (Pasupathy et al. 2010; Hutcheon et al. 2015).
Outcome Definitions
Our primary outcome was the odds of cesarean delivery, overall and within category‐specific rates (e.g., odds of scheduled cesarean delivery and odds of elective cesarean delivery). To assess the association between the hard stop policy and the timing of cesarean delivery, we further subdivided each category into early‐term (37–38 weeks' gestation) and full‐term (39 or more weeks' gestation) cesarean deliveries. Finally, we analyzed the population‐level frequency of two term neonatal outcomes which were common enough to enable adequate power, and which could be affected by changing timing and practice patterns around cesarean delivery. Specifically, we analyzed NICU admission and assisted ventilation in the newborn among cesarean deliveries, two outcomes which were expected to be decreased by delaying elective early births.
Statistical Analysis
We calculated the prevalence of total cesarean deliveries and of cesareans in each category, as a proportion of all births. Pearson's chi‐square tests were performed to test for significant differences in prevalence pre‐ and postpolicy. We also examined the unadjusted yearly prevalence of each category of cesarean to determine the overall trends from 2008 to 2013 (all years inclusive). To account for potential confounding factors, we utilized multivariable logistic regression (model 1) to compare the odds of each cesarean category (overall cesareans and four categories of cesarean; all term gestations, early, or full term; 15 regression models in all) between the prepolicy and postpolicy periods. The regression models adjusted for maternal age (<35 vs. 35 or more years), racial‐ethnic category (Hispanic, non‐Hispanic white [referent], non‐Hispanic black, Asian, and American Indian/Alaska Native), insurance type (Medicaid vs. not Medicaid), parity (nulliparous vs. multiparous), education (>12 vs. 12 or fewer years of education), and prenatal care utilization (≥5 vs. <5 prenatal care visits). Regression models used an ongoing pregnancies denominator, analyzing outcomes among all pregnancies at risk for the outcome (Basso 2016; Caughey and Snowden 2016). Specifically, models for early‐term cesarean included all births at 37 weeks' gestation and beyond; models for full‐term cesarean delivery were restricted to births at 39 weeks' gestation and beyond. For NICU admissions and assisted ventilation, we compared the adjusted odds of each condition in the pre‐ and postpolicy periods for all cesareans and for each of the four cesarean categories. We employed two distinct analytical approaches to account for secular time trends and to test robustness of our main results to an alternative model specification. Specifically, we controlled for calendar time using a linear main‐term (6‐month intervals; model 2). Finally, we conducted interrupted time series analyses, modeling the policy period, calendar time (6‐month intervals), and their interaction to isolate policy effects (model 3) (Wagner et al. 2002). Because of small event numbers and model nonconvergence, we present results from all three models where possible (e.g., most categories of cesarean delivery), but only model 1 and model 2 result for infant outcomes.
This study was approved by the Oregon Health & Sciences University Institutional Review Board and the State of Oregon Department of Vital Statistics.
Results
Our final analytical sample comprised 187,704 deliveries (115,790 for 2008–2010 and 71,914 for 2012–2013). Almost 70 percent of the women were non‐Hispanic white, and about 20 percent were Hispanic. Over 40 percent of deliveries were covered by Medicaid and a large majority of deliveries were preceded by five or more prenatal care visits (Table 1). The overall prevalence of any baseline indication for cesarean increased from 16.0 percent to 18.5 percent (p < .001) from the prepolicy to the postpolicy period. The prevalence of breech presentation remained stable from the prepolicy to the postpolicy period, but there was an increase in the prevalence of women with prior cesareans (11.4 percent to 13.1 percent) and women with herpes infection (2.8 percent to 3.8 percent; Table 1). The overall prevalence of any labor marker decreased slightly (56.4 percent to 55.8 percent, p = .018; Table 1).
Table 1.
Sample Characteristics of Women Delivering in Oregon before the Hard Stop Policy (2008–2010) and after (2012–2013)
| Overall | Prepolicy (2008–2010) | Postpolicy (2012–2013) | p Valuea | |
|---|---|---|---|---|
| Total (N) | 187,704 | 115,790 | 71,914 | |
| Age >35 years | 13.4% | 12.9% | 14.3% | <.001 |
| Race/ethnicity | ||||
| White | 68.0% | 67.6% | 68.7% | <.001 |
| Black | 2.4% | 2.4% | 2.5% | .179 |
| Hispanic | 20.0% | 20.7% | 18.8% | <.001 |
| Asian | 5.8% | 5.7% | 6.1% | <.001 |
| American Indian/Alaska Native | 2.5% | 2.4% | 2.6% | .069 |
| Medicaid insurance | 43.4% | 42.6% | 44.6% | <.001 |
| >12 years education | 57.7% | 55.3% | 61.5% | <.001 |
| Nulliparous | 42.1% | 42.3% | 41.8% | .069 |
| ≥5 prenatal care visits | 97.5% | 97.4% | 97.7% | <.001 |
| Baseline indications for cesarean | ||||
| Any baseline indication | 16.9% | 16.0% | 18.5% | <.001 |
| Breech presentation | 2.5% | 2.5% | 2.6% | .393 |
| Prior cesarean | 12.1% | 11.4% | 13.1% | <.001 |
| Herpes infection | 3.2% | 2.8% | 3.8% | <.001 |
| Markers of labor | ||||
| Any marker of labor | 56.2% | 56.4% | 55.8% | .018 |
| Induction of labor | 29.0% | 29.2% | 28.7% | .016 |
| Labor augmentation | 25.2% | 24.6% | 26.2% | <.001 |
| Trial of labor after cesarean | 10.9% | 11.0% | 10.6% | .001 |
| Fetal intolerance of labor | 4.8% | 5.5% | 3.7% | <.001 |
| Prolonged labor | 2.8% | 2.6% | 3.0% | <.001 |
| Precipitous labor | 4.7% | 4.4% | 5.2% | <.001 |
| Uterine rupture | 0.02% | 0.02% | 0.03% | .144 |
| Uterine bleeding | 1.4% | 1.3% | 1.6% | <.001 |
| Failed forceps delivery | 0.2% | 0.3% | 0.1% | <.001 |
| Failed vacuum delivery | 0.6% | 0.8% | 0.3% | <.001 |
| Neonatal morbidities | ||||
| NICU admission | 2.7% | 2.6% | 2.8% | .076 |
| Assisted ventilation | 3.4% | 3.5% | 3.2% | .015 |
Chi‐square analysis comparing prevalence in the prepolicy to the prevalence in the postpolicy periods.
NICU, neonatal intensive care unit.
There were 49,602 cesarean deliveries in the study period, and the overall cesarean prevalence dropped from 26.8 percent in the prepolicy period (N = 31,078) to 25.8 percent in the postpolicy period (N = 18,524, p < .001); time trends for each category of cesarean delivery are presented in Figure 2. In unadjusted comparisons between the prepolicy and postpolicy periods (Table 2), changes were observed in all subcategories of early‐term cesarean deliveries, and these changes persisted after adjusting for potential confounding factors in logistic regression models (model 1), and in some categories after adjusting for secular time trends (models 2 and 3). The prevalence of all scheduled cesareans (category 1 cesarean deliveries, which before 39 weeks' gestation were targeted by the policy) increased from 10.7 percent to 11.7 percent, while intrapartum indicated cesareans with labor (category 3, not targeted by the policy) decreased from 11.9 percent to 10.8 percent (Table 2).
Figure 2.
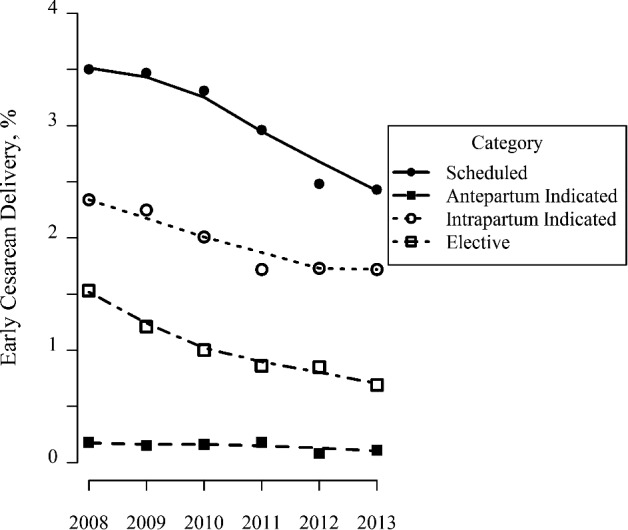
Trends in Early‐Term Cesarean Delivery (2008–2013)
Table 2.
Unadjusted Prevalence and Adjusted Odds of Cesarean Delivery Categories between Prepolicy (2008–2010) and Postpolicy (2012–2013) Periods
| Prepolicy (N = 115,790) | Postpolicy (N = 71,914) | Model 1: Adjusted OR (CI)† | Model 2: Adjusted OR (CI)‡ | Model 3: Adjusted OR (CI)§ | |
|---|---|---|---|---|---|
| All cesarean (N = 49,602) | 26.8% | 25.8%** | 0.94 (0.92–0.96) | 0.95 (0.90–1.01) | 1.02 (0.68–1.19) |
| Early‐term cesarean | 7.1% | 5.0%** | 0.70 (0.67–0.73) | 0.92 (0.84–1.02) | 0.72 (0.51–1.00) |
| Full‐term cesarean¶ | 26.0% | 26.0% | 0.99 (0.97–1.01) | 0.97 (0.91–1.03) | 1.09 (0.90–1.30) |
| 1. All scheduled cesarean (N = 20,734) | 10.7% | 11.7%** | 1.10 (1.07–1.13) | 0.87 (0.81–0.94) | 1.34 (1.06–1.69) |
| Early‐term scheduled cesarean | 3.4% | 2.5%** | 0.70 (0.66–0.74) | 0.76 (0.66–0.87) | 0.76 (0.47–1.21) |
| Full‐term scheduled cesarean¶ | 9.5% | 11.6%** | 1.22 (1.18–1.27) | 0.91 (0.83–1.00) | 1.56 (1.20–2.02) |
| 2. All antepartum indicated cesarean (N = 750) | 0.5% | 0.3%** | 0.61 (0.52–0.72) | 0.52 (0.37–0.75) | NA |
| Early‐term antepartum indicated cesarean | 0.2% | 0.1%** | 0.54 (0.40–0.72) | 0.65 (0.35–1.21) | NA |
| Full‐term antepartum indicated cesarean¶ | 0.4% | 0.3%** | 0.62 (0.51–0.75) | 0.47 (0.30–0.73) | NA |
| 3. All intrapartum indicated cesarean (N = 21,580) | 11.9% | 10.8%** | 0.89 (0.86–0.91) | 0.99 (0.92–1.07) | 0.91 (0.72–1.16) |
| Early‐term intrapartum indicated cesarean | 2.2% | 1.7%** | 0.79 (0.74–0.85) | 1.05 (0.89–1.24) | 1.03 (0.86–1.22) |
| Full‐term intrapartum indicated cesarean¶ | 12.8% | 11.4%** | 0.88 (0.85–0.91) | 0.99 (0.91–1.08) | 0.94 (0.72–1.22) |
| 4. All elective cesarean (N = 6,538) | 3.8% | 3.0%** | 0.77 (0.73–0.82) | 1.20 (1.05–1.37) | 0.88 (0.58–1.33) |
| Early‐term elective cesarean | 1.3% | 0.8%** | 0.59 (0.53–0.65) | 1.31 (1.04–1.66) | 1.11 (0.49–2.52) |
| Full‐term elective cesarean¶ | 3.3% | 2.8%** | 0.82 (0.77–0.88) | 1.14 (0.97–1.33) | 0.79 (0.49–1.28) |
Notes. Bold typeface indicates results are significant at the p < 0.05 level.
*p < .05; **p < .001.
†Multivariable logistic regression model estimates (model 1), controlling for maternal age (<35 vs. 35 or more years), racial‐ethnic category (Hispanic, non‐Hispanic white, non‐Hispanic black, non‐Hispanic Asian, and non‐Hispanic American Indian/Alaska Native), insurance type (Medicaid vs. not Medicaid), parity (nulliparous vs. multiparous), education (>12 vs. 12 or fewer years of education), prenatal care (≥5 prenatal care visits vs. <5 prenatal care visits).
‡Time‐adjusted model (model 2), controlling for all covariates listed above as well as calendar time (6‐month intervals).
§Interrupted time series model estimates (model 3), controlling for all covariates listed above (time coded in 6‐month intervals).
¶Models for full‐term cesarean categories were restricted to full‐term deliveries (39 weeks' gestation and beyond).
NA: results not available due to model nonconvergence.
The odds of early‐term category 1 scheduled cesareans were lower in the postpolicy period in all three analytical models, but they did not reach statistical significance in the interrupted time series model (multivariable logistic regression, adjusted odds ratio, [aOR], 0.70; 95 percent confidence interval [CI], 0.66–0.74; time‐adjusted model, aOR, 0.76; 95 percent CI, 0.66–0.87, and interrupted time series, aOR, 0.76; 95 percent CI, 0.47–1.21; Table 2). The odds of early‐term category 2 antepartum indicated cesareans were also lower postpolicy in one of the two models that converged (multivariable logistic regression, adjusted odds ratio, [aOR] 0.54, CI (0.40–0.72; time‐adjusted model, aOR 0.65, CI (0.35–1.21); Table 2). The odds of full‐term scheduled category 1 cesarean delivery were higher in the postpolicy period in model 1 (aOR, 1.22; 95 percent CI, 1.18–1.27) and the interrupted time series model (aOR, 1.56; 95 percent CI, 1.20–2.02), but not model 2 (aOR, 0.91; 95 percent CI, 0.83–1.00).
The broad trend toward decreased odds of cesarean delivery that was present in model 1 for most categories of cesarean delivery was frequently attenuated in the models controlling for time. For example, odds of early‐term intrapartum indicated cesarean delivery (category 3) was lower in the postpolicy period in model 1 (aOR, 0.79; 95 percent CI, 0.74–0.85), but not in either model controlling for time (e.g., interrupted time series aOR, 1.03; 95 percent CI, 0.86, 1.22). Postpolicy odds of early‐term elective cesarean (category 4) were lower in model 1 (OR, 0.59; 95 percent CI, 0.53–0.65), higher in model 2 (aOR, 1.31; 95 percent CI, 1.04–1.66), and not significantly different in model 3 (aOR, 1.11; 95 percent CI, 0.49–2.52), highlighting one outcome category where results differed by modeling approach.
For neonatal outcomes, results differed between model 1 and model 2. In the regression model not controlling for time (model 1), odds of assisted ventilation were lower among category 1 cesareans (aOR, 0.81; 95 percent CI, 0.69–0.95), and higher among category 3 and 4 cesareans (aOR, 1.14; 95 percent CI, 1.02–1.27 and aOR, 1.45; 95 percent CI, 1.08–1.95, respectively; Table 3). Odds of NICU admission were also higher among category 3 cesareans in model 1 (aOR, 1.15; 95 percent CI, 1.02–1.29). None of these findings of higher odds persisted in model 2 (controlling for time), but odds of outcomes were lower in several subgroups. Odds of NICU admission were lower in category 1 scheduled cesarean deliveries (aOR, 0.64; 95 percent CI, 0.42–0.96) and odds of assisted ventilation were lower overall (aOR, 0.76; 96 percent CI, 0.62–0.94) and in scheduled cesareans (aOR, 0.59; 95 percent CI, 0.41–0.85).
Table 3.
Adjusted Odds Ratios for Neonatal Health Outcomes Comparing the Postpolicy (2012–2013) to the Prepolicy (2008–2010) Periods
| Adjusted OR (CI)a | Adjusted OR (CI)b | |
|---|---|---|
| NICU admission: all cesareans | 1.06 (0.97–1.17) | 0.93 (0.74–1.16) |
| 1. Scheduled cesareans | 0.91 (0.77–1.08) | 0.64 (0.42–0.96) |
| 2. Antepartum indicated cesareans | 0.79 (0.37–1.68) | 2.96 (0.54–16.18) |
| 3. Intrapartum indicated cesareans | 1.15 (1.02–1.29) | 0.98 (0.73–1.32) |
| 4. Elective cesareans | 1.29 (0.98–1.70) | 1.56 (0.81–3.00) |
| Assisted ventilation: all cesareans | 1.03 (0.94–1.12) | 0.76 (0.62–0.94) |
| 1. Scheduled cesareans | 0.81 (0.69–0.95) | 0.59 (0.41–0.85) |
| 2. Antepartum indicated cesareans | 0.45 (0.20–1.02) | 0.29 (0.06–1.44) |
| 3. Intrapartum indicated cesareans | 1.14 (1.02–1.27) | 0.86 (0.66–1.13) |
| 4. Elective cesareans | 1.45 (1.08–1.95) | 0.95 (0.48–1.88) |
Notes. Bold typeface indicates results are significant at the p < 0.05 level.
Multivariable logistic regression model estimates (model 1), controlling for maternal age (<35 vs. 35 or more years), racial‐ethnic category (Hispanic, non‐Hispanic white, non‐Hispanic black, non‐Hispanic Asian, and non‐Hispanic American Indian/Alaska Native), insurance type (Medicaid vs. not Medicaid), parity (nulliparous vs. multiparous), education (>12 vs. 12 or fewer years of education), and prenatal care (≥5 prenatal care visits vs. <5 prenatal care visits).
Time‐adjusted model (model 2), controlling for all covariates listed above as well as calendar time (6‐month intervals).
NICU, neonatal intensive care unit.
Discussion
In this study, our goal was to track practice regarding obstetric procedures before and after implementation of a new policy, and to assess for potential impacts on adverse neonatal outcomes using multiple analytical approaches. As hypothesized, odds of early‐term scheduled cesareans were significantly lower postpolicy, a finding that was robust to multiple methodological approaches of controlling for time. Two modeling approaches (model 1 and model 3, interrupted time series) provided evidence for the hypothesized increase in full‐term scheduled cesareans. Our study findings add to the evidence that policies that target delaying early‐term scheduled cesareans are effective in achieving that aim and may be associated with declines in other categories of early‐term cesareans.
The hypothesized increase in category 2 (i.e., antepartum indicated cesarean deliveries with labor) was not realized; these were less frequent in the postpolicy period. As relates to potential effects of the policy on other categories of cesarean delivery (e.g., intrapartum cesarean delivery and elective cesarean delivery) and neonatal outcomes among cesareans, interpretations are less straightforward and are affected by time trends in these outcomes, as evidenced by how results differed between our various modeling approaches. The models employed increasingly fine‐grained control for time, from a basic pre/postmodel with no adjustment for time trends (model 1), to additionally controlling for time using a linear term (model 2), to additionally including an interaction term between postpolicy period and time (i.e., allowing for different slopes in the pre‐ and postpolicy periods in an interrupted time series approach; model 3). The decrease in the key outcome of interest (early‐term scheduled cesarean delivery) was fairly consistent in magnitude across all models (decreased odds by a magnitude of 25–30 percent, albeit with less precision in model 3, as would be expected). Other outcomes differed more between modeling approaches.
Apparent decreases in intrapartum indicated cesareans in model 1 attenuated in both models 2 and 3, suggesting these finding were driven by time trends. Less easily interpreted are results for full‐term scheduled cesarean (odds of which appeared to be higher postpolicy in models 1 and 3, but not model 2) and elective cesareans (odds of which appeared to be lower postpolicy in model 1, higher in model 2, and not statistically different in model 3). There was also a suggestion of lower postpolicy odds of assisted ventilation in model 2 but not model 1. Collectively, we believe that these differing results for full‐term schedule cesareans, elective cesareans, and assisted ventilation highlight the sensitivity of these findings to alternative parameterizations of time, but they do not lend themselves to clear scientific interpretations (in contrast to our early‐term scheduled cesarean findings). It is difficult to know whether these differences owe to more comprehensive control for calendar time with increasing model complexity or to violations of model assumptions with increasing model complexity. This suggests an important future direction for research in obstetric procedure use and also highlights the importance of alternative study designs to address the question of intended and unintended policy effects on obstetric procedure use and subsequent outcomes (e.g., geographically clustered ecologic studies and randomized controlled trials).
We also assessed potential unintended effects of such policies and the associated decrease/delay in cesarean use. It is reassuring that the findings of increases in NICU admission and assisted ventilation in some categories of cesarean deliveries were not robust to control for time, and they may have decreased in the postpolicy period (as is the intent of such policies). The potential for such unintended effects of delayed and/or decreased procedure use is a distinct concern especially when early‐term delivery may be warranted, and it should be included in evaluations of such policies, so unintended adverse consequences can be weighed against the benefits of such policies. Our results did not broadly support the existence of such unintended policy effects, but we encourage future research to examine this question as well, especially given differing results after control for time trends.
It is important to note that we examined only trends in elective early‐term cesarean delivery in this study, although the policy targeted both elective early‐term labor induction as well (and was associated with a decrease in this procedure; Snowden et al. 2016). Given the complex and controversial association between induction of labor and cesarean delivery (Grobman 2016), it will also be important for future research to consider how trends in elective early‐term induction may affect trends in cesarean delivery. We suspect that an overall shift in policy climate and provider attitudes toward utilizing pregnancy interventions overall including cesareans could be driving the decrease of cesarean delivery, in addition to the hard stop policy. There has been an overall stabilization and decrease in cesarean delivery in recent years, which aligns with the broad national goals of safely reducing the prevalence of cesarean delivery rates (ACOG and SMFM 2014). Recognizing the importance of cesarean reduction among the targeted groups of women, it is nonetheless essential to ensure and that women who do require cesareans have access to the procedure.
Our study is not without limitations. Cesarean delivery classifications were based on birth certificate data that are of varying validity and reliability. Birth certificate data have been reported to have good accuracy for mode of delivery generally and cesarean delivery specifically (Reichman and Hade 2001; Zollinger, Przybylski, and Gamache 2006; Martin et al. 2013). However, birth certificates have also been found to have lower accuracy for presence of labor, complications of labor, and obstetric procedures (Northam and Knapp 2006; Zollinger, Przybylski, and Gamache 2006; Martin et al. 2013). Such misclassification could explain our findings as relates to elective cesareans: Some proportion could be labored cesareans in which labor was not recorded on the birth certificate. Another limitation of birth certificate data is that some important prenatal and perinatal information is not captured and this could have led to misclassification bias, for example, of elective cesareans in our study (e.g., through the birth certificate noting herpes infection for women without an active outbreak). Another example is maternal conditions like placenta previa, HIV infection, and coagulation disorders, which are indications for early scheduled delivery and should have been exclusion criteria in our study (Kozhimannil, Macheras, and Lorch 2014), but these conditions are not captured in the birth certificate. Another example is patient–provider interactions and dynamics, which may affect obstetric procedure use (Jou et al. 2015) and are not captured in secondary data. Although we analyzed the population of an entire state over years, given the frequency of some categories of cesarean delivery and outcomes of interest, we still lacked adequate samples size and statistical power to analyze all outcomes using interrupted time series analysis. We also did not account for clustering of observations by hospital, which introduces bias into our calculation of standard errors but not point estimates. These data limitations identify an important opportunity for future improvements in data collection. Vital records, however, continue to be a critical data source for population‐level maternal/child research.
Despite these limitations, our study analyzed a unique population that was exposed to a statewide policy over a substantial number of hospitals (nearly all of Oregon's 52 maternity hospitals). This provided an important opportunity to evaluate a policy limiting elective early‐term cesarean delivery, to fill evidence gaps on procedure use and health outcomes after such policies and inform future policy and practice. Crafting and evaluating such policies require considering the appropriate clinical goals for categories of cesarean delivery that are targeted by the policy and understanding the potential maternal and neonatal outcomes that may result from such policies (both intended and unintended effects). We found evidence that the hard stop policy was associated with a decrease in early‐term scheduled cesareans and an increase in full‐term scheduled cesareans, but the findings were mixed as relates to neonatal outcomes. One modeling approach suggested benefit of the hard stop policy in reducing adverse neonatal outcomes among cesarean deliveries, which has been the main premise behind policies and initiatives limiting nonmedically indicated early‐term deliveries. As such policies continue to gain momentum both nationally and internationally, it will be essential to continue to critically assess of the benefits and potential risks of these policies, to inform clinical practice and policy. Only by fully characterizing the many potential consequences of such policies can we further refine quality measures and policy in obstetrics, to maximize health outcomes for women and babies.
Supporting information
Appendix SA1: Author Matrix.
Acknowledgments
Joint Acknowledgment/Disclosure Statement: JMS is supported by the Eunice Kennedy Shriver National Institute of Child Health and Human Development (grant number R00 HD079658‐03).
This project was supported by the Health Resources and Services Administration (HRSA) of the U.S. Department of Health and Human Services (HHS) under Policy R40 Award (number R40 MC268090201). This information or content and conclusions are those of the author and should not be construed as the official position or policy of nor should any endorsements be inferred by HRSA, HHS, or the U.S. Government.
Disclaimer: None.
Disclosure: None.
Portions of this research were presented at the 36th Annual Pregnancy Meeting of the Society for Maternal‐Fetal Medicine (February 1–6, 2016) in Atlanta, GA.
References
- ACOG (American College of Obstetricians, Gynecologists) . 2013. “ACOG Committee Opinion no. 560: Medically Indicated Late‐Preterm and Early‐Term Deliveries.” Obstetrics and Gynecology 121 (4): 908–10. [DOI] [PubMed] [Google Scholar]
- ACOG (American College of Obstetricians & Gynecologists) , and SMFM (Society for Maternal‐Fetal Medicine) . 2014. “Obstetric Care Consensus No. 1: Safe Prevention of the Primary Cesarean Delivery.” Obstetrics and Gynecology 123 (3): 693–711. [DOI] [PubMed] [Google Scholar]
- Basso, O. 2016. “Implications of Using a Fetuses‐at‐Risk Approach When Fetuses Are Not at Risk.” Paediatric and Perinatal Epidemiology 30 (1): 3–10. [DOI] [PubMed] [Google Scholar]
- Caughey, A. B. , and Snowden J. M.. 2016. “Measuring Perinatal Complications: Different Approaches Depending on Who Is at Risk.” Paediatric and Perinatal Epidemiology 30 (1): 23–4. [DOI] [PubMed] [Google Scholar]
- Cheng, Y. W. , Nicholson J. M., Nakagawa S., Bruckner T. A., Washington A. E., and Caughey A. B.. 2008. “Perinatal Outcomes in Low‐Risk Term Pregnancies: Do They Differ By Week of Gestation?” American Journal of Obstetrics and Gynecology 199 (4): 370.e1–7. [DOI] [PubMed] [Google Scholar]
- Doan, E. , Gibbons K., and Tudehope D.. 2014. “The Timing of Elective Caesarean Deliveries and Early Neonatal Outcomes in Singleton Infants Born 37‐41 Weeks' Gestation.” Australian and New Zealand Journal of Obstetrics and Gynaecology 54 (4): 340–7. [DOI] [PubMed] [Google Scholar]
- Donovan, E. F. , Lannon C., Bailit J., Rose B., Iams J. D., and Byczkowski T.. 2010. “A Statewide Initiative to Reduce Inappropriate Scheduled Births at 36(0/7)‐38(6/7) Weeks' Gestation.” American Journal of Obstetrics and Gynecology 202 (3): 243.e1–8. [DOI] [PubMed] [Google Scholar]
- Ehrenthal, D. B. , Hoffman M. K., Jiang X., and Ostrum G.. 2011. “Neonatal Outcomes After Implementation of Guidelines Limiting Elective Delivery before 39 Weeks of Gestation.” Obstetrics & Gynecology 118 (5): 1047–55. [DOI] [PubMed] [Google Scholar]
- Gawlik, S. , Muller M., Kuon R. J., Szabo A. Z., Keller D., and Sohn C.. 2014. “Timing of Elective Repeat Caesarean Does Matter: Importance of Avoiding Early‐Term Delivery Especially in Diabetic Patients.” Journal of Obstetrics and Gynaecology 35 (5): 455–60. [DOI] [PubMed] [Google Scholar]
- Glavind, J. , Kindberg S. F., Uldbjerg N., Khalil M., Moller A. M., Mortensen B. B., Rasmussen O. B., Christensen J. T., Jorgensen J. S., and Henriksen T. B.. 2013. “Elective Caesarean Section at 38 Weeks versus 39 Weeks: Neonatal and Maternal Outcomes in a Randomised Controlled Trial.” BJOG 120 (9): 1123–32. [DOI] [PubMed] [Google Scholar]
- Gregory, K. D. , Korst L. M., Gornbein J. A., and Platt L. D.. 2002. “Using Administrative Data to Identify Indications for Elective Primary Cesarean Delivery.” Health Services Research 37 (5): 1387–401. [DOI] [PMC free article] [PubMed] [Google Scholar]
- Grobman, W. A. 2016. “Induction of Labor and Cesarean Delivery.” New England Journal of Medicine 374 (9): 880–1. [DOI] [PubMed] [Google Scholar]
- Howell, E. A. , Zeitlin J., Hebert P. L., Balbierz A., and Egorova N.. 2014. “Association between Hospital‐Level Obstetric Quality Indicators and Maternal and Neonatal Morbidity.” Journal of the American Medical Association 312 (15): 1531–41. [DOI] [PMC free article] [PubMed] [Google Scholar]
- Hutcheon, J. A. , Strumpf E. C., Harper S., and Giesbrecht E.. 2015. “Maternal and Neonatal Outcomes after Implementation of a Hospital Policy to Limit Low‐Risk Planned Caesarean Deliveries before 39 Weeks of Gestation: An Interrupted Time‐Series Analysis.” BJOG 122 (9): 1200–6. [DOI] [PubMed] [Google Scholar]
- Jou, J. , Kozhimannil K. B., Johnson P. J., and Sakala C.. 2015. “Patient‐Perceived Pressure from Clinicians for Labor Induction and Cesarean Delivery: A Population‐Based Survey of U.S. Women.” Health Services Research 50 (4): 961–81. [DOI] [PMC free article] [PubMed] [Google Scholar]
- Kenny, L. C. , Lavender T., McNamee R., O'Neill S. M., Mills T., and Khashan A. S.. 2013. “Advanced Maternal Age and Adverse Pregnancy Outcome: Evidence from a Large Contemporary Cohort.” PLoS ONE 8 (2): e56583. [DOI] [PMC free article] [PubMed] [Google Scholar]
- Klebanoff, M. A. , Yossef‐Salameh L., Latimer C., Oza‐Frank R., Kachoria R., Reagan P. B., Oliver E. A., Buhimschi C. S., and Buhimschi I. A.. 2016. “Development and Validation of an Algorithm to Determine Spontaneous Versus Provider‐Initiated Preterm Birth in US Vital Records.” Paediatric and Perinatal Epidemiology 30 (2): 134–40. [DOI] [PubMed] [Google Scholar]
- Kozhimannil, K. B. , Macheras M., and Lorch S. A.. 2014. “Trends in Childbirth Before 39 Weeks' Gestation without Medical Indication.” Medical Care 52 (7): 649–57. [DOI] [PMC free article] [PubMed] [Google Scholar]
- Little, S. E. , Robinson J. N., Puopolo K. M., Mukhopadhyay S., Wilkins‐Haug L. E., Acker D. A., and Zera C. A.. 2014. “The Effect of Obstetric Practice Change to Reduce Early Term Delivery on Perinatal Outcome.” Journal of Perinatology 34 (3): 176–80. [DOI] [PubMed] [Google Scholar]
- Martin, J. A. , Wilson E. C., Osterman M. J., Saadi E. W., Sutton S. R., and Hamilton B. E.. 2013. “Assessing the Quality of Medical and Health Data from the 2003 Birth Certificate Revision: Results from Two States.” National Vital Statistics Report 62 (2): 1–19. [PubMed] [Google Scholar]
- Northam, S. , and Knapp T. R.. 2006. “The Reliability and Validity of Birth Certificates.” Journal of Obstetric, Gynecologic & Neonatal Nursing 35 (1): 3–12. [DOI] [PubMed] [Google Scholar]
- Oshiro, B. T. , Henry E., Wilson J., Branch D. W., and Varner M. W.. 2009. “Decreasing Elective Deliveries before 39 Weeks of Gestation in an Integrated Health Care System.” Obstetrics & Gynecology 113 (4): 804–11. [DOI] [PubMed] [Google Scholar]
- Parikh, L. , Singh J., Timofeev J., Zahn C. M., Istwan N. B., Rhea D. J., and Driggers R. W.. 2014. “Timing and Consequences of Early Term and Late Term Deliveries.” Journal of Maternal‐Fetal & Neonatal Medicine 27 (11): 1158–62. [DOI] [PubMed] [Google Scholar]
- Pasupathy, D. , Wood A. M., Pell J. P., Fleming M., and Smith G. C.. 2010. “Time of Birth and Risk of Neonatal Death at Term: Retrospective Cohort Study.” British Medical Journal 341: c3498. [DOI] [PMC free article] [PubMed] [Google Scholar]
- Reddy, U. M. , Ko C. W., Raju T. N., and Willinger M.. 2009. “Delivery Indications at Late‐Preterm Gestations and Infant Mortality Rates in the United States.” Pediatrics 124 (1): 234–40. [DOI] [PMC free article] [PubMed] [Google Scholar]
- Reichman, N. E. , and Hade E. M.. 2001. “Validation of Birth Certificate Data. A Study of Women in New Jersey's HealthStart Program.” Annals of Epidemiology 11 (3): 186–93. [DOI] [PubMed] [Google Scholar]
- Salim, R. , and Shalev E.. 2010. “Health Implications Resulting from the Timing of Elective Cesarean Delivery.” Reproductive Biology and Endocrinology 8: 68. [DOI] [PMC free article] [PubMed] [Google Scholar]
- Snowden, J. M. , Muoto I., Darney B. G., Quigley B., Tomlinson M., Nielson D., Friedman S., Rogovoy J., and Caughey A. B.. 2016. “Oregon's Hard‐Stop Policy Limiting Elective Early‐Term Deliveries: Association with Obstetric Procedure Use and Health Outcomes.” Obstetrics & Gynecology 128 (6): 1389–96. [DOI] [PMC free article] [PubMed] [Google Scholar]
- Spong, C. Y. , Mercer B. M., D'Alton M., Kilpatrick S., Blackwell S., and Saade G.. 2011. “Timing of Indicated Late‐Preterm and Early‐Term Birth.” Obstetrics & Gynecology 118 (2 Pt 1): 323–33. [DOI] [PMC free article] [PubMed] [Google Scholar]
- Tita, A. T. , Landon M. B., Spong C. Y., Lai Y., Leveno K. J., Varner M. W., Moawad A. H., Caritis S. N., Meis P. J., Wapner R. J., Sorokin Y., Miodovnik M., Carpenter M., Peaceman A. M., O'Sullivan M. J., Sibai B. M., Langer O., Thorp J. M., Ramin S. M., and Mercer B. M.. 2009. “Timing of Elective Repeat Cesarean Delivery at Term and Neonatal Outcomes.” New England Journal of Medicine 360 (2): 111–20. [DOI] [PMC free article] [PubMed] [Google Scholar]
- Wagner, A. K. , Soumerai S. B., Zhang F., and Ross‐Degnan D.. 2002. “Segmented Regression Analysis of Interrupted Time Series Studies in Medication Use Research.” Journal of Clinical Pharmacy and Therapeutics 27 (4): 299–309. [DOI] [PubMed] [Google Scholar]
- Zollinger, T. W. , Przybylski M. J., and Gamache R. E.. 2006. “Reliability of Indiana Birth Certificate Data Compared to Medical Records.” Annals of Epidemiology 16 (1): 1–10. [DOI] [PubMed] [Google Scholar]
Associated Data
This section collects any data citations, data availability statements, or supplementary materials included in this article.
Supplementary Materials
Appendix SA1: Author Matrix.