

Abstract
Hepatocellular carcinoma (HCC) is the dominant histologic type of primary liver cancer, and hepatitis B virus (HBV) infection is one of the major causes of HCC in the chronic HBV. Our study was investigated the association between the polymorphisms of ACYP2 and MPHOSPH6 genes and the risk of HCC induced by HBV infection. A total of 490 subjects were divided into two groups: 248 HBV patients with HCC (Case group), and 242 HBV patients without HCC (Control group). Unconditional logistic regression analysis was used to evaluate the association. The genetic association analysis revealed variant of rs12621038 in ACYP2 gene had a significant association with increasing the risk of HBV-induced HCC based on the genotype, dominant and additive model (P<0.05). Moreover, our results also showed that minor allele “C” of rs3751862 was prevalent in cases than controls (P<0.05), and rs3751862 significantly increased the risk of HCC in chronic HBV carriers under genotype and dominant model (P<0.05). In addition, the haplotype “T-G-G” in MPHOSPH6 showed a harmful factor for the HBV-induced HCC (P<0.05). The results suggested that ACYP2 and MPHOSPH6 as the plausible candidate genes may predict the risk of HCC after chronic HBV infection in Chinese Han population, and further investigations in studies with a larger sample size and other races are needed to validate our findings. These data provide a theoretical foundation for future studies of this correlation between the polymorphisms of ACYP2 and MPHOSPH6 genes and the HCC in chronic HBV carriers.
Keywords: hepatocellular carcinoma (HCC), hepatitis B virus (HBV), ACYP2, MPHOSPH6, association analysis
INTRODUCTION
Liver and intrahepatic bile duct cancer is the fifth most common diagnosed cancer and ranks eighth among causes of cancer mortality worldwide, accounting for approximately 41,000 new cancer cases and 29,000 deaths in the United States in 2017 [1]. In China, liver cancer is also the most common etiology of the cancer death [2]. About 70%-90% of the primary liver cancers is hepatocellular carcinoma (HCC), which is a complex and multi-factorial related disease [3, 4], and many evidences have revealed that chronic infection with hepatitis B virus (HBV) and hepatitis C virus (HCV) contribute to the major risk factor for HCC globally [5, 6]. Furthermore, areas with a high prevalence of HBV infection such as southeastern Asia, African, HBV is the most common etiologic agent of HCC [7].
Epidemiological studies have demonstrated a 5 to 10-fold increase in the relative risk of HCC among HBV carriers compared to noncarriers [3]. HBV, a family of enveloped viruses with an incomplete double stranded DNA genome of 3.2 kb, belongs to hepadnaviridae. The genome of HBV is composed of four partially overlapping open reading frames, which encode the hepatitis B antigens, viral polymerase and multifunctional nonstructural protein. In the present study, many studies suggested that HBV genotypes, viral load, and viral mutations were closely associated with the occurrence of HCC [8, 9]. Additionally, host genetic variations played a crucial role in the occurrence and development of HBV related HCC [10, 11]. On the other hand, a genome wide association study (GWAS), demonstrated that 1p36.22 as a new susceptibility loci cluster for HCC in chronic HBV carriers were identified, and these data suggested that KIF1B, UBE4B or PGD might be a plausible causative genes for this malignancy in the Chinese population [12]. Consequently, seeking for some chronic HBV-related HCC susceptible sites has attracted many scholars’ attentions.
Presently, relative telomere length has emerged as a promising risk precursor of many cancers containing HCC [13-15], and GWAS studies have identified that ACYP2 is an important telomere length related gene [16]. ACYP2 gene, located on chromosome 2p16.2, encodes small cytosolic acylphosphatase enzyme, and publication have explored the association between ACYP2 polymorphisms liver cancer risk [17]. In addition, an association study has explored the polymorphisms of MPHOSPH6 on the risk of colorectal cancer [18]. MPHOSPH6 gene, located on chromosome 16q23.3, encodes M-phase phosphoprotein 6 might be involved in regulating cell cycle [19]. However, the association of ACYP2 and MPHOSPH6 genetic polymorphisms with risk of HCC in chronic HBV carriers was not clear in Chinese Han population. Therefore, in this study, we aimed to explore the effect of ACYP2 and MPHOSPH6 variations in the progression of chronic HBV induced HCC in Chinese Han population, and twelve SNPs have been selected from the two candidate genes.
RESULTS
Characteristic of the study participants
Demographic and epidemiological characteristics of the participants were summarized in Table 1. There was no significant difference in gender between the two groups (P=0.944), however, there was a significant difference between the case and control in mean age (54.47±12.05 vs 50.04±12.05, P<0.001). In this study, we also investigated the effects of cigarette smoking and alcohol consumption, but a considerable number of patients was not clear. Consequently, unconditional logistic regression analysis was performed adjusting for gender, age, cigarette smoking and alcohol consumption.
Table 1. Distributions of select variables in hepatocellular carcinoma patients and hepatitis B patients.
| Variables | Case | Control | P value |
|---|---|---|---|
| Gender | 0.944a | ||
| Male (%) | 192 (77.4%) | 188 (77.7%) | |
| Female (%) | 56 (22.6%) | 54 (22.3%) | |
| Age | |||
| Mean age ± SD (years) | 54.47±12.05 | 50.04±12.05 | <0.001b |
| Cigarette smoking | |||
| Non-smoker (%) | 156 (62.9%) | 116 (47.9%) | <0.001a |
| Smoker (%) | 43 (17.3%) | 126 (52.1%) | |
| Missing (%) | 49 (19.8%) | ||
| Alcohol consumption | |||
| Non-drinker (%) | 160 (64.5%) | 152 (62.8%) | <0.001a |
| Drinker (%) | 26 (10.5%) | 90 (37.2%) | |
| Missing (%) | 62 (25%) |
SD: standard deviation. Pa-value was calculated by Pearson’s χ2 test, and Pb–value was calculated by Welch’s t test.
Genotype model analysis
Table 2 summarized the basic information and miner allelic frequency of tested SNPs among individuals between the cases and controls. All 12 SNPs were in Hardy-Weinberg equilibrium (HWE) in control subjects (P> 0.05). We compared the difference in frequency distributions of alleles by Pearson’s χ2 test and found that minor allele “C” of rs3751862 in MPHOSPH6 was more prevalent in case than control (OR=1.99, 95%CI=1.04-3.83, P=0.036). However, no significant association was found between other SNPs and the risk of HCC in chronic HBV carriers.
Table 2. Genotype and allele frequencies of candidate SNP loci in cases and controls.
| SNP rs# | Position | Band | Gene(s) | Role | Alleles A/B | HWE-Pa | Minor Allele Frequency | OR(95%CI) | Pb | |
|---|---|---|---|---|---|---|---|---|---|---|
| Case | Control | |||||||||
| rs6713088 | 54345469 | 2p16.2 | ACYP2 | Intron | G/C | 0.6227 | 0.442 | 0.414 | 1.12 (0.87-1.44) | 0.376 |
| rs12621038 | 54391113 | 2p16.2 | ACYP2 | Intron | T/C | 0.4149 | 0.482 | 0.423 | 1.27 (0.98-1.63) | 0.067 |
| rs1682111 | 54427979 | 2p16.2 | ACYP2 | Intron | A/T | 0.6043 | 0.297 | 0.348 | 0.79 (0.6-1.04) | 0.088 |
| rs843752 | 54446587 | 2p16.2 | ACYP2 | Intron | G/T | 0.8774 | 0.267 | 0.267 | 1 (0.75-1.33) | 0.992 |
| rs10439478 | 54459450 | 2p16.2 | ACYP2 | Intron | C/A | 0.2374 | 0.433 | 0.383 | 1.23 (0.95-1.59) | 0.111 |
| rs17045754 | 54496757 | 2p16.2 | ACYP2 | Intron | C/G | 0.5465 | 0.202 | 0.159 | 1.33 (0.96-1.85) | 0.084 |
| rs843720 | 54510660 | 2p16.2 | ACYP2 | Intron | G/T | 0.4511 | 0.316 | 0.355 | 0.84 (0.64-1.1) | 0.199 |
| rs1056675 | 82181934 | 16q23.3 | MPHOSPH6 | 3’ UTR | C/T | 0.8104 | 0.42 | 0.424 | 0.99 (0.76-1.27) | 0.909 |
| rs1056654 | 82182011 | 16q23.3 | MPHOSPH6 | 3’ UTR | A/G | 0.5845 | 0.278 | 0.299 | 0.9 (0.69-1.19) | 0.479 |
| rs3751862 | 82182229 | 16q23.3 | MPHOSPH6 | 3’ UTR | C/A | 0.4074 | 0.056 | 0.029 | 1.99 (1.04-3.83) | 0.036* |
| rs11859599 | 82182832 | 16q23.3 | MPHOSPH6 | Intron (boundary) | C/G | 0.0899 | 0.241 | 0.244 | 0.98 (0.73-1.32) | 0.914 |
| rs2967361 | 82203503 | 16q23.3 | MPHOSPH6 | Intron | T/G | 0.07924 | 0.256 | 0.211 | 1.29 (0.96-1.74) | 0.094 |
SNPs: Single nucleotide polymorphisms; A: Minor alleles, B: Major alleles; HWE: Hardy-Weinberg equilibrium; OR: Odds ratio. CI: Confidence interval.
Pa-values were calculated using exact test; Pb-values were calculated using Chi-square test.
*: P value < 0.05 indicates statistical significance.
We hypothesized that harboring the minor allele of each SNP was regarded as a risk factor compared with the wild type allele. Comparison of the SNP genotypes and the risk of HCC were assessed by logistic regression test adjusted for gender, age, cigarette smoking and alcohol consumption in Table 3 and Table 4. Four genetic models (genotype, dominant, recessive and additive model) were applied to analyze the correlation. In Table 3, we found that the minor allele “T” of rs12621038 in ACYP2 was significantly associated increasing the risk of HCC, based on the genotype model “C/T” in chronic HBV carriers increasing a 2.14-flod risk for inducing HCC compared to the “C/C” genotype (95%CI=1.27-3.62, P=0.004). And compared with genotype “A/A”, the genotype “A/C” of rs3751862 in MPHOSPH6 also significantly associated increasing 2.57-flod the risk of HBV-related HCC (95%CI=1.13-5.83, P=0.024). Additionally, from the result of Table 4, rs12621038 was found increasing the risk of HCC in chronic HBV carriers under dominant model (OR=2.05, 95%CI=1.25-3.56, P=0.004), and additive model (OR=1.41, 95%CI=1.03-1.93, P=0.032). As for rs3751862, under dominant model, was found correlating with a 2.39-fold higher risk of HCC at the 5% level (95%CI=1.07-5.31, P=0.033). However, SNPs except rs12621038 and rs3751862 were not been found any significant result in the genotypic model.
Table 3. Association between polymorphism of candidates SNPs and the HBV-related HCC risk under genotype model.
| SNP | Allele A/B | Genotype | Genotype Frequency | Logistic regression | |||
|---|---|---|---|---|---|---|---|
| Case | Control | OR | 95%CI | P | |||
| rs6713088 | G/C | C/C | 29% | 34.6% | 1 | - | - |
| C/G | 53.6% | 48.1% | 1.6 | 0.98-2.63 | 0.062 | ||
| G/G | 17.3% | 17.3% | 0.92 | 0.47-1.79 | 0.798 | ||
| rs12621038 | T/C | C/C | 25.6% | 36.5% | 1 | - | - |
| C/T | 52.4% | 42.3% | 2.14 | 1.27-3.62 | 0.004* | ||
| T/T | 22% | 21.2% | 1.85 | 0.98-3.5 | 0.058 | ||
| rs1682111 | A/T | T/T | 50.8% | 44.4% | 1 | - | - |
| T/A | 39% | 41.6% | 0.85 | 0.53-1.36 | 0.498 | ||
| A/A | 10.2% | 14% | 0.54 | 0.27-1.09 | 0.086 | ||
| rs843752 | G/T | T/T | 53% | 54.3% | 1 | - | - |
| T/G | 40.5% | 37.9% | 1.27 | 0.8-2.02 | 0.308 | ||
| G/G | 6.5% | 7.8% | 0.59 | 0.24-1.5 | 0.268 | ||
| rs10439478 | C/A | A/A | 32% | 37.7% | 1 | - | - |
| A/C | 49.4% | 48% | 1.21 | 0.75-1.98 | 0.436 | ||
| C/A | 18.6% | 14.3% | 1.85 | 0.95-3.62 | 0.071 | ||
| rs17045754 | C/G | G/G | 63.7% | 71.1% | 1 | - | - |
| G/C | 32.3% | 26% | 1.18 | 0.73-1.92 | 0.501 | ||
| C/C | 4% | 2.9% | 1.43 | 0.4-5.16 | 0.584 | ||
| rs843720 | G/T | T/T | 45.7% | 43.4% | 1 | - | - |
| T/G | 45.3% | 42.2% | 0.94 | 0.59-1.51 | 0.813 | ||
| G/G | 8.9% | 14.3% | 0.8 | 0.38-1.69 | 0.563 | ||
| rs1056675 | C/T | T/T | 33.9% | 32.1% | 1 | - | - |
| T/C | 48.2% | 51.1% | 0.99 | 0.59-1.65 | 0.97 | ||
| C/C | 18% | 16.9% | 1.24 | 0.64-2.4 | 0.533 | ||
| rs1056654 | A/G | G/G | 52.8% | 48.1% | 1 | - | - |
| G/A | 38.7% | 44% | 0.63 | 0.4-1.01 | 0.055 | ||
| A/A | 8.5% | 7.9% | 0.92 | 0.39-2.15 | 0.842 | ||
| rs3751862 | C/A | A/A | 88.7% | 94.6% | 1 | - | - |
| A/C | 11.3% | 5% | 2.57 | 1.13-5.83 | 0.024* | ||
| C/C | 0 | 0.4% | - | - | - | ||
| rs11859599 | C/G | G/G | 59.9% | 57% | 1 | - | - |
| G/C | 32% | 37.3% | 0.83 | 0.52-1.33 | 0.436 | ||
| C/C | 8.1% | 5.7% | 1.26 | 0.48-3.29 | 0.643 | ||
| rs2967361 | T/G | G/G | 55.2% | 62.4% | 1 | - | - |
| G/T | 38.3% | 33.1% | 1.26 | 0.79-2 | 0.336 | ||
| T/T | 6.5% | 4.5% | 1.06 | 0.36-3.12 | 0.923 | ||
SNPs: Single nucleotide polymorphisms; A: Minor alleles, B: Major alleles; OR: Odds ratio. CI: Confidence interval.
P–value was calculated by unconditional logistic regression adjusted for gender, age, cigarette, smoking and alcohol consumption.
*P value < 0.05 indicates statistical significance.
Table 4. Association of SNPs polymorphisms with the HBV-related HCC risk under dominant, recessive and additive model.
| SNP | Dominant model | Recessive model | Additive model | ||||||
|---|---|---|---|---|---|---|---|---|---|
| OR | 95%CI | P | OR | 95%CI | P | OR | 95%CI | P | |
| rs6713088 | 1.39 | 0.87-2.23 | 0.165 | 0.69 | 0.38-1.27 | 0.236 | 1.05 | 0.77-1.45 | 0.75 |
| rs12621038 | 2.05 | 1.25-3.36 | 0.004* | 1.16 | 0.67-1.99 | 0.6 | 1.41 | 1.03-1.93 | 0.032* |
| rs1682111 | 0.76 | 0.49-1.19 | 0.231 | 0.58 | 0.3-1.14 | 0.113 | 0.77 | 0.56-1.06 | 0.103 |
| rs843752 | 1.13 | 0.73-1.76 | 0.578 | 0.54 | 0.22-1.33 | 0.18 | 0.98 | 0.69-1.39 | 0.91 |
| rs10439478 | 1.35 | 0.85-2.13 | 0.208 | 1.66 | 0.9-3.03 | 0.102 | 1.33 | 0.96-1.84 | 0.082 |
| rs17045754 | 1.2 | 0.75-1.92 | 0.44 | 1.36 | 0.38-4.87 | 0.636 | 1.19 | 0.79-1.78 | 0.411 |
| rs843720 | 0.91 | 0.58-1.43 | 0.692 | 0.82 | 0.4-1.68 | 0.595 | 0.91 | 0.65-1.27 | 0.586 |
| rs1056675 | 1.05 | 0.64-1.71 | 0.848 | 1.24 | 0.7-2.22 | 0.462 | 1.1 | 0.79-1.52 | 0.587 |
| rs1056654 | 0.67 | 0.43-1.05 | 0.08 | 1.12 | 0.49-2.56 | 0.786 | 0.8 | 0.56-1.13 | 0.204 |
| rs3751862 | 2.39 | 1.07-5.31 | 0.033* | 0 | - | - | 2.1 | 0.99-4.45 | 0.054 |
| rs11859599 | 0.88 | 0.56-1.38 | 0.577 | 1.34 | 0.52-3.47 | 0.544 | 0.96 | 0.67-1.38 | 0.824 |
| rs2967361 | 1.23 | 0.79-1.93 | 0.361 | 0.97 | 0.33-2.83 | 0.956 | 1.16 | 0.79-1.69 | 0.451 |
ORs: odds ratios; CI: Confidence Interval.
P-value was calculated by unconditional logistic regression adjusted for gender, age, smoking and drinking.
*P value < 0.05 indicates statistical significance.
Haplotype analysis
Finally, we used the allele frequency data from all the subjects to do an LD analysis. Only one block containing three SNPs (rs1056675, rs1056654 and rs11859599) in MPHOSPH6 was detected with D’=0.95 (Figure 1). The associations between the MPHOSPH6 haplotypes and the risk of HCC in chronic HBV carriers were listed in Table 5. We found that the “T-G-G” haplotype was significantly associated with the risk of HCC by Pearson’ χ2 test (P=0.019). Furthermore, it was remained significantly augmenting the risk after unconditional logistic regression analysis adjusted for gender, age, cigarette smoking and alcohol consumption (OR=2.21, 95%CI=1.03-4.77, P=0.043). No association could be found between any other haplotypes from the block and the risk of HBV-related HCC.
Figure 1. Haplotype block map for part of the SNPs in MPHOSPH6 gene.
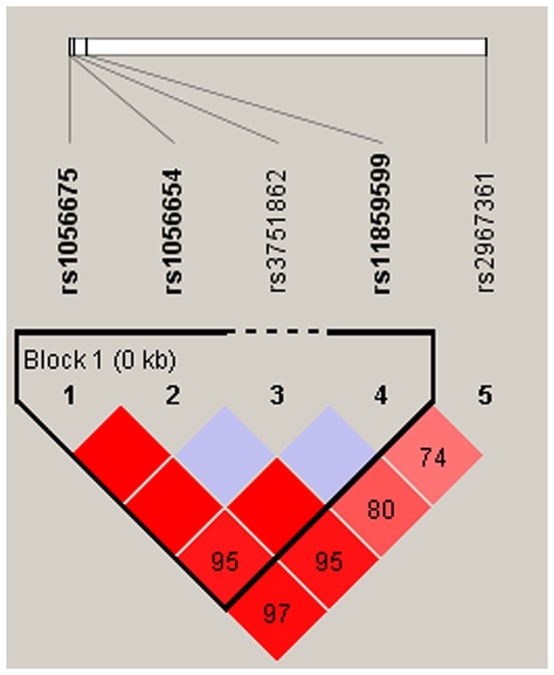
Linkage disequilibrium plots containing five SNPs from 16q23.3. Standard color frame is used to show LD pattern. Three SNPs rs1056675, rs1056654 and rs11859599 from the map are indicated a higher level of LD, and D’ value is 0.95.
Table 5. The haplotypes of three SNPs (rs1056675, rs1056654 and rs11859599) in MPHOSPH6 and the HBV-related HCC risk.
| Haplotype | Freq (control) | Freq (case) | Chi-square | Pa | OR | 95%CI | Pb |
|---|---|---|---|---|---|---|---|
| T-G-C | 0.245 | 0.241 | 0.021 | 0.885 | 0.95 | 0.66-1.37 | 0.784 |
| T-A-G | 0.298 | 0.279 | 0.431 | 0.512 | 0.8 | 0.57-1.15 | 0.228 |
| C-G-G | 0.43 | 0.423 | 0.049 | 0.826 | 1.08 | 0.78-1.49 | 0.646 |
| T-G-G | 0.027 | 0.057 | 5.475 | 0.019* | 2.21 | 1.03-4.77 | 0.043* |
Pa-value was calculated from two-sided Chi-squared test. Pb-value was calculated by unconditional logistic regression adjusted for gender, age, cigarette smoking and alcohol consumption.
*P value <0.05 indicates statistical significance.
DISCUSSION AND CONCLUSION
In our study, we investigated the associations between 12 SNPs of ACYP2 and MPHOSPH6 and the risk of HCC in chronic HBV carriers in Chinese Han population. We determined the minor allele “C” of rs3751862 in MPHOSPH6 was associated with an increased risk of HBV-related HCC under allelic, genotype and dominant model. Moreover, we determined that the minor allele (T) of rs12621038 in ACYP2 was associated with an increased risk of HBV-related HCC according to the genotypic model analysis, containing genotype, dominant, and additive model. In addition, we demonstrated that “A-G-G” haplotype in MPHOSPH6 was associated with an increased risk of HCC surpass 2-fold in chronic HBV carriers.
So far as we know rs3751862 is located in the 3’ UTR of MPHOSPH6, however, little is known about the association between rs3751862 and the risk of diseases. MPHOSPH6, which localizes in the nucleus during interphase, was firstly identified by the characteristic of its phosphorylation during mitosis, and then found to be a M phase-related gene in mitotic cell cycle [20]. Previous studies have demonstrated that MPHOSPH6 played a role in on the maturation of 5.8S rRNA as a nucleolus specific exosome factor [21]. Furthermore, the expression of MPHOSPH6 had a significantly difference between oral squamous cell carcinoma samples and their corresponding surgical margins [22]. In our study, we found that rs3751862 was a risk variant for HCC in chronic HBV patients, and the haplotype “T-G-G” (rs1056675, rs1056654 and rs11859599 block) also be a harmful factor for the risk of chronic HBV related HCC. It might a role in a role in hypothesized that the mutation of this locus might alter the effect of microRNA on the regulation of the MPHOSPH6, resulting in abnormal cell division, and the mechanistic details should be identified in future studies.
The SNP rs12621038 locates in the intron of ACYP2. Previous studies have identified that genetic variants in ACYP2 could be a risk factor for the etiology of many diseases. Recently, some, studies found SNPs in ACYP2 were associated with many cancers, for example rs12621038, rs1682111 and rs17045754 could significantly decreased the risk of breast cancer [23], and rs843720 was associated with increased the lung cancer risk [24]. Furthermore, polymorphism of rs17045754 was related to increased risk of developing ischemic stroke [25]. Additionally, an association study revealed that polymorphism of rs6713088 was associated with an increased risk of liver cancer [17]. However, there is lack of association between polymorphisms of ACYP2 and the susceptibility of HCC in chronic HBV carriers. We found rs12621038 might be a harmful factor significantly increased the development of HCC after HBV infection. Acylposphatase, encoded by ACYP2, can hydrolyze the phosphoenzyme intermediate of different membrane pumps, particularly the Ca2+/Mg2+-ATPase from sarcoplasmic reticulum of skeletal muscle [26]. Although the association mechanism is unclear, and future prospective multicenter study should be validated.
We acknowledged that there were several limitations in this study. On one hand, we cannot obtain the accurate years that the patients had been infected with HBV, furthermore we also could not precisely determine the time when chronic HBV carriers turned out to be the HCC patients. On the other hand, we didn’t have a relatively larger sample size, and alcohol consumption and cigarette smoking status of many patients in case group was absent. Thus, the associations between these confounding factors and the risk of HCC in chronic HBV carriers were not analyzed. We will evaluate these associations in the future.
In conclusion, our case control study explored the variants of ACYP2 and MPHOSPH6 with HCC susceptibility in chronic HBV carriers, and our results suggested that MPHOSPH6 and ACYP2 as a plausible candidate genes predicted the risk of HCC after chronic HBV infection in Chinese Han population. The findings need further confirmed in a larger cohort of HBV-induced HCC patients of other races. In addition, there is an urgent need to reveal the mechanism underlying the associations between MPHOSPH6 and ACYP2 and the risk of HCC induced by chronic HBV infection.
MATERIALS AND METHODS
Subject recruitment and ethics committee statement
This study was performed using two independent case-control populations. A total of 490 participants from the Haikou People’s Hospital were consecutively recruited between July 2014 and March 2016, among them 248 individuals were chronic HBV patients with HCC as the case group, and the remaining 242 persons were chronic HBV patients without HCC as the control group. All cases and controls selected for this study were confirmed by being positive for HBV surface antigen, HBV core antibody, hepatitis B e-antigen or hepatitis B e-antibody at least 6 months. Additional, that individuals contained in study were negative for hepatitis C surface antigen, human immunodeficiency virus. The HCC cases were diagnosed based on pathological identification combined with at least one positive liver image on computed tomography, magnetic resonance imaging, or ultrasonography, occasionally combined with increased serum AFP levels (>400ng/mL) [27, 28]. The controls were examined without any cancer.
Informed written consent was given by all participants, and some information of participates also collected, including age, gender, smoking and drinking status. This study was approved by the ethics committee of the Central South University Xiangya School of Medicine and the ethics committee of Haikou People’s Hospital. All clinical assessment and specimen collections were conducted according to Declaration of Helsinki principles.
SNP selection and genotyping
Peripheral whole blood was collected from each subject and placed into anticoagulative tubes at -80°C. According to the Gold Mag-Mini extraction method (GodMag Co. Ltd, Xi’an, China) [29], genomic DNA extracted from whole blood. DNA concentration and purity were measured by spectrometry (NanoDrop 2000, Thermo Fisher Scientific, Waltham, Massachusetts, USA), and genomic DNA concentration and purity of all samples met the experimental requirements. Single base extensive primers were designed by Sequenom MassARRAY Assay Design 3.0 Software (San Diego, California, USA). Genotyping was performed using a Sequenom MassARRAY RS1000 (Sequenom, Inc., San Diego, CA, USA) according to the manufacturer’s instructions [30]. Sequenom Typer 4.0 software was used to performed genotyping data analysis and management [31].
In this study, seven SNPs in the ACYP2 gene were selected from the publication that associated polymorphisms with liver cancer in Chinese Han population [17], including s6713088, rs12621038, rs1682111, rs843752, rs10439478, rs17045754 and rs843720. And five SNPs rs1056675, rs1056654, rs371862, rs11859599 and rs2967361 in MPHOSPH6 were also selected according to the previous association study [18]. The SNPs were selected based on the minor allele frequencies of more than 5% in the HapMap Chinese Han population.
Statistical analysis
Statistical analyses were performed using SPSS version 17.0 (SPSS, Chicago, IL, USA). All statistical tests were two sides, and P<0.05 indicated a significant difference. Pearson’s χ2 test was used to examine the statistical differences of categorical variables, containing gender, smoking status and drinking status; and Welch’s test was used to detect the statistical difference of continuous variable, such as age. The control group needed to detect whether the Hardy-Weinberg Equilibrium (HWE) met, and exact test was used to determine the SNPs departed from the HWE. Afterwards, the association between minor allele of each SNPs and the risk of HCC in chronic HBV carriers were evaluated by Pearson’s χ2 test, and the genotype model also constructed to assess the association. Finally, SHEsis software platform [32] and Haploview software package (version 4.2) (Broad Institute, Cambridge, MA, USA) [33] were used to construct the linkage disequilibrium (LD) block, and analyse the association between haplotypes and the risk of HCC. Unconditional logistic regression analysis adjusted for gender, age, smoking and drinking was used to calculate the Odds ratios (OR) and 95% confidence intervals (95%CI) for each variant.
ACKNOWLEDGMENTS AND FUNDING
This research was supported by National Natural Science Foundation of China grants (81460450) and Natural Science Foundation of Hainan Province grants (817379 and 20168312). We thank all the individuals for their participation.
Abbreviations
- HCC
Hepatocellular carcinoma
- HBV
Hepatitis B virus
- SNP
Single nucleotide polymorphism
- OR
Odds ratio
- CI
Confidence interval
- LD
Linkage disequilibrium
- HWE
Hardy-Weinberg Equilibrium
Author contributions
Yijun Yang and Shufang Zhang not only conceived and designed the experiments, but also contributed reagents/materials/analysis tools.
Yingai Zhang wrote the manuscript.
Shunlan Wang and Xiaohong Wen performed the experiments.
CONFLICTS OF INTEREST
The authors have declared that they have no conflicts of interest.
REFERENCES
- 1.Siegel RL, Miller KD, Jemal A. Cancer Statistics, 2017. CA Cancer J Clin. 2017;67:7–30. doi: 10.3322/caac.21387. https://doi.org/10.3322/caac.21387. [DOI] [PubMed] [Google Scholar]
- 2.Chen W, Zheng R, Baade PD, Zhang S, Zeng H, Bray F, Jemal A, Yu XQ, He J. Cancer statistics in China, 2015. CA Cancer J Clin. 2016;66:115–132. doi: 10.3322/caac.21338. https://doi.org/10.3322/caac.21338. [DOI] [PubMed] [Google Scholar]
- 3.Elserag HB, Rudolph KL. Hepatocellular carcinoma: epidemiology and molecular carcinogenesis. Gastroenterology. 2007;132:2557–2576. doi: 10.1053/j.gastro.2007.04.061. https://doi.org/10.1053/j.gastro.2007.04.061. [DOI] [PubMed] [Google Scholar]
- 4.Altekruse SF, Henley SJ, Cucinelli JE, Mcglynn KA. Changing Hepatocellular Carcinoma Incidence and Liver Cancer Mortality Rates in the United States. Am J Gastroenterol. 2014;109:542–553. doi: 10.1038/ajg.2014.11. https://doi.org/10.1038/ajg.2014.11. [DOI] [PMC free article] [PubMed] [Google Scholar]
- 5.Sherman M. Hepatocellular carcinoma: epidemiology, surveillance, and diagnosis. Semin Liver Dis. 2010;30:3–16. doi: 10.1055/s-0030-1247128. https://doi.org/10.1055/s-0030-1247128. [DOI] [PubMed] [Google Scholar]
- 6.De Martel C, Maucort-Boulch D, Plummer M, Franceschi S. World-wide relative contribution of hepatitis B and C viruses in hepatocellular carcinoma. Hepatology. 2015;62:1190–200. doi: 10.1002/hep.27969. https://doi.org/10.1002/hep.27969. [DOI] [PMC free article] [PubMed] [Google Scholar]
- 7.Chang MH. Prevention of hepatitis B virus infection and liver cancer. Recent Results Cancer Res. 2014;193:75–95. doi: 10.1007/978-3-642-38965-8_5. https://doi.org/10.1007/978-3-642-38965-8_5. [DOI] [PubMed] [Google Scholar]
- 8.Zhang Q, Cao GW. Genotypes, mutations, and viral load of hepatitis B virus and the risk of hepatocellular carcinoma. Hepat Mon. 2011;11:86–91. [PMC free article] [PubMed] [Google Scholar]
- 9.Li W, Goto K, Matsubara Y, Ito S, Muroyama R, Li Q, Kato N. The characteristic changes in hepatitis B virus x region for hepatocellular carcinoma: a comprehensive analysis based on global data. PLoS One. 2015;10:e0125555. doi: 10.1371/journal.pone.0125555. https://doi.org/10.1371/journal.pone.0125555. [DOI] [PMC free article] [PubMed] [Google Scholar]
- 10.Xiao Q, Fu B, Chen P, Liu ZZ, Wang W, Ye Q. Three polymorphisms of tumor necrosis factor-alpha and hepatitis B virus related hepatocellular carcinoma: A meta-analysis. Medicine (Baltimore) 2016;95:e5609. doi: 10.1097/MD.0000000000005609. https://doi.org/10.1097/md.0000000000005609. [DOI] [PMC free article] [PubMed] [Google Scholar]
- 11.Kumar V, Yi Lo PH, Sawai H, Kato N, Takahashi A, Deng Z, Urabe Y, Mbarek H, Tokunaga K, Tanaka Y, Sugiyama M, Mizokami M, Muroyama R, et al. Soluble MICA and a MICA variation as possible prognostic biomarkers for HBV-induced hepatocellular carcinoma. PLoS One. 2012;7:e44743. doi: 10.1371/journal.pone.0044743. https://doi.org/10.1371/journal.pone.0044743. [DOI] [PMC free article] [PubMed] [Google Scholar]
- 12.Zhang H, Zhai Y, Hu Z, Wu C, Qian J, Jia W, Ma F, Huang W, Yu L, Yue W, Wang Z, Li P, Zhang Y, et al. Genome-wide association study identifies 1p36.22 as a new susceptibility locus for hepatocellular carcinoma in chronic hepatitis B virus carriers. Nat Genet. 2010;42:755–758. doi: 10.1038/ng.638. https://doi.org/10.1038/ng.638. [DOI] [PubMed] [Google Scholar]
- 13.Ko E, Jung G. Positive association of long telomeres with the invasive capacity of hepatocellular carcinoma cells. Biochem Biophys Res Commun. 2014;447:358–363. doi: 10.1016/j.bbrc.2014.04.022. https://doi.org/10.1016/j.bbrc.2014.04.022. [DOI] [PubMed] [Google Scholar]
- 14.Kojima H, Yokosuka O, Imazeki F, Saisho H, Omata M. Telomerase activity and telomere length in hepatocellular carcinoma and chronic liver disease. Gastroenterology. 1997;112:493–500. doi: 10.1053/gast.1997.v112.pm9024303. [DOI] [PubMed] [Google Scholar]
- 15.Fu X, Wan S, Hann HW, Myers RE, Hann RS, Au J, Chen B, Xing J, Yang H. Relative telomere length: a novel non-invasive biomarker for the risk of non-cirrhotic hepatocellular carcinoma in patients with chronic hepatitis B infection. Eur J Cancer. 2012;48:1014–22. doi: 10.1016/j.ejca.2012.02.066. https://doi.org/10.1016/j.ejca.2012.02.066. [DOI] [PMC free article] [PubMed] [Google Scholar]
- 16.Codd V, Nelson CP, Albrecht E, Mangino M, Deelen J, Buxton JL, Hottenga JJ, Fischer K, Esko T, Surakka I, Broer L, Nyholt DR, Mateo Leach I, et al. Identification of seven loci affecting mean telomere length and their association with disease. Nat Genet. 2013;45:422–27. doi: 10.1038/ng.2528. https://doi.org/10.1038/ng.2528. [DOI] [PMC free article] [PubMed] [Google Scholar]
- 17.Chen Z, Sun Y, Xu Z, Xu J, Li J, Yan M, Li J, Jin T, Lin H. ACYP2 polymorphisms are associated with the risk of liver cancer in a Han Chinese population. Oncotarget. 2017;8:67723–31. doi: 10.18632/oncotarget.18574. https://doi.org/10.18632/oncotarget.18574. [DOI] [PMC free article] [PubMed] [Google Scholar]
- 18.Li G, Li Y, Bai W, Jiang D, Duan X, Jia W, Wang H, Hao Y, Yang Z. MPHOSPH6, ZNF208 and RTEL1 polymorphisms in Chinese Han patients with colorectal cancer. Int J Clin Exp Pathol. 2016;9:12967–12981. [Google Scholar]
- 19.Zhou J, Qiu L, Jiang S, Zhou F, Huang J, Yang L, Su T, Zhang D. Molecular cloning and mRNA expression of M-phase phosphoprotein 6 gene in black tiger shrimp (Penaeus monodon) Mol Biol Rep. 2013;40:1301–6. doi: 10.1007/s11033-012-2173-z. https://doi.org/10.1007/s11033-012-2173-z. [DOI] [PubMed] [Google Scholar]
- 20.Matsumoto-Taniura N, Pirollet F, Monroe R, Gerace L, Westendorf JM. Identification of novel M phase phosphoproteins by expression cloning. Mol Biol Cell. 1996;7:1455–1469. doi: 10.1091/mbc.7.9.1455. [DOI] [PMC free article] [PubMed] [Google Scholar]
- 21.Schilders G, Raijmakers R, Raats JM, Pruijn GJ. MPP6 is an exosome-associated RNA-binding protein involved in 5.8S rRNA maturation. Nucleic Acids Res. 2005;33:6795–6804. doi: 10.1093/nar/gki982. https://doi.org/10.1093/nar/gki982. [DOI] [PMC free article] [PubMed] [Google Scholar]
- 22.Severino P, Alvares AM, Michaluart P, Jr, Okamoto OK, Nunes FD, Moreira-Filho CA, Tajara EH, Head and Neck Genome Project GENCAPO Global gene expression profiling of oral cavity cancers suggests molecular heterogeneity within anatomic subsites. BMC Res Notes. 2008;1:113–121. doi: 10.1186/1756-0500-1-113. https://doi.org/10.1186/1756-0500-1-113. [DOI] [PMC free article] [PubMed] [Google Scholar]
- 23.Zhang F, Zhang Y, Deng Z, Xu P, Zhang X, Jin T, Liu Q. Genetic variants in the acylphosphatase 2 gene and the risk of breast cancer in a Han Chinese population. Oncotarget. 2016;7:86704–12. doi: 10.18632/oncotarget.13495. https://doi.org/10.18632/oncotarget.13495. [DOI] [PMC free article] [PubMed] [Google Scholar]
- 24.Chen N, Yang X, Guo W, You J, Wu Q, Zhang G, Li H, Geng D, Jin T, Fu J, Zhang Y. Association of polymorphisms in the telomere-related gene ACYP2 with lung cancer risk in the Chinese Han population. Oncotarget. 2016;7:87473–78. doi: 10.18632/oncotarget.13870. https://doi.org/10.18632/oncotarget.13870. [DOI] [PMC free article] [PubMed] [Google Scholar]
- 25.Liang Y, Zhang R, Zhang S, Ji G, Shi P, Yang T, Liu F, Feng J, Li C, Guo D, Chen M. Association of ACYP2 and TSPYL6 Genetic Polymorphisms with Risk of Ischemic Stroke in Han Chinese Population. Mol Neurobiol. 2017;54:5988–95. doi: 10.1007/s12035-016-0086-x. https://doi.org/10.1007/s12035-016-0086-x. [DOI] [PubMed] [Google Scholar]
- 26.Degl’Innocenti D, Marzocchini R, Rosati F, Cellini E, Raugei G, Ramponi G. Acylphosphatase expression during macrophage differentiation and activation of U-937 cell line. Biochimie. 1999;81:1031–5. doi: 10.1016/s0300-9084(99)00333-8. [DOI] [PubMed] [Google Scholar]
- 27.Zhang X, Zhai L, Rong C, Qin X, Li S. Association of Ghrelin Gene Polymorphisms and Serum Ghrelin Levels with the Risk of Hepatitis B Virus-Related Liver Diseases in a Chinese Population. PLoS One. 2015;10:e0143069. doi: 10.1371/journal.pone.0143069. https://doi.org/10.1371/journal.pone.0143069. [DOI] [PMC free article] [PubMed] [Google Scholar]
- 28.Lao X, Wang X, Liu Y, Lu Y, Yang D, Liu M, Zhang X, Rong C, Qin X, Li S. Association of Paraoxonase 1 Gene Polymorphisms With the Risk of Hepatitis B Virus-related Liver Diseases in a Guangxi Population: A Case-control Study. Medicine (Baltimore) 2015;94:e2179. doi: 10.1097/MD.0000000000002179. https://doi.org/10.1097/MD.0000000000002179. [DOI] [PMC free article] [PubMed] [Google Scholar]
- 29.Köchl S, Niederstätter H, Parson W. DNA Extraction and Quantitation of Forensic Samples Using the Phenol-Chloroform Method and Real-Time PCR. Methods Mol Biol. 2005;297:13–29. doi: 10.1385/1-59259-867-6:013. https://doi.org/10.1385/1-59259-867-6:013. [DOI] [PubMed] [Google Scholar]
- 30.Trembizki E, Smith H, Lahra MM, Chen M, Donovan B, Fairley CK, Guy R, Kaldor J, Regan D, Ward J, Nissen MD, Sloots TP, Whiley DM. High-throughput informative single nucleotide polymorphism-based typing of Neisseria gonorrhoeae using the Sequenom MassARRAY iPLEX platform. J Antimicrob Chemother. 2014;69:1526–1532. doi: 10.1093/jac/dkt544. https://doi.org/10.1093/jac/dkt544. [DOI] [PubMed] [Google Scholar]
- 31.Thomas RK, Baker AC, Debiasi RM, Winckler W, Laframboise T, Lin WM, Wang M, Feng W, Zander T, Macconaill L, Lee JC, Nicoletti R, Hatton C, et al. High-throughput oncogene mutation profiling in human cancer. Nat Genet. 2007;39:347–351. doi: 10.1038/ng1975. https://doi.org/10.1038/ng1975. [DOI] [PubMed] [Google Scholar]
- 32.Li Z, Zhang Z, He Z, Tang W, Li T, Zeng Z, He L, Shi Y. doi: 10.1038/cr.2009.33. A partition-ligation-combination-subdivision EM algorithm for haplotype inference with multiallelic markers: update of the SHEsis ( http://analysis.bio-x.cn). Cell Res. 2009; 19: 519–23. [DOI] [PubMed]
- 33.Barrett JC, Fry B, Maller J, Daly MJ. Haploview: analysis and visualization of LD and haplotype maps. Bioinformatics. 2005;21:263–255. doi: 10.1093/bioinformatics/bth457. https://doi.org/10.1093/bioinformatics/bth457. [DOI] [PubMed] [Google Scholar]