

ABSTRACT
In Escherichia coli, the catabolism of C4-dicarboxylates is regulated by the DcuS-DcuR two-component system. The functional state of the sensor kinase DcuS is controlled by C4-dicarboxylates (like fumarate) and complexation with the C4-dicarboxylate transporters DctA and DcuB, respectively. Free DcuS (DcuSF) is known to be constantly active even in the absence of fumarate, whereas the DcuB-DcuS and DctA-DcuS complexes require fumarate for activation. To elucidate the impact of the transporters on the functional state of DcuS and the concentrations of DcuSF and DcuB-DcuS (or DctA-DcuS), the absolute levels of DcuS, DcuB, and DctA were determined in aerobically or anaerobically grown cells by mass spectrometry. DcuS was present at a constant very low level (10 to 20 molecules DcuS/cell), whereas the levels of DcuB and DctA were higher (minimum, 200 molecules/cell) and further increased with fumarate (12.7- and 2.7-fold, respectively). Relating DcuS and DcuB contents with the functional state of DcuS allowed an estimation of the proportions of DcuS in the free (DcuSF) and the complexed (DcuB-DcuS) states. Unexpectedly, DcuSF levels were always low (<2% of total DcuS), ruling out earlier models that show DcuSF as the major species under noninducing conditions. In the absence of fumarate, when DcuSF is responsible for basal dcuB expression, up to 8% of the maximal DcuB levels are formed. These suffice for DcuB-DcuS complex formation and basal transport activity. In the presence of fumarate (>100 μM), the DcuB-DcuS complex drives the majority of dcuB expression and is thus responsible for induction.
IMPORTANCE Two-component systems (TCS) are major devices for sensing by bacteria and adaptation to environmental cues. Membrane-bound sensor kinases of TCS often use accessory proteins of unknown function. The DcuS-DcuR TCS responds to C4-dicarboxylates and requires formation of the complex of DcuS with C4-dicarboxylate transporters DctA or DcuB. Free DcuS (DcuSF) is constitutively active in autophosphorylation and was supposed to have a major role under specific conditions. Here, absolute concentrations of DcuS, DcuB, and DctA were determined under activating and nonactivating conditions by mass spectrometry. The relationship of their absolute contents to the functional state of DcuS revealed their contribution to the control of DcuS-DcuR in vivo, which was not accessible by other approaches, leading to a revision of previous models.
KEYWORDS: C4-dicarboxylate sensing, DctA, DcuB, DcuS, Escherichia coli, SRM, absolute quantification, sensor complex
INTRODUCTION
The C4-dicarboxylates as the source of energy and carbon for aerobic and anaerobic growth and play a central role in the metabolism of Escherichia coli. During aerobic growth, the C4-dicarboxylates succinate, fumarate, l-malate, and oxaloacetate are part of the citric acid cycle. This pathway, in combination with the feeding routes for acetyl coenzyme A (acetyl-CoA) production from the same substrates, allows degradation of the C4-dicarboxylates (for reviews, see references 1–3). Under anaerobic conditions, fumarate, or l-malate and l-aspartate, which can be converted to fumarate, serve as the electron acceptors for fumarate respiration (for reviews, see references 3 and 4). E. coli uses a two-component system (DcuS-DcuR) for inducing the expression of essential genes of C4-dicarboxylate metabolism in response to C4-dicarboxylates. In aerobic growth, this is mainly dctA encoding the transporter DctA for the uptake of C4-dicarboxylates (5–7). In anaerobic growth, the dcuB gene encoding the antiporter DcuB, as well as fumB and frdABCD, coding for fumarase B and fumarate reductase, respectively, represent the major targets for induction (3, 6, 8). DcuB catalyzes the exchange of the C4-dicarboxylates that serve as the substrates (fumarate, l-malate, and aspartate) against succinate, which is the product of fumarate respiration (9, 10).
The sensor kinase DcuS of the DcuS-DcuR two-component system responds to extracellular C4-dicarboxylates and induces the genes of the corresponding pathways. DcuS requires the transporter DctA or DcuB under aerobic and anaerobic conditions for sensing. The transporters form a complex with DcuS, converting DcuS to the C4-dicarboxylate-responsive state (11–14). In this state, DcuS responds to and requires the C4-dicarboxylates for activation. Free (or noncomplexed) DcuS (produced by the deletion of DctA or DcuB), on the other hand, is in the permanent “on” state and stimulates the expression of target genes even in the absence of C4-dicarboxylates via autophosphorylation and subsequent phosphorylation of the response regulator DcuR (7, 15). Therefore, DctA and DcuB fulfill dual roles by functioning as transporters and as constituents of the DctA-DcuS and DcuB-DcuS sensor complexes.
The dual role of DctA and DcuB in sensing and transport should be reflected by the cellular contents of the transporters to meet their need appropriately. Thus, it can be envisaged that under noninducing conditions (i.e., in the absence of C4-dicarboxylates), DctA and DcuB are required for formation of the DctA-DcuS and DcuB-DcuS sensor complexes, whereas under induced conditions and catabolism of C4-dicarboxylates, DctA or DcuB is additionally required for transport of the substrates. Since transport is a catabolic process, high levels of the transporters are required, whereas the sensor complexes are required at low but constant levels.
According to this model, constant levels of DcuS were expected independently from C4-dicarboxylate metabolism. Indeed, the expression of dcuS is low and rather constant (16, 17). The expression of DctA and DcuB, on the other hand, is highly regulated and adapted to catabolic needs (6–8). Thus, for DctA and DcuB, low (but not zero) levels were expected in the noninduced state to meet their role in the sensory complexes, and high levels were expected in the induced state.
To shed light onto the stoichiometry of the sensor DcuS and the regulating transporter proteins DctA and DcuB, their absolute amounts in the E. coli membranes were determined upon aerobic and anaerobic growth without and with fumarate (representative for C4-dicarboxylates), corresponding to conditions where the transporters are required only for coregulation in the sensor complexes, or for coregulation and transport. These data were related to the function of DcuS in gene expression and of DcuB in transport. In particular, the responsiveness of DcuS to activation by fumarate serves as a measure for differentiating DcuS in the free or complexed state (12, 13). The data shall show whether sufficient transporter is present in the noninduced state (absence of fumarate) for the formation of the sensory DcuB-DcuS (and DctA-DcuS) complexes, or whether there are indications for free (noncomplexed) DcuS (DcuSF).
RESULTS
Absolute contents of DcuS, DctA, and DcuB in aerobically and anaerobically grown E. coli.
For the determination of the absolute amounts of DcuS, DctA, and DcuB in E. coli, highly sensitive and selective selected reaction monitoring (SRM) mass spectrometry (MS) was used (18). DcuS could not be detected in whole-cell extracts, obviously due to its low level in the cell. Therefore, for all quantitative studies, enriched membrane fractions prepared by ultracentrifugation of the E. coli cells were used. To allow for exact quantification of DcuS, DctA, and DcuB within the membrane fraction, protein solubilization steps were carried out twice to ensure complete membrane protein extraction (19, 20). To quantify the membrane proteins using a strategy described before (21, 22), we combined SRM mass spectrometry with spiking-in of known amounts of proteotypic peptides of the target proteins. The proteotypic peptides comprise unique MS-detectable peptides of the proteins of choice, which should contain at least six amino acids, but no cysteine or methionine due to their risk of modifications (23). For DcuS, DctA, and DcuB-PhoA each, three or four different peptides met these criteria when a theoretical digest of the amino acid sequence with trypsin was performed. For DcuB, the PhoA fusion was used. DcuB-PhoA can be expressed in a stable and functional form from a plasmid, whereas DcuB often forms inclusion bodies when expressed from a plasmid. The accordingly synthesized peptides were applied as heavy labeled (13C and 15N) standard peptides (see Table S1 in the supplemental material). SRM measurements confirmed good detectability of three peptides of DcuS and DcuB-PhoA, with similar intensities per protein within the E. coli extracts. From DcuB-PhoA, one peptide was derived only from DcuB, and two peptides included parts of PhoA. The four peptides of DctA, LDDVLNNR, ALTNLVGNGVATIVVAK, ATGFSIFK, and AVAVYADQAK, each delivered very different values for the DctA amounts within the E. coli membrane samples. To exclude sample preparation as a reason for the observed differences, a different extraction protocol (22) was applied, but the large variation in the DctA levels calculated remained (data not shown). A detailed analysis of the mass spectrometry data then revealed the usage of an alternative cleavage site for the generation of the sequence LDDVLNNR. Thus, instead of the initially selected peptide LDDVLNNR, a peptide with a one-amino-acid extension, LDDVLNNRK, was observed. Furthermore, the peptide ALTNLVGNGVATIVVAK underwent deamination. Therefore, both peptides could not be used for quantification. Peptide ATGFSIFK was always detected at a very low intensity close to the detection limit, probably because of odd ionization properties. Only peptide, AVAVYADQAK, displayed the expected good detectability, and thus, the quantifications of DctA in this study rely on this peptide. All SRM data described below are provided in detail in Tables S2 to S4 in the supplemental material.
Having established the technical prerequisites, we were first interested in the amounts of DcuS, DctA, and DcuB in the E. coli W3110 wild-type strain under noninducing conditions and upon induction by fumarate (Fig. 1). During aerobic growth, 18.8 fmol per mg of DctA protein corresponding to 198 molecules per cell was measured, which is in line with the values determined by Schmidt et al. (24). For DcuS, 0.6 fmol per μg of membrane protein, and thus approximately seven molecules per E. coli cell, was detected. After induction with 50 mM fumarate, the amount of DcuS was altered only to a minor extent, whereas the DctA level increased three times (Fig. 1A and B). Under noninducing conditions, the DctA-to-DcuS ratio amounted to approximately 30, and the excess of DctA doubled upon the addition of fumarate.
FIG 1.

Absolute quantification of DctA, DcuB, and DcuS in the membrane fraction of E. coli W3110 wild type. The amounts of DctA, DcuB, and DcuS were determined after growth under control conditions (0 Fum) and after the addition of fumarate (20 Fum or 50 Fum). In all cases, average values and standard deviations from three biological replicates are presented, and the ratios of the protein amounts depending on fumarate addition were calculated.
During anaerobic growth, the contents of DcuS were twice as high as under aerobic conditions and did not change as a result of fumarate addition (Fig. 1C and D). The small amount of DcuS content under aerobic as well as anaerobic conditions was close to the detection limit of the method but was clearly detectable. Also, other sensor kinases of E. coli, such as KdpD, CpxA, and ArcB, were found previously only in small amounts (40, 41, and 85 molecules per cell, respectively) under noninducing conditions (19, 25). DcuS was also not covered in the global quantitative approach of Schmidt et al., where 2,359 E. coli proteins could be quantified, supporting the presence of only small cellular amounts under the analyzed noninducing conditions (24). In contrast, the number of DcuB molecules increased strongly (12 times) from noninduced to induced conditions (Fig. 1C and D). For a comparison of DcuB levels with transport activity, the transport by DcuB was determined in a strain producing only DcuB but not the other transporters DcuA and DcuC in order to avoid interference in transport activity (Fig. 2). The transport activity decreased from the fumarate-induced state (3.9 U/mg of protein/min) to 0.3 U/mg of protein (or 7.7%) in the noninduced state, which compares to 8% regarding the changes in the DcuB levels. The background activity of transport was very low in a strain that was deficient in DcuB as well (not shown). Overall, the transport activity by DcuB and the changes in DcuB contents correlate very closely.
FIG 2.
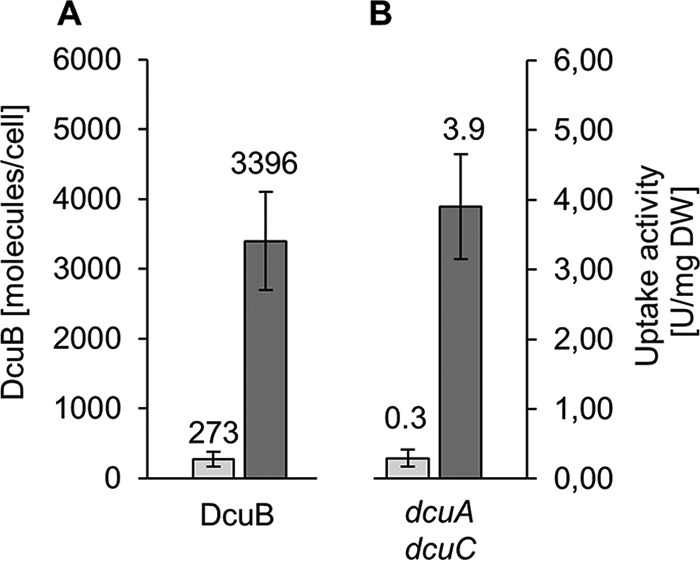
Direct comparison of changes of DcuB in contents and activity upon fumarate induction. (A) Absolute contents of DcuB in E. coli wild type grown without and with fumarate induction as given in Fig. 1. (B) Uptake of [14C]fumarate in cells of strain IMW658 of E. coli containing only DcuB (but not DcuA and DcuC) was determined by a filtration assay (37).
For adjusting other (nonphysiological) transporter levels and to vary DcuB levels and DcuB-DcuS ratios more directly, a dcuB deletion strain was grown with a plasmid containing the dctA and dcuB genes, respectively. The dcuB and dctA genes were under the control of the inducible ara promoter. The absolute amounts of the DcuS, DctA, and DcuB proteins were determined during anaerobic growth in the presence of various arabinose concentrations in order to adjust different expression levels for DctA (strain IMW503 with plasmid pMW1194) or for DcuB (strain IMW503 with plasmid pMW2334) (Fig. 3). Neither DctA nor DcuB was detected in the absence of the corresponding plasmid used for overexpression.
FIG 3.

Absolute quantification of DctA, DcuB, and DcuS in E. coli IMW503/pMW1194 or E. coli IMW503/pMW2334 grown anaerobically. The amounts were determined under four different conditions by cultivation in the additional presence of 100 μM glucose (100Glc), 0 μM arabinose (0Ara), 1 μM arabinose (1Ara), and 10 μM arabinose (10Ara). Absolute amounts of DctA and DcuS (A and B) or DcuB and DcuS (C and D) were measured in the membrane fraction of E. coli IMW503/pMW1194 or E. coli IMW503/pMW2334, respectively. Average values and standard deviations from five (A and B) or from three or four (C and D) biological replicates are presented.
The concentration of DctA increased from 65.2 fmol per μg to 97.1 fmol per μg of protein with rising arabinose concentrations (Fig. 3A). Applying catabolite repression by the addition of glucose resulted in decreased expression but did not repress the levels of DctA substantially (Fig. 3A). Generally, the DctA levels showed smaller differences between the induced and repressed states (maximum twofold) than expected according to former results obtained by Western blotting (12). Even under noninducing conditions, the DctA levels produced from the plasmid-encoded DctA were in the same range as in the wild type under induced conditions (Fig. 1A), pointing to a difference between the expression of genome and plasmid-carried dctA.
The amounts of DcuB produced from plasmid (Fig. 3B) were smaller than those of DctA and exceeded the contents of DcuB in the noninduced wild type only slightly when the plasmid-carried dcuB was not or only slightly induced (0 and 1 μM arabinose). Repression by glucose caused no further decrease of the DcuB contents. With stronger induction (10 μM arabinose), a significant increase (2.5-fold) was observed. These results are in line with data reported earlier (13).
Notably, DcuS contents did not alter significantly under all conditions (Fig. 3A to D), despite large variations in the DctA and DcuB contents and in the growth conditions. This is in agreement with studies on the transcriptional regulation of dcuS, which showed low glucose repression by an internal promoter but no regulation by DcuS and C4-dicarboxylates (17).
The calculated number of molecules per cell mostly correlated to the concentration per microgram of protein (Fig. 3C and D), but slight differences were seen, especially for DctA, because the number of cells per milliliter is also affected by the carbon source and the concentration used for growth (Table S5).
DcuB is required for the response of DcuS to fumarate.
DcuS requires one of the C4-dicarboxylate transporters DctA or DcuB for normal function. The transporters form a complex with DcuS, and only the DctA-DcuS and DcuB-DcuS complexes gain responsiveness to the C4-dicarboxylates, whereas free DcuS (DcuSF) is in the permanent “on” state, where signaling occurs independent of C4-dicarboxylates (7, 11–13, 15). A model was put forward that suggests two modes of regulation by DcuS (14). First, in the DctA-DcuS and DcuB-DcuS complexes, the autophosphorylation of DcuS is regulated by binding of C4-dicarboxylates: the activity of DcuS depends on the concentration of the C4-dicarboxylates (13, 26) in a mode typical of sensor kinases that are controlled by low-Mr effectors (mode I regulation according to the model in reference 14). The situation in the absence of C4-dicarboxylates (mode II regulation) was less clear. It was argued that under such conditions, DcuSF has a major role by turning on the transcription of dcuB, and the DcuB produced complexes DcuSF and converts it to the DcuB-DcuS complex. The DcuB-DcuS complex is inactive under the respective conditions (absence of C4-dicarboxylates). The resulting negative-feedback loop ensures formation of the DcuB-DcuS complex having a standby function for an immediate onset of regulation and induction when C4-dicarboxylates become available (14). Detailed information on mode II regulation was lacking, in particular whether DcuSF or DcuB-DcuS represents the major form under mode II conditions, and whether transport by (residual) DcuB can be envisaged under such conditions.
The data on the DcuS, DcuB, and DctA contents obtained here and their relation to regulatory and transport activities allow a quantitative evaluation of the system. Figure 4 shows the correlation of the DcuB level with the conversion of DcuS to the DcuB-DcuS complex (C4-dicarboxylate-responsive form). DcuS function (represented by dcuB-lacZ expression) is plotted as a function of the absolute DcuB contents in the bacteria, as shown in Fig. 3D. The activities of DcuS were normalized (activity per DcuS molecule or unit) for a direct comparison of the effects of various parameters on DcuS activity. The values are given for the noninduced state of DcuS (absence of fumarate, dotted line in Fig. 4) and the induced state (presence of fumarate, broken line in Fig. 4). In the noninduced state, the activity of DcuS was very high (38 Miller units [MU]/DcuS per cell) in the absence of DcuB, and decreased to approximately 2 MU/DcuS in bacteria containing 220 to 270 molecules of DcuB per cell. Such contents are typical for wild-type E. coli or after weak expression of dcuB from plasmid in a DcuB-deficient background (see Fig. 1B and 2B). At high levels of DcuB (850 molecules per cell, expressed from plasmid), the noninduced state decreased slightly (1 MU/DcuS per cell). Regarding the fumarate-induced state, the activity of DcuS started from a relatively high level in the DcuB-deficient strain (22.5 MU/DcuS per cell) and decreased slightly when the DcuB contents increased to cellular levels (Fig. 4, broken line). Higher levels of DcuB produced by overexpression from plasmid have only minor effects on dcuB-lacZ expression. This observation is in agreement with an earlier observation that DcuB-deficient DcuS is highly active in stimulating dcuB-lacZ expression in the absence of fumarate, close to or even higher than the expression by the fumarate-induced DcuB-DcuS complex (13, 15).
FIG 4.
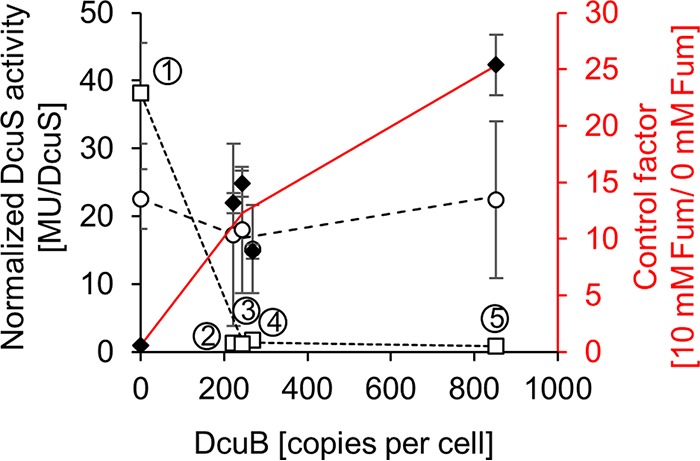
Correlation of dcuB-lacZ or dcuS expression (black) and control factor (red, diamonds) with total contents of DcuB. The normalized DcuS (MU/DcuS per cell) activity in the presence (○, dashed line) or absence (□, dotted line) of fumarate (10 mM) is plotted against the copy number of DcuB. Strain IMW503/pMW2334, carrying dcuB-phoA under the control of the arabinose-inducible pBAD promoter, was grown with 50 mM glycerol and 20 mM DMSO. Levels of DcuB were varied by addition of glucose (100 μM, ④) or l-arabinose (0 μM, ②; 1 μM, ③; or 10 μM ⑤) during cultivation. ① corresponds to the ΔdcuB mutant strain. The β-galactosidase activity was taken from Fig. 2B of reference 13 but normalized for the cellular copy number of DcuS. The ratio between DcuS activity with and without fumarate or the control factor (red line) is given on the red axis. The expression of dcuS-lacZ of E. coli IMW237 (wild-type dcuB, chromosomal) showed normalized DcuS activities of 2.0 and 28.1 MU/DcuS per cell without and with fumarate (expression activity from reference 8, normalized for DcuS contents of E. coli W3110 [Fig. 1]).
The ratio of the fumarate-induced to noninduced dcuB-lacZ expression represents the control factor, or fumarate response, of DcuS (Fig. 4, red line). The control factor is low (close to or even below 1) in the absence of DcuB, and it increases to a factor of 10 to 15 when DcuB is present at wild-type levels (220 to 270 molecules per cell). At high DcuB levels (850 DcuB molecules per cell), it increases to factor of 25.
Previous studies have already shown that DcuS gains fumarate sensitivity only in the DcuB-complexed (or DctA-complexed) state (12–15). The quantitative data shown here extend our understanding of this relationship. First, the quantitative data show that the wild type contains, under all conditions, including the noninduced state, sufficient DcuB to convert DcuS to the DcuB-DcuS complex state (see Fig. 1). This is confirmed by the control factor (mean of 12.3 for the wild-type-like strains) which is characteristic for fumarate-responsive DcuS (11.7 for strain IMW237 in Zientz et al. [8]). The corresponding 5.7-fold excess of DcuB over DcuS in the wild type (see below) appears to be sufficient for converting DcuS mostly to the complexed state. However, further (artificial) increase of DcuB in the DcuB-overproducing strains (Fig. 3B) increases the control factor to 25 (Fig. 4). Therefore, under wild-type conditions, most, but not all DcuS, is complexed.
Prevalence of DcuS in the free versus complexed form in the bacteria.
The SRM data of Fig. 1 and 3 provide, for the first time, information on the cellular contents of DcuS, DcuB, and DctA. Correlation of the data with the transcriptional activity of DcuS (as measured by the expression of dcuB-lacZ) allows conclusions on the state of DcuS, whether it is present in the free (DcuSF) or complexed (DcuB-DcuS) state (Table S6). The data of Fig. 4 and Table S6 show that the control factor of DcuS function (fumarate-induced versus noninduced state) can vary between 25 and 0.6 (see also reference 13). The high value corresponds to a situation where DcuB-DcuS predominates (fumarate-responsive state), and the low value corresponds to bacteria where all DcuS is in the free state (DcuSF, dcuB-deficient strain). It is also known that the overall DcuS content remains constant with and without fumarate (Fig. 1 and 3) (16, 17).
DcuS is a dimer (27), and each DcuS monomer within the dimer can be assumed to interact with one DcuB oligomer when the DcuB-DcuS complex is formed. The oligomeric state of DcuB is unknown, but membrane transporters are often dimers (28) or trimers. Assuming that DcuB prevails as a dimer, the DcuB-DcuS complex has the composition DcuB4-DcuS2. In the noninduced bacteria containing 273 molecules of DcuB and 23.8 molecules of DcuS per cell, the DcuB (DcuB4) is in a 5.7-fold excess over the DcuS dimer (DcuS2) regarding a DcuB4-DcuS2 complex (calculated from 273:4/23.8:2). The excess of DcuB over DcuS, however, does not mean per se that all DcuS is complexed. The maximal number of DcuSF molecules present under such conditions can be estimated, however, from the specific activities of DcuS (Table S6): DcuSF has high activity in the absence of fumarate (38 MU/DcuS, ① in Fig. 4), whereas the activity of DcuS in DcuB-DcuS is very low without fumarate (0.7 MU/DcuS) (Fig. S1) (8). Therefore, the residual activity of DcuS in wild-type E. coli is derived from (i) the large amount of DcuB-DcuS (with low activity), (ii) small amounts of DcuSF, and (iii) some DcuS-independent transcription of dcuB-lacZ. Studies with dcuS deletion strains show that the DcuS-dependent expression (i + ii; DcuSF and DcuB-DcuS dependent) comprises approximately 80% (or 0.6 MU/DcuS) of the residual activity (Fig. S1). If we assume that all of the residual expression is supplied from DcuSF (which is the upper limit), we can calculate the maximal portion of DcuS that exists as DcuSF. This amounts to 1.6% (0.6/38.1) of total DcuS, or 0.4 molecules of DcuSF/cell. For strain IMW503 that produces DcuB-PhoA, the portion of DcuSF is very similar (1.8% of total DcuS) according to the same calculation and the data from Fig. 4 and S1.
Altogether, the data show that under noninducing conditions, wild-type E. coli contains only a very small portion of DcuS in the free noncomplexed state (DcuSF) and 98% (or more) of the DcuS is in the complexed state.
DISCUSSION
Significance of DcuSF and DcuB-DcuS complex for DcuS function.
The roles of DcuSF and of the DcuB-DcuS complex in controlling gene expression have been discussed in a model for DcuS function (14). The model is based on the finding that DcuS is present in two states, DcuSF and complexed DcuS (DcuB-DcuS or DctA-DcuS). Below, we will discuss the model for DcuB and DcuB-DcuS formation, but the same applies to DctA and DctA-DcuS complex formation. From the two forms of DcuS, DcuSF is permanently active in phosphorylation (and gene activation), whereas the DcuB-DcuS complex requires fumarate or other C4-dicarboxylates for conversion to the phosporylative or active state. The levels of DcuB increase largely by fumarate induction. Remarkably, under all conditions (including noninducing conditions), DcuB was present in excess to DcuS and suggests most of the DcuS being complexed.
The scheme of Fig. 5 describes both situations. At very low levels of an inducer, such as fumarate, a constant low level of dcuB expression is observed (left half of Fig. 5; standby or C4-dicarboxylate-independent expression, “mode II” according to Unden et al. [14]). Most of the DcuS is present in the DcuB-DcuS complex (Fig. 5B, left), but there are substantial levels of DcuSF (up to 1.7% of total DcuS). DcuB-DcuS is inactive due to a lack of C4-dicarboxylates, whereas DcuSF is active, resulting in the production of DcuB. The DcuB complexes DcuSF, which is then no longer active. DcuSF is therefore part of a negative-feedback loop switching off further dcuB expression. The second situation (right part of Fig. 5) is typical for substrate induction at increased (e.g., >100 μM) levels of C4-dicarboxylates when the DcuB-DcuS sensor complex becomes induced (fumarate induction, or “mode II” according to reference 14) during growth with high and varied supply of the substrate. Overall, the activity of DcuS in transcriptional regulation is controlled by two mechanisms.
FIG 5.
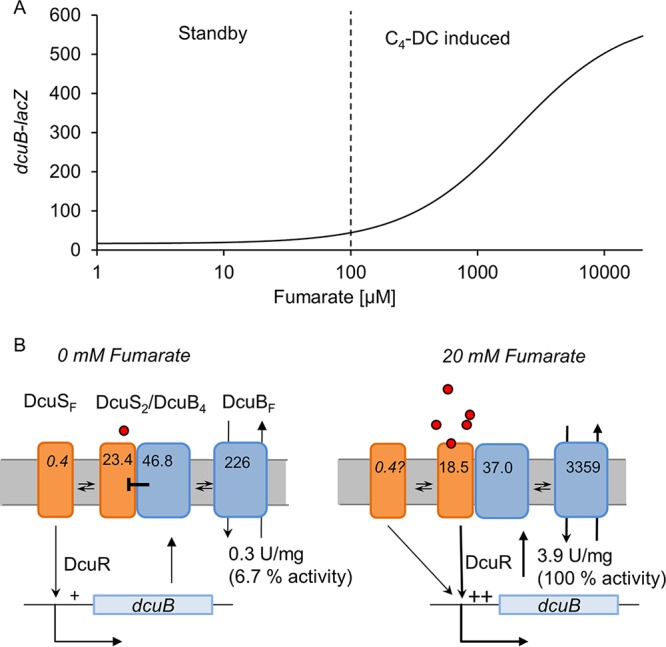
Expression of dcuB-lacZ by DcuS under standby (left) and induced (right) conditions. (A) Modeled expression profile of dcuB-lacZ. (B) Underlying regulation and prevalence of DcuS and DcuB. The total levels of DcuS and DcuB (presented as number molecules per cell) correspond to the levels in wild-type E. coli measured in the absence or the presence of fumarate (20 mM; circles) in this work. The portions of the free (DcuSF and DcuBF) and the complexed (DcuS2/DcuB4) forms are given, and the supporting calculation and a detailed description of the scheme are presented in the text. + and ++ indicate weak and strong expression, respectively.
Assuming that all DcuS is complexed in DcuB4-DcuS2 complexes, it can be estimated that under such conditions, 48 molecules of DcuB are part of the sensor complex, whereas 226 molecules are free and remain for transport (Fig. 5B). In the fumarate-induced state by the same calculation, 37 DcuB molecules are in the complexed state and 3,359 DcuB molecules in the free state for transport. Accordingly, 226/3,359 or 6.7% of the DcuB transporters (DcuBF) of maximally induced E. coli are available for transport in the noninduced bacteria. The transport activity in the noninduced state was 7.7% of that in the induced state (Fig. 2), which is compatible with the levels of DcuB under noninduced versus induced conditions.
Overall, dual regulation by DcuSF (constitutive) and DcuS-DcuB (C4-dicarboxylate dependent) ensures that substantial basal expression of dcuB takes place which is independent of C4-dicarboxylates (but still DcuS dependent) by involvement of the negative-feedback (DcuB-dependent) loop. The maintenance of basal levels of DcuB for transport might be important for adapting the bacteria to an important substrate (C4-dicarboxylates) that is supplied at low and varied levels to the bacteria in the gut.
Control by DcuS requires DcuB-DcuS complex formation (functional switch) and regulation of DcuB-DcuS activity by C4-dicarboxylates (activity regulation).
The quantitative data on DcuS, DcuB, and DctA levels in the bacteria and their link to the functional state of DcuS verify a previous model for a two-step control of DcuS, including a (i) functional switch and (ii) an activity regulation (Fig. 6) (12–14). In an alternative presentation, the regulation by DcuS was presented as an “or” gate logic, where DcuS activity is either initiated by absence of the transporter or presence of C4-dicarboxylates (29). The experimental data show that activity regulation of DcuS includes two mechanisms. DcuB and DctA form complexes with DcuS, converting it to the C4-carboxylate-responsive state. Complex formation serves as the functional switch turning DcuSF into the C4-dicarboxylate-responsive DcuB-DcuS (or DctA-DcuS) complex. In the DcuB-DcuS (or DctA-DcuS) complexes, the autophosphorylative activity of DcuS is then regulated by the C4-dicarboxylates that serve as the modulators or effectors controlling DcuS activity (activity regulation in Fig. 6). The quantitative data of the present study allow an analysis of the state of DcuS (DcuSF versus complexed DcuS) during standby (not C4-dicarboxylate induced) expression of dcuB and the induced expression when C4-dicarboxylates are present (see Fig. 5). From the levels of DcuSF obtained in this way, it became obvious that DcuSF is essential for adopting standby (C4-independent) expression of dcuB. The levels of DcuSF under these conditions are low but establish by a negative-feedback loop the expression of dcuB in a DcuS-dependent manner under low-C4-dicarboxylate or C4-dicarboxylate-deficient conditions.
FIG 6.
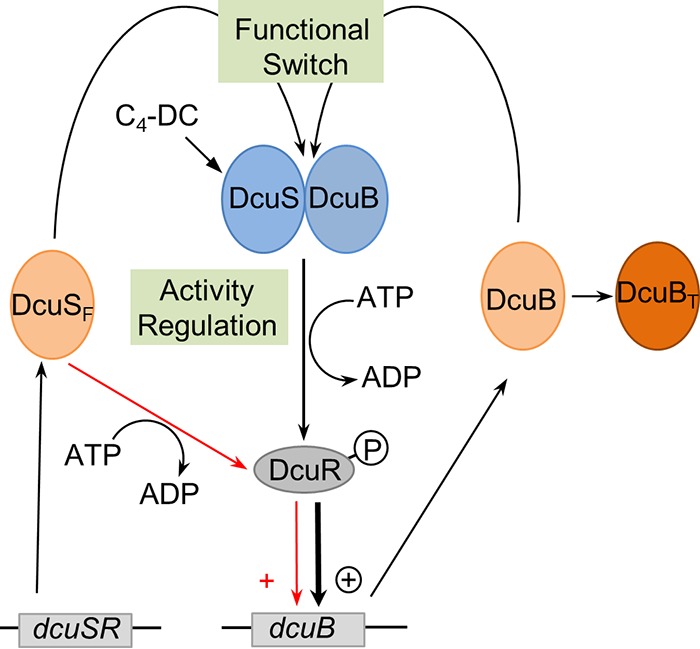
Scheme showing the control of DcuS function by the DcuB-DcuS complex formation (functional switch) and the activity regulation of DcuB-DcuS by C4-dicarboxylates. Formation of the DcuB-DcuS complex converts DcuS from the permanent active (on) to a state where C4-dicarboxylates control activity (activity regulation of DcuS function). The activity of DcuS consists in autophosphorylation; the phosphoryl group is then transferred to the response regulator DcuR. DcuSF (free or noncomplexed DcuS) is present in low concentrations and autophosphorylates in a C4-dicarboxylate-independent manner. The DcuB (light orange) levels exceed those of DcuSF (light orange), and DcuB is directly used for DcuB-DcuS (blue) formation, while the other (larger) parts serve as C4-dicarboxylate transporters (DcuBT; dark orange). Transcriptional activation of dcuB by DcuSF and DcuB-DcuS at low or lacking C4-dicarboxylate concentrations results in standby expression of dcuB, activation by DcuB-DcuS in the presence of C4-dicarboxylate in the induced state (see Fig. 5).
Studies in bacteria have already shown that fumarate metabolism is important for the fitness of E. coli in the mouse intestine (30, 31). Therefore, it will be of interest to test the contributions of both modes of regulation to the fitness of the bacteria in the natural environment under conditions with low and high supply of the substrate or inducer.
MATERIALS AND METHODS
Bacterial strains and plasmids.
The E. coli strains and plasmids used are listed in Table 1. All molecular genetic procedures were performed according to standard protocols. For genetic procedures, cells were grown in LB medium at 37°C. If needed, antibiotics were added at the following concentrations: 100 μg · ml−1 ampicillin, 20 μg · ml−1 chloramphenicol, and 50 μg · ml−1 kanamycin. Antibiotic concentrations were halved if two or more antibiotics were used simultaneously.
TABLE 1.
Strains of E. coli and plasmids used in this study, experiments for which the respective strains or plasmids were used, and the number of replicates of the experiments
| Strain or plasmid | Genotypea | Reference or source | Expt | No. of replicates |
|---|---|---|---|---|
| Strains | ||||
| IMW503 | MC4100 λ[ϕ(dcuB-lacZ)hyb bla+] ΔdcuB | 15 | SRM quantification of DcuS and DctA (anaerobic growth) | 5 |
| SRM quantification of DcuS and DcuB (anaerobic growth) | 3 or 4 | |||
| E. coli W3110 | Wild type | 36 | SRM aerobic growth and fumarate induction (DcuS and DctA quantification) | 3 |
| SRM anaerobic growth and fumarate induction (DcuS and DcuB quantification) | 3 | |||
| IMW237 | MC4100 λ[ϕ(dcuB′-′lacZ)hyb bla+] | 8 | Basal expression of dcuB-lacZ (anaerobic growth in the absence of fumarate) | 2 |
| IMW260 | MC4100 λ[ϕ(dcuB-lacZ)hyb bla+] dcuS::Camr | 8 | Basal expression of dcuB-lacZ (anaerobic growth in the absence of fumarate and DcuS) | 2 |
| IMW658 | E. coli W3110 dcuA::Spcr dcuC::Camr | This work | Transport activity of DcuB (growth under inducing or noninducing conditions) | 2 |
| IMW659 | E. coli W3110 dcuA::Spcr dcuB::Kanr dcuC::Camr | This work | Background transport activity in the absence of all Dcu transporters | 2 |
| Plasmids | ||||
| pMW1194 | pBAD18-Kan* with sequence for C- and N-terminally His6-tagged DctA (Kanr) | 11 | SRM quantification of DcuS and DctA (anaerobic growth) | 5 |
| pMW2334 | pBAD33 with dcuB-phoA | 13 | SRM quantification of DcuS and DcuB (anaerobic growth) | 3 or 4 |
Camr, chloramphenicol resistance; Spcr, spectinomycin resistance; Kanr, kanamycin resistance.
Cultivation and harvest of cells for absolute quantification of DcuB, DcuS, and DctA.
For absolute quantification of DcuB and DcuS, E. coli W3110 wild type or IMW503/pMW2334 was grown anaerobically at 37°C in eM9 medium (32), a modified M9 medium (33) supplemented with glycerol (50 mM) and dimethyl sulfoxide (DMSO; 20 mM). Additional substrates and effectors, like fumarate, l-arabinose, or glucose, were added as indicated. For absolute quantification of DcuS and DctA in IMW503/pMW1194, cells were grown anaerobically as described above. For absolute quantification of DcuS and DctA in E. coli K-12 W3110, wild-type cells were grown aerobically in shaking flasks in eM9 with glycerol (50 mM) or fumarate (50 mM) as carbon and energy sources.
For preparation of E. coli membranes, cells were cultivated until an optical density at 570 nm (OD570) of ≈0.5, and about 80 OD units were harvested by centrifugation. Cells were either directly used or stored at −80°C before use. Cells were resuspended in 50 mM potassium phosphate buffer (pH 7.5) with 500 mM NaCl, 1 mM EDTA, and 1 mM dithiothreitol (DTT) and disrupted by French pressure cell (three passages, 1,38 × 10² MPa, type FA078E1; Aminco, USA). Cell debris was removed by low-speed centrifugation (13,798 × g, 4°C, 10 min; Eppendorf 5403, Hamburg, Germany). Membranes were harvested from the supernatant by ultracentrifugation (208,097 × g, 4°C, 1 h) (LE-80K, TFT 70.38; Beckman Coulter, USA) and stored at −80°C.
For analysis of whole cells, 15 OD units were harvested by centrifugation. Pellets were stored at −80°C.
Transport assay for uptake of [14C]fumarate.
For the transport assay, cells were grown anaerobically in eM9 with 50 mM glycerol and 20 mM DMSO. For induction of dcuB, 20 mM fumarate was added to the medium when indicated. Cells were harvested by centrifugation at an OD578 of ≈0.5 to 0.7, washed in buffer (100 mM sodium potassium phosphate [pH 7], 1 mM MgSO4), and resuspended in this buffer to an OD578 of 8. Prior to incubation with the substrate, cells were preheated at 37°C for 5 min. The uptake assay was started by mixing 50 μl of 200 μmol · liter−1 [14C]fumarate (77.7 Bq · nmol−1) with 50 μl of the cell suspension. After 0.5 min, the uptake was stopped by transferring the mixture into a tube with 900 μl of ice-cold 0.1 mM LiCl, and cells were collected on glass fiber filters (APFF Ø25 mm, pore size 0.7 mm; Millipore). Filters were washed twice with 1 ml of 0.1 mM LiCl, and the [14C]fumarate incorporated by the cells was analyzed by a liquid scintillation counter (Wallac 1414 Win Spectral; PerkinElmer). The uptake activity was calculated from the radioactivity of the cells per milligram (dry weight) (OD578 of 1 corresponds to 281 mg · liter−1 [dry weight]) and the incubation time.
β-Galactosidase assay.
For anaerobic expression studies of dcuB-lacZ, IMW237/pMW2334, IMW260/pMW2334, or IMW503/pMW2334 was grown in eM9 medium supplemented with 50 mM glycerol and 20 mM DMSO. When needed, 100 μM glucose or 0, 1, or 10 μM l-arabinose was added to the medium to repress or induce the expression of target genes under the control of the pBAD promoter. The β-galactosidase assay was performed as described by Wörner et al. (13) and Monzel and Unden (34), and values are given as Miller units (MU) (33).
Sample preparation for SRM analysis.
Pellets of E. coli membranes from 80 OD units were suspended in 300 μl of 8 M urea–2 M thiourea solution (UT) and sonicated (50 W, 3 × 30 s on ice, SonoPuls; Bandelin electronic, Berlin, Germany). Solubilized proteins were obtained by centrifugation (20,000 × g, 4°C, 1 h), and the supernatant was transferred into a new vial. To ensure complete protein recovery, the remaining pellet was subjected to two more cycles of sonication in 150 μl of UT each.
The membrane protein amounts per OD unit for all samples measured in this study are provided in Table S5 in the supplemental material. For the wild-type samples as examples, we investigated the reproducibility of the membrane enrichment in more detail. The coefficient of variation of the protein concentration measurements between the three replicates of each condition ranged from 7% to 19%. A comparison of the proportion of membrane proteins and total protein amounts in the cells (harvested as in reference 20) revealed a 20% portion membrane protein during anaerobic growth but only 10 percent under aerobic growth conditions. This, together with the different cell counts per OD (Table S5) under aerobic and anaerobic conditions, led to different factors for the calculation of protein molecules per cell under aerobic and anaerobic conditions. All three supernatants were collected, and the protein concentration was determined using a Bradford assay (Bio-Rad, Munich, Germany). About 85 to 95% of the total pellet protein contents were found in the first supernatant and less than 1% in the third supernatant. Therefore, all membrane pellets were subjected to sonication twice to ensure complete protein solubilization which is required for absolute quantification of the proteins. Absolute amounts of membrane protein and of E. coli cells were determined by counting the number of bacteria per milliliter of cell culture in a Thoma chamber by light microscopy. The total protein amounts were correlated to the bacterial counts (Table S5).
Absolute quantification of DctA, DcuB, and DcuS by SRM.
Quantification was carried out by using heavily labeled ([13C] and [15N]arginine and lysine) peptides from JPT (JPT, Berlin, Germany) as internal standards for absolute quantification, as described previously (20). Four proteotypic peptides of DctA, three peptides of the DcuB-PhoA construct (one directed against the DcuB part and two against the PhoA part), and three peptides of DcuS were selected (Table S1). The DcuB-specific FISVPENR peptides was the major peptide for DcuB quantification. The heavily labeled peptides contained a C-terminal amino acid tag required for quantification during the manufacturing process, which was cleaved off during tryptic digestion. One nanomole lyophilized powder of each peptide was reconstituted in 100 μl of buffer (80% [vol/vol] aqueous ammonium bicarbonate solution [100 mM] and 20% [vol/vol] acetonitrile [ACN]). The peptide solutions were stored in aliquots of 10 μl at −80°C until usage. To control incorporation rate and purity of the peptides, pure peptide solutions were tryptically digested (which also removed the tag) and analyzed by shotgun MS and SRM. All peptides were fully labeled, and contamination by other peptides (trypsin and keratin) was less than 1.6%. For further analyses, including method optimization and absolute quantification of the proteins, standard peptides were digested together with the samples, as described below. Using dilution series of the heavy standard peptides (0.01, 0.05, 0.1, 0.5, 1, 5, 10, 50, and 100 fmol with 1 μg of E. coli W3110 membrane protein as background) acquired in triplicate, the linear range (R2 > 0.99) between 0 and 100 fmol per μg of protein, in which absolute quantification was possible, was determined for each peptide.
Proteolytic digestion in solution.
From each sample, 4 μg of protein was diluted in 20 mM aqueous ammonium bicarbonate solution to a final urea concentration of <2 M. Heavy peptides were spiked into the sample in this step prior to SRM analyses. Proteins were reduced with 2.5 mM dithiothreitol at 60°C for 1 h and subsequently alkylated with 10 mM iodoacetamide at 37°C for 30 min in the dark. The final urea concentration was decreased to <1 M with 20 mM aqueous ammonium bicarbonate solution to ensure digestion efficiency. The protease trypsin (Promega GmbH, Mannheim, Germany) was added to the sample in a protease-to-protein ratio of 1:25 (wt/wt). Digestion was stopped after 16 to 18 h at 37°C by adding 1% (vol/vol) acetic acid, samples were centrifuged (10 min, 16,000 × g, room temperature), and the supernatant was collected. Peptides were desalted and purified using μC18-ZipTip columns (Merck Millipore, Darmstadt, Germany). Elution buffer was removed using a vacuum centrifuge. Subsequently, peptides were dissolved in 20 μl of 0.1% (vol/vol) aqueous acetic acid containing 2% (vol/vol) ACN. Previously, we could confirm the digestion efficiency of this protocol for E. coli K-12 proteins by one-dimensional (1D) gel analysis with silver staining ascertaining >99.9% digestion (19). Samples were stored in the short term at −20°C until SRM analysis.
Acquisition and analysis of SRM data.
The general settings of the SRM experiment were applied as described previously (20). Briefly, analysis was carried out on TSQ Vantage (Thermo Scientific, Bremen, Germany) after separation of peptides using a nanoAcquity ultrahigh-performance liquid chromatograph (UPLC; Waters Corporation, Manchester, UK). Optimal collision energy (CE) was set at the precursor level beginning from factory defaults (depending on the m/z ratio of the precursor) and then applying different eV in steps of +2 or −2 eV. SRM data were recorded for three to five independent biological replicates for each condition.
Method development and optimization, as well as data analysis, including peptide and protein quantification, were done with the open-source program Skyline version 2.5 (35). The doubly charged precursor and the four most abundant product ions (transitions) were chosen for each peptide during SRM acquisition. Pairs of heavy and light peptides were detected by equal retention time and peak elution pattern. The peptide of each protein showing the highest intensity and the best signal-to-noise ratio from the dilution series of the standard peptides was chosen for protein quantification. For absolute quantification, each of the samples was mixed with defined amounts of each peptide depending on the strain and the experiment, always aiming for a ratio of heavy standard peptide to light sample peptide of 1 to ensure exact quantification. The ratio of the peak area of the heavy (synthetic peptide) to the light (natural sample peptide) peptide which amounted closer to one (single point calibration) was taken into account for absolute quantification. Average values and coefficient of variance were calculated across all replicates for each strain, condition, and experiment. All protein amounts are reported as microgram of membrane protein (10 to 20% of the total protein amount) and molecules per cell, respectively.
Detailed settings for SRM analysis as well as the final transition list containing the detection and the quantification limit for each peptide and the applied spike-in concentrations are provided in Tables S1, S2, and S7.
Supplementary Material
ACKNOWLEDGMENTS
We thank Ulrike Lissner and Katrin Schoknecht for excellent technical assistance.
This work was supported by grants from Deutsche Forschungsgemeinschaft to G.U. (UN 49/19-1).
Footnotes
Supplemental material for this article may be found at https://doi.org/10.1128/JB.00612-17.
REFERENCES
- 1.Cronan JJ, Laporte D. 11 September 2006, posting date Tricarboxylic acid cycle and glyoxylate bypass. EcoSal Plus 2006 doi: 10.1128/ecosalplus.3.5.2. [DOI] [PubMed] [Google Scholar]
- 2.Miles JS, Guest JR. 1987. Molecular genetic aspects of the citric acid cycle of Escherichia coli, p 45–65. In Kay J, Weitzman PDJ (ed), Krebs citric acid cycle. The Biochemical Society, London, United Kingdom. [PubMed] [Google Scholar]
- 3.Unden G, Strecker A, Kleefeld A, Kim OB. 2016. C4-Dicarboxylate utilization in aerobic and anaerobic growth. EcoSal Plus 7:. doi: 10.1128/EcosalPlus.ESP-0021-2015. [DOI] [PMC free article] [PubMed] [Google Scholar]
- 4.Kröger A, Geisler V, Lemma E, Theis F, Lenger R. 1992. Bacterial fumarate respiration. Arch Microbiol 158:311–314. doi: 10.1007/BF00245358. [DOI] [Google Scholar]
- 5.Kay WW, Kornberg HL. 1971. The uptake of C4-dicarboxylic acids by Escherichia coli. Eur J Biochem 18:274–281. doi: 10.1111/j.1432-1033.1971.tb01240.x. [DOI] [PubMed] [Google Scholar]
- 6.Golby P, Davies S, Kelly DJ, Guest JR, Andrews SC. 1999. Identification and characterization of a two-component sensor-kinase and response regulator system (DcuS-DcuR) controlling gene expression in response to C4-dicarboxylates in Escherichia coli. J Bacteriol 181:1238–1248. [DOI] [PMC free article] [PubMed] [Google Scholar]
- 7.Davies S, Golby P, Omrani D, Broad SA, Harrington VL, Guest JR, Kelly DJ, Andrews SC. 1999. Inactivation and regulation of the aerobic C4-dicarboxylate transport (dctA) gene of Escherichia coli. J Bacteriol 181:5624–5635. [DOI] [PMC free article] [PubMed] [Google Scholar]
- 8.Zientz E, Bongaerts J, Unden G. 1998. Fumarate regulation of gene expression in Escherichia coli by the DcuSR (dcuSR genes) two-component regulatory system. J Bacteriol 180:5421–5425. [DOI] [PMC free article] [PubMed] [Google Scholar]
- 9.Engel P, Krämer R, Unden G. 1994. Transport of C4-dicarboxylates by anaerobically grown Escherichia coli. Energetics and mechanism of exchange, uptake and efflux. Eur J Biochem 222:605–614. doi: 10.1111/j.1432-1033.1994.tb18903.x. [DOI] [PubMed] [Google Scholar]
- 10.Six S, Andrews SC, Unden G, Guest JR. 1994. Escherichia coli possesses two homologous anaerobic C4-dicarboxylate membrane transporters (DcuA and DcuB) distinct from the aerobic dicarboxylate transport system (Dct). J Bacteriol 176:6470–6478. doi: 10.1128/jb.176.21.6470-6478.1994. [DOI] [PMC free article] [PubMed] [Google Scholar]
- 11.Witan J, Bauer J, Wittig I, Steinmetz PA, Erker W, Unden G. 2012. Interaction of the Escherichia coli transporter DctA with the sensor kinase DcuS: presence of functional DctA/DcuS sensor units. Mol Microbiol 85:846–861. doi: 10.1111/j.1365-2958.2012.08143.x. [DOI] [PubMed] [Google Scholar]
- 12.Steinmetz PA, Wörner S, Unden G. 2014. Differentiation of DctA and DcuS function in the DctA/DcuS sensor complex of Escherichia coli: function of DctA as an activity switch and of DcuS as the C4-dicarboxylate sensor. Mol Microbiol 94:218–229. doi: 10.1111/mmi.12759. [DOI] [PubMed] [Google Scholar]
- 13.Wörner S, Strecker A, Monzel C, Zeltner M, Witan J, Ebert-Jung A, Unden G. 2016. Conversion of the sensor kinase DcuS of Escherichia coli of the DcuB/DcuS sensor complex to the C4-dicarboxylate responsive form by the transporter DcuB. Environ Microbiol 18:4920–4930. doi: 10.1111/1462-2920.13418. [DOI] [PubMed] [Google Scholar]
- 14.Unden G, Wörner S, Monzel C. 2016. Cooperation of secondary transporters and sensor kinases in transmembrane signalling: the DctA/DcuS and DcuB/DcuS sensor complexes of Escherichia coli. Adv Microb Physiol 68:139–167. [DOI] [PubMed] [Google Scholar]
- 15.Kleefeld A, Ackermann B, Bauer J, Krämer J, Unden G. 2009. The fumarate/succinate antiporter DcuB of Escherichia coli is a bifunctional protein with sites for regulation of DcuS-dependent gene expression. J Biol Chem 284:265–275. doi: 10.1074/jbc.M807856200. [DOI] [PubMed] [Google Scholar]
- 16.Goh EB, Bledsoe PJ, Chen LL, Gyaneshwar P, Stewart V, Igo MM. 2005. Hierarchical control of anaerobic gene expression in Escherichia coli K-12: the nitrate-responsive NarX-NarL regulatory system represses synthesis of the fumarate-responsive DcuS-DcuR regulatory system. J Bacteriol 187:4890–4899. doi: 10.1128/JB.187.14.4890-4899.2005. [DOI] [PMC free article] [PubMed] [Google Scholar]
- 17.Oyamada T, Yokoyama K, Morinaga M, Suzuki M, Makino K. 2007. Expression of Escherichia coli DcuS-R two-component regulatory system is regulated by the secondary internal promoter which is activated by CRP-cAMP. J Microbiol 45:234–240. [PubMed] [Google Scholar]
- 18.Gallie S, Duriez E, Domon B. 2011. Selected reaction monitoring applied to proteomics. J Mass Spectrom 46:298–312. doi: 10.1002/jms.1895. [DOI] [PubMed] [Google Scholar]
- 19.Surmann K, Laermann V, Zimmann P, Altendorf K, Hammer E. 2014. Absolute quantification of the Kdp subunits of Escherichia coli by multiple reaction monitoring. Proteomics 14:1630–1638. doi: 10.1002/pmic.201300563. [DOI] [PubMed] [Google Scholar]
- 20.Surmann K, Ćudić E, Hammer E, Hunke S. 2016. Molecular and proteome analyses highlight the importance of the Cpx envelope stress system for acid stress and cell wall stability in Escherichia coli. Microbiologyopen 5:582–596. doi: 10.1002/mbo3.353. [DOI] [PMC free article] [PubMed] [Google Scholar]
- 21.Gerber SA, Rush J, Stemman O, Kirschner MW, Gygi SP. 2003. Absolute quantification of proteins and phosphoproteins from cell lysates by tandem MS. Proc Natl Acad Sci U S A 100:6940–6945. doi: 10.1073/pnas.0832254100. [DOI] [PMC free article] [PubMed] [Google Scholar]
- 22.Schmidt C, Lenz C, Grote M, Lührmann R, Urlaub H. 2010. Determination of protein stoichiometry within protein complexes using absolute quantification and multiple reaction monitoring. Anal Chem 82:2784–2796. doi: 10.1021/ac902710k. [DOI] [PubMed] [Google Scholar]
- 23.Mallick P, Schirle M, Chen SS, Flory MR, Lee H, Martin D, Ranish J, Raught B, Schmitt R, Werner T, Kuster B, Aebersold R. 2007. Computational prediction of proteotypic peptides for quantitative proteomics. Nat Biotechnol 25:125–131. doi: 10.1038/nbt1275. [DOI] [PubMed] [Google Scholar]
- 24.Schmidt A, Kochanowski K, Vedelaar S, Ahrné E, Volkmer B, Callipo L, Knoops K, Bauer M, Aebersold R, Heinemann M. 2016. The quantitative and condition-dependent Escherichia coli proteome. Nat Biotechnol 34:104–110. doi: 10.1038/nbt.3418. [DOI] [PMC free article] [PubMed] [Google Scholar]
- 25.Ćudić E, Surmann K, Panasia G, Hammer E, Hunke S. 2017. The role of the two-component systems Cpx and Arc in protein alterations upon gentamicin treatment in Escherichia coli. BMC Microbiol 17:197. doi: 10.1186/s12866-017-1100-9. [DOI] [PMC free article] [PubMed] [Google Scholar]
- 26.Kneuper H, Janausch IG, Vijayan V, Zweckstetter M, Bock V, Griesinger C, Unden G. 2005. The nature of the stimulus and the fumarate binding site of the fumarate sensor DcuS of Escherichia coli. J Biol Chem 280:20596–20603. doi: 10.1074/jbc.M502015200. [DOI] [PubMed] [Google Scholar]
- 27.Scheu PD, Liao YF, Bauer J, Kneuper H, Basché T, Unden G, Erker W. 2010. Oligomeric sensor kinase DcuS in the membrane of Escherichia coli and in proteoliposomes: chemical cross-linking and FRET spectroscopy. J Bacteriol 192:3474–3483. doi: 10.1128/JB.00082-10. [DOI] [PMC free article] [PubMed] [Google Scholar]
- 28.Veenhoff LM, Heuberger EHML, Poolmann B. 2002. Quaternary structure and function of transport proteins. Trends Biochem Sci 27:242–249. doi: 10.1016/S0968-0004(02)02077-7. [DOI] [PubMed] [Google Scholar]
- 29.Piepenbreier H, Fritz G, Gebhard S. 2017. Transporters as information processors in bacterial signalling pathways. Mol Microbiol 104:1–15. doi: 10.1111/mmi.13633. [DOI] [PubMed] [Google Scholar]
- 30.Jones SA, Chowdhury FZ, Fabich AJ, Anderson A, Schreiner DM, House AL, Autieri SM, Leatham MP, Lins JJ, Jorgensen M, Cohen PS, Conway T. 2007. Respiration of Escherichia coli in the mouse intestine. Infect Immun 75:4891–4899. doi: 10.1128/IAI.00484-07. [DOI] [PMC free article] [PubMed] [Google Scholar]
- 31.Jones SA, Gibson T, Maltby RC, Chowdhury FZ, Stewart V, Cohen PS, Conway T. 2011. Anaerobic respiration of Escherichia coli in the mouse intestine. Infect Immun 79:4218–4226. doi: 10.1128/IAI.05395-11. [DOI] [PMC free article] [PubMed] [Google Scholar]
- 32.Kim OB, Lux S, Unden G. 2007. Anaerobic growth of Escherichia coli on d-tartrate is independent of d- or l-tartrate specific transporters and enzymes. Arch Microbiol 188:583–589. doi: 10.1007/s00203-007-0279-9. [DOI] [PubMed] [Google Scholar]
- 33.Miller JH. 1992. A short course in bacterial genetics. Cold Spring Harbor Laboratory Press, Cold Spring Harbor, NY. [Google Scholar]
- 34.Monzel C, Unden G. 2015. Transmembrane signaling in the sensor kinase DcuS of Escherichia coli: a long-range piston-type displacement of transmembrane helix 2. Proc Natl Acad Sci U S A 112:11042–11047. doi: 10.1073/pnas.1507217112. [DOI] [PMC free article] [PubMed] [Google Scholar]
- 35.MacLean B, Tomazela DM, Shulman N, Chambers M, Finney GL, Frewen B, Kern R, Tabb DL, Liebler DC, MacCoss MJ. 2010. Skyline: an open source document editor for creating and analyzing targeted proteomics experiments. Bioinformatics 26:966–968. doi: 10.1093/bioinformatics/btq054. [DOI] [PMC free article] [PubMed] [Google Scholar]
- 36.Bachmann BJ. 1972. Pedigrees of some mutant strains of Escherichia coli K-12. Bacteriol Rev 36:525–557. [DOI] [PMC free article] [PubMed] [Google Scholar]
- 37.Zientz E, Six S, Unden G. 1996. Identification of a third secondary carrier (DcuC) for anaerobic C4-dicarboxylate transport in Escherichia coli: role of the three Dcu carriers in uptake and exchange. J Bacteriol 178:7241–7247. doi: 10.1128/jb.178.24.7241-7247.1996. [DOI] [PMC free article] [PubMed] [Google Scholar]
Associated Data
This section collects any data citations, data availability statements, or supplementary materials included in this article.