

Abstract
DNA methylation aberrations have been implicated in acquired resistance to platinum drugs in ovarian cancer (OC). In this study, we elucidated an epigenetic signature associated with platinum drug re-sensitization that may offer utility in predicting the outcomes of patients who are co-administered a DNA methyltransferase inhibitor. The OC specimens we analyzed were derived from a recent clinical trial that compared the responses of patients with recurrent platinum-resistant OC who received carboplatin plus the DNA methyltransferase inhibitor guadecitabine or a standard of care chemotherapy regimen selected by the treating physician. Tumor biopsies or malignant ascites were collected from patients before treatment (day 1, cycle 1) or after treatment (after 2 cycles) for epigenomic and transcriptomic profiling using the Infinium HumanMethylation450 BeadChip (HM450). We defined 94 gene promoters that were hypomethylated significantly by guadecitabine, with 1659 genes differentially expressed in pre-treatment vs. post-treatment tumors. Pathway analysis revealed that the experimental regimen significantly altered immune re-activation and DNA repair pathways. Progression-free survival correlated with baseline expression levels of 1155 genes involved in 25 networks. In functional investigations in OC cells, engineered upregulation of certain signature genes silenced by promoter methylation (DOK2, miR-193a and others) restored platinum drug sensitivity. Overall, our findings illuminate how inhibiting DNA methylation can sensitize OC cells to platinum drugs, in large part by altering gene expression patterns related to DNA repair and immune activation, with implications for improving the personalized care and survival outcomes of OC patients.
Keywords: ovarian cancer, guadecitabine, DNA methylation, platinum resistance
Introduction
Advanced stage ovarian cancer (OC) has poor outcome, five-year survival rates remaining less than 25% despite advances in therapy(1,2). Although most women with OC initially respond to platinum-based chemotherapy, relapses occur in most patients, leading to the development of platinum-resistance, which is uniformly fatal(3,4). It has been postulated that OC progression to a platinum resistant state is intimately linked to accumulated epigenomic alterations, including increased DNA methylation and modifications of histone marks(5–7). Such changes cause transcriptional repression of tumor suppressor (TSGs) and of other genes associated with apoptotic responses to chemotherapy(8,9). For example, promoter methylation has been involved in silencing of TSGs (e.g. BRCA1, MLH1, RASSF1A, DAPK, DOK2, OPCML) and of differentiation-associated transcription factors like HOXA10 and HOXA11(5,10,11) and was linked to OC initiation and chemotherapy resistance(8,9).
Based on this rationale, over the past decade, others and we have conducted bench-to-clinic therapeutic interventions targeting aberrant DNA methylation to re-sensitize ovarian tumors to platinum (12–18). In phase I clinical trials, combinations of platinum and hypomethylating agents were found to be tolerable and biologically active, as measured through global and gene-specific DNA methylation assays in peripheral blood mononuclear cells (PBMCs) and tumors. Two subsequent phase 1/2 clinical trials demonstrated significant clinical efficacy of combination regimens using DNA methyltransferase inhibitors (DNMTIs, decitabine or 5-azacitadine) and platinum, including long progression-free survival (PFS) and high response rates (RR) in platinum resistant OC(15,19). These observations supported a randomized clinical trial testing a next generation DNMT inhibitor guadecitabine (formerly known as SGI-110, Astex Pharmaceuticals, Inc.), and carboplatin against physician’s choice chemotherapy (NCT01696032), which was recently completed(20). Guadecitabine administered daily for 5 days had been found to be tolerable, biologically and clinically active in a previous trial in patients with myelodysplasyic syndrome and acute myelogenous leukemia(21). Tumor biopsies or cancer cells harvested from malignant ascites were collected at baseline and after 2 cycles of treatment. Methylome and transcriptome analyses determined guadecitabine-induced changes in paired tumor biopsies and correlations with PFS. The randomized study was preceded and supported by a phase I component which demonstrated tolerability of guadecitabine at a dose of 30 mg/m2 daily for 5 days preceding carboplatin administration on day 8 in OC patients(18). Pharmacodynamic analyses conducted using PBMCs showed that the regimen was biologically active, as evidenced by ~20% decrease in global LIRE1 (LINE1) DNA methylation(18). Together with the observed clinical activity, these data provided strong rationale for pursuing the randomized phase II trial. Clinical results of the study will be reported separately.
Here, we show that guadecitabine delivered daily over 5 days in low dose alters the epigenome and transcriptome of ovarian tumors, particularly impacting the expression of pathways associated with immune reactivation and DNA repair. Expression of 293 genes on day 1 cycle 1 organized in networks related to immune response processes were associated with PFS, supporting the hypothesis that clinical endpoints are impacted by the biological activity of the DNMTI. Further, we identified several TSGs (e.g. DOK2, miR193a) whose regulation was directly linked to the development of platinum resistance in OC cell lines. However, we believe that alteration of functional pathways, rather than of specific transcripts, are responsible for the clinical activity induced by the combination regimen. A key pathway impacted by treatment with the DNMTI and associated with longer PFS relates to T cell-mediated immune response, suggesting that alterations in the tumor microenvironment induced by guadecitabine contribute to the clinical effects of this new resensitization regimen.
Materials and Methods
Patients
Patients with platinum-resistant recurrent high-grade serous, endometrioid, mixed cell or clear cell epithelial OC (Grade 2 or 3); primary peritoneal carcinomatosis (PPC); or fallopian tube (FT) cancer were eligible for treatment. Eligible patients had acceptable organ function based on laboratory data, Eastern Cooperative Oncology Group performance status (ECOG PS) of 0 or 1, were at least 3 weeks from the last therapy. The protocol and informed consent form were reviewed and approved by an Institutional Review Board/Independent Ethics Committee at each study center prior to implementation. Patients provided written informed consent before enrollment. The study is registered on ClinicalTrials.gov, number NCT01696032 and was conducted in accordance with the International Council for Harmonisation (ICH) Good Clinical Practice (GCP) guidelines, applicable local regulatory requirements, and the principles enunciated in the Declaration of Helsinki.
Study Design
This study had 2 stages: A safety lead-in stage (Stage 1) followed by a randomized, controlled, open-label stage (Stage 2). Study design is detailed in Supplemental Material (SM). Tumor biopsies or malignant ascites/or pleural fluid were obtained from consenting patients at baseline (Cycle 1, Day 1) and after 2 cycles of guadecitabine + carboplatin (G+C) (Cycle 2, Day 8, prior to the carboplatin infusion) by imaging-guided core biopsies. Two 18-gauge cores were obtained for each time point and material was immediately snap frozen (~25–50mg/specimen). Ascites or pleural fluid was centrifuged and fluid and cell pellets were separated prior to cryo-preservation.
Cell lines and culture
The ovarian cancer cell lines OVCAR3 and SKOV3 were obtained from the American Type Culture Collection (ATCC, Manassas, VA), and the OVCAR5 cell line from the Developmental Therapeutics Program at the National Cancer Institute. Cell culture conditions and transfection are described in SM. The SKOV3 and OVCAR3 cell lines were authenticated by the ATCC in 2012 and 2015, respectively. The OVCAR 5 cell line was authenticated by IDEXX BioResearch (Columbia, MO) in 2015.
DNA and RNA extraction
DNA and total RNA were extracted from ~25 mg tumor tissue or 200 µL ascitic fluid using AllPrep DNA/RNA/Protein Mini kit (Qiagen, Valencia CA) following the manufacturer’s protocol. RNA used for real-time RT-PCR was extracted from cultured cells with TRI-Reagent (Sigma-Aldrich) or a miRNeasy kit (Qiagen). DNA and RNA concentrations were determined using the absorbance at 260 nm, and purity was assessed based on the 260/280 nm absorbance ratio.
Methylome analysis
DNA extracted from patient samples was bisulfite converted and DNA methylation was assayed by using the Infinium Human Methylation 450 BeadChip (HM450; Illumina) at the University of Chicago Genomics Facility. Data preprocessing and analyses were conducted in the statistical programming environment R v3.1.2 with the package RnBeads v0.99 (16,22,23). Normalization and background correction were applied to methylation data with manufacture recommended algorithms implemented in methylumi package (see SM (24,25)). Methylation levels were averaged for the replicates for each biopsy after normalization and the difference in methylation β-value between two groups or the mean of the pairwise difference for paired samples was calculated. To correct p-values for multiple hypothesis testing, false discovery rates (FDR) was calculated by using an improved Benjamini-Hochberg procedure(26), and the methylation changes in CpG sites/regions with FDR < 0.05 were considered statistically significant. Ingenuity Pathway Analysis (IPA) was used to identify functional interactions of genes differentially methylated between groups. Average methylation signals on the CpG sites within each CpG island and/or promoter region were hierarchically clustered with Pearson dissimilarity and average linkage as clustering parameters.
In the analysis of the genomic context distribution of CpG sites, individual sites were annotated in regards to positional context relative to nearby CpG island and transcriptional starting site (TSS) based on the Illumina HumanMethylation450 BeadChip manifest. CpG islands were defined as DNA regions longer than 500 bases containing more than 55% GC content and with an observed-to-expected CpG ratio greater than 40%. CpG shores were defined as 2Kb regions immediately upstream and downstream of CpG islands and CpG shelves were defined as 2–4Kb regions from the islands. CpGs unrelated to a CpG islands were classified as “open sea”. CpG sites were considered as being linked to a transcript if they mapped to the 200 to 1500 bases region upstream of TSS (TSS1500), within 200 bases upstream (TSS200), 5’UTR, 1st exon, gene body or 3’UTR. All other CpG sites not mapping to the above-mentioned regions relative to a transcript were defined as ‘not linked to gene’. The Illumina HumanMethylation450 BeadChip results are available for download at Gene Expression Omnibus (GEO) data repository at the National Center for Biotechnology Information (NCBI) under the accession number GSE102119.
Transcriptome analysis
RNA-sequencing was performed essentially as we have described (27,28). See SM for detailed description. The resulting reads were mapped against GRCh38.p5 using TopHat2 version 2.1.1(29). TopHat uses Bowtie, which is based on the Burrows-Wheeler transform algorithm, for sequence alignment and allows for mapping across exon junctions(25). Read counts for each gene were created using HTSeq-Count from the HTSeq package version 0.6.1p1 and Gencode v23 as the annotation(30,31). Custom perl scripts were used for estimation of transcript abundances based on fragments per kilobase of exon per million fragments mapped (FPKM). The differential expression analysis was carried out using the DESeq2 package (version 1.12.3) in R/Bioconductor (R version 3.3.1)(32). DESeq2 fits a generalized linear model (GLM) of the negative binomial family, and a Wald test is performed to evaluate the significance of the coefficients. To define broad pathway responses, gene expression changes in the paired biopsies were assessed using KEGG, GO and pathway analysis IPA and GeneGo. The RNA-sequencing results are available for download at Gene Expression Omnibus (GEO) data repository at the National Center for Biotechnology Information (NCBI) under the accession number GSE102118.
Real-time RT-PCR
For validation of the RNA-sequencing data, qRT-PCR for selected targets was done as we have described (see SM) (16).
Cell proliferation
Cell survival was measured using a Cell Counting Kit-8 (Dojindo Molecular Technologies, Inc., Rockville, MD) according to the protocol provided by the manufacturer. Absorbance at 450 nm was determined with an EL800 microplate reader (BioTek Instruments, Inc., Winooski, VT). Student’s t-tests were used to compare experimental groups. P<0.05 was considered significant.
Clonogenic Assay
Cells were seeded on 6-well plates at the density of 100 cells per well and cultured for 10 days. Colonies were fixed with 4% paraformaldehyde, stained with 1% crystal violet in 2% ethanol, and then counted. Student’s t-tests were used to compare experimental groups. P<0.05 was considered significant.
Correlation of C1D1 levels with clinical outcome
Correlations of C1D1 promoter methylation and gene expression profiles with clinical outcomes were conducted using both logistic and Cox regression. For the logistic regression models, the outcome was PFS ≤ 91 days (the median time to PFS) vs PFS > 91 days. For Cox regression models, the outcome was PFS. Promoter methylation and gene expression levels were tested separately with the false discovery rate (FDR) controlled at the 0.05 level. For the DNA methylation data, M values were adapted to correlate with clinical outcomes. Potential covariates considered included age, race (white, black, Asian, other), ECOG score (0 or 1), ovarian cancer (yes/no), fallopian tube cancer (yes/no), crossover from TC (yes/no), and number of treatment regimens > 3 (yes/no). A step-wise selection method was used to determine final covariate models, and p value < 0.05 was used as the threshold for inclusion of a covariate. Covariates in the final models included ECOG, crossover from treatment choice (TC), race and number of treatment regimens > 3. Models were fit using R v3.1.2 (glm and coxph functions).
Results
Study population
Figure 1A illustrates the study design. 124 subjects were enrolled in the study and 120 were treated (see SM). A total of 98 subjects received G+C (20 subjects in Stage 1, 51 subjects in Stage 2, and 27 TC subjects who were crossed over to G+C after disease progression in Stage 2). Figure 1B illustrates treatment administration schema and timing of tumor biopsies. “Baseline” biopsies were collected pre-guadecitabine on cycle 1 day 1 (C1D), and post-treatment were collected after two full cycles of daily × 5 doses of guadecitabine on day 8 (C2D8). Pre-guadecitabine (C1D1) tumor biopsies were obtained from 42 patients enrolled on this trial, of which 40 yielded high quality nucleic acids, while post-guadecitabine (C2D8) biopsies were obtained from 11 patients, of which 9 yielded high quality nucleic acids. Malignant fluid collection on C1D1 and C2D8 were obtained from 23 and 8 patients, respectively (Fig. 1C). Clinical and DNA methylation data at C1D1 were available for 35 patients. Clinical and RNA-sequencing data at C1D1 were available for 33 patients.
Figure 1. Study population.
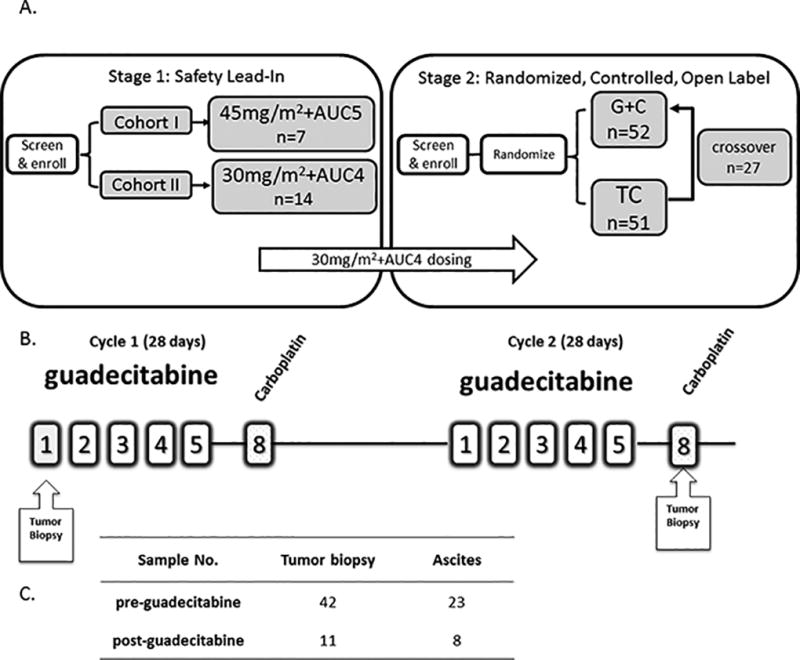
A) Study design includes phase 1 (cohorts I and II) and randomized phase 2. AUC: area under the curve; G+C: guadecitabine + carboplatin; TC: treatment choice. B) Treatment administration schema and timing of tumor biopsies. C) Summary of sample collection.
Genome-wide effects of guadecitabine on DNA methylation
Epigenetic deregulation contributes to both the onset and maintenance of chemoresistance. To evaluate biological effects of the regimen G+C, demethylating activity in vivo was assessed. Global DNA methylation was assessed by using the Infinium HumanMethylation450 BeadChip (HM450) arrays on tumor biopsies collected at baseline on C1D1 (n = 40) and post-treatment collected on C2D8 (n = 9). Differential methylation was conducted in both CpG site level and region level. P value after multiple comparison correction FDR 0.05 was considered as significant, 18644 sites and 191 promoters were found significantly differentially methylated in tumor samples after treatment. Results of the differential methylation between treatment and baseline in paired tumor and paired ascites are shown as volcano plots in Fig. 2. Methylation changes were defined based on the β-value for each CpG site with a Δβ>0.2 for patients within a group for gene hypermethylation and Δβ<0.2 for hypomethylation (i.e., “demethylation”). Setting a significance threshold of P< 0.01 and displaying CpG site differential methylation (post- vs. pre- treatment) as volcano plots, we describe 94 genes with significantly altered CpGI methylation levels between paired tumor biopsies (pre- vs. post-treatment; Fig. 2A, left panel indicated by the shift to the left, red dots are differentially methylated CpG sites with FDR<0.05), and 17 genes had significantly altered CpGI methylation levels between paired ascites (Fig. 2A, right panel).
Figure 2. Methylome changes induced by guadecitabine.
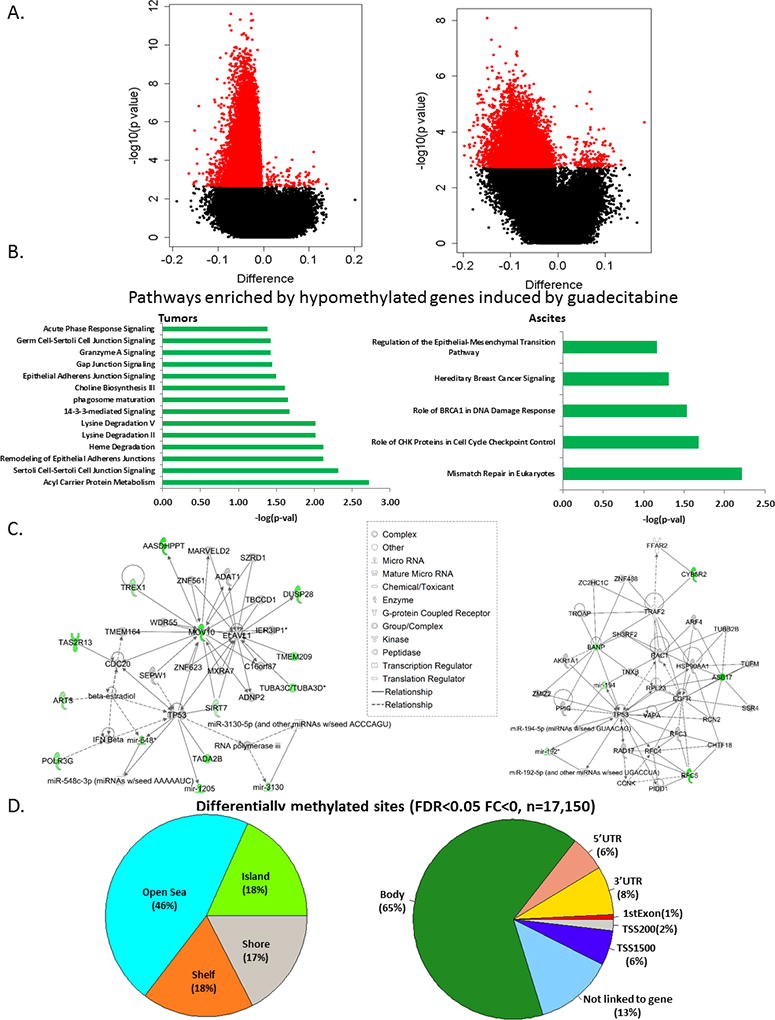
A) Volcano plots of CpG site methylation analysis. Plots of log P value versus log2 fold change for paired (C1D1 vs. C2D8) biopsies (tumors, left; ascites, right). See Supplemental Table S1 for full list of significantly demethylated genes. B) Pathways enriched by significantly demethylated genes induced by guadecitabine (adjusted P value<0.05) in paired biopsies (tumors, left; ascites, right). C) Two top networks constructed by Immune-Response-Related and DNA Replication and Repair induced by guadecitabine in paired biopsies (tumors, left; ascites, right). D) Pie charts showing the distribution of genomic context of the differentially methylated CpG sites examined (left and right charts show genomic context relative to a nearby CpG island or a gene, which defined by Illumina manifest).
Since the lists of differentially methylated genes (Supplementary Table S1) in tumors (94 genes) and ascites (17 genes) by themselves do not provide immediate insights into the biological mechanisms of response to the combined therapy, we examined the pathways enriched by genes hypomethylated after guadecitabine treatment by using IPA. Significantly enriched pathways in the paired tumor biopsies were related to altered metabolism and signaling (Fig. 2B, left), while the most enriched pathways in the ascites were related to DNA damage and repair and epithelial-to-mesenchymal transition (EMT) (Fig. 2B, right). One of the pathways enriched by guadecitabine-induced hypomethylation in tumors was 14-3-3σ, a pathway involved in DNA repair and chemoresistance (33). To define biologically meaningful molecular interactions, we constructed gene-gene interaction networks for the two top networks, Immuno-Response-Related and DNA Replication and Repair for tumors (Fig. 2C, left) and ascites (Fig. 2C, right). These results demonstrate significant guadecitabine-induced gene demethylation in tumors and ascites, affecting interacting gene pathways and networks that potentially contribute to platinum resistance and can be involved in reversal of resistance by the hypomethylating agent.
The probes interrogated on the HumanMethylation450 array are distributed between CpG islands (~one third), regions flanking the CGIs (within 4Kb of the nearest island) referred to as “shelves” and “shores” and representing another third of all sites, and sites unrelated to an island, generally occurring within the gene body and termed as “open sea” sites, which represent another third of all probes. The differentially methylated sites were primarily found in the open sea (46%), vs. islands (18%), shores (17%) and shelves (18%) (Fig. 2D, left). Of all guadecitabine hypomethylated sites, 9% were within 1500 bp of the TSS or in the first exon of a gene, while another 8% and 6% respectively were found in the 3’ UTR and 5’ UTR respectively (Fig. 2D, right). A significant percentage of differentially methylated sites in response to guadecitabine resided in gene bodies (~65%).
Guadecitabine-induced transcriptomic changes
To examine global gene expression changes induced by guadecitabine in tumors, we performed RNA-sequencing on tumor samples (C1D1/baseline, 39 patients; vs. C2D8/post-treatment, 8 patients). First, the tumor content of the biopsies was ascertained by using a Nonnegative Matrix Factorization (NMF) approach (see SM). All specimens, except one (which was subsequently excluded from analyses), had tumor content ≥60%, exceeding the tumor purity of the TCGA OC samples (See Supplementary Fig 1). 502 genes were significantly up-regulated by guadecitabine (fold change>2, FDR<0.05) (Supplementary Table S2). The heatmap in Figure 3A and Supplementary Table S2 illustrates significant transcriptomic changes induced by guadecitabine treatment (C2D8-orange samples) compared to pre-treatment (C1D1, green). Up- and down-regulated genes are marked by red and blue, respectively. To further investigate the potential functional relevance of the differentially expressed genes before (C1D1) and after (C2D8) guadecitabine, IPA was performed. The most significant pathways altered in response to treatment were interleukin-8 (IL8, −log(p-val)=8.31; Fig. 3B) followed by signaling by Rho Family GTPases (−log(p-val)=7.55; Fig. 3B). Of the top 45 pathways, the most highly enriched were predominantly immune-related (15/45) and cancer signaling (20/45) pathways (Fig. 3B, Fig. S2). Also noteworthy was enrichment of the DNA double-strand break repair by homologous recombination pathway (−log(p-val)=2.05; Fig. S2), an important pathway involved in chemo-resistance and -resensitization. The complete list of enriched pathways is included in Supplementary Figure S2. Networks were also constructed by IPA among the top 1659 differentially expressed genes (FC> 2, FDR<0.05). The top networks predicted to be activated by guadecitabine were immune response (phagocytes, neutrophils, leukocytes), adhesion of immune cells and homing of leukocytes (Fig. 3C, center hubs; red and green circles represent up- or down-regulated genes activating (or inhibiting) these immune networks shown on periphery), suggesting that the hypomethylating agent upregulated the immune signaling/response in vivo.
Figure 3. Transcriptomic changes induced by guadecitabine.
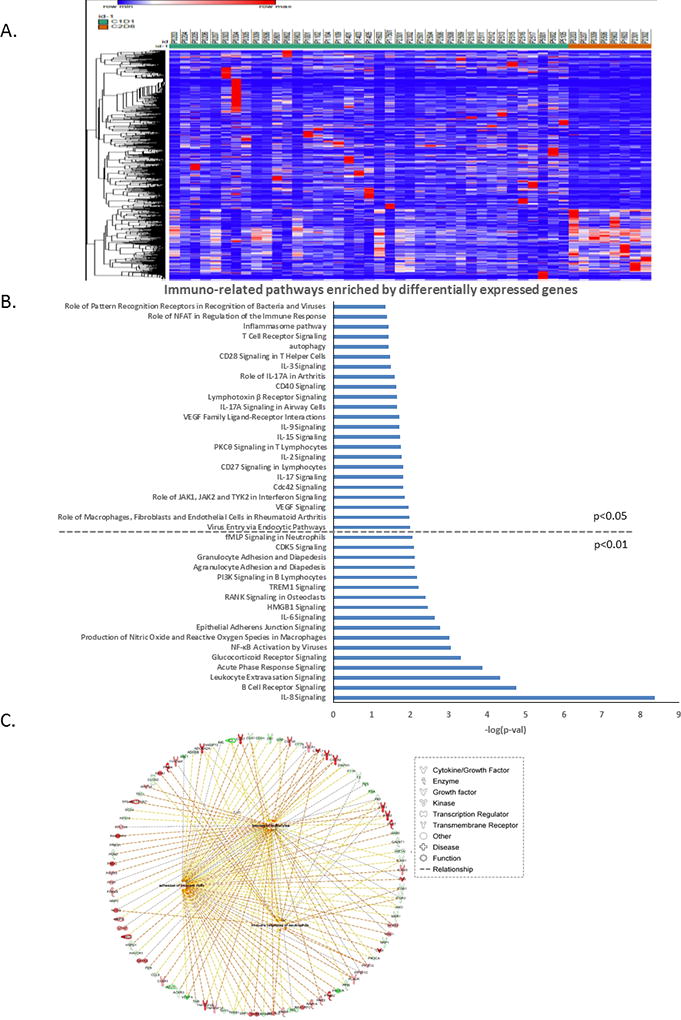
A) Heatmap shows significant transcriptomic changes induced by guadecitabine. Patient IDs are listed on top of the heatmap, and C1D1 (baseline) is coded in green, while C2D8 (post-treatment) is coded in orange (genes shown here are adjusted P<0.05, |fold change|>2). B) Selected immuno-related pathways enriched by differentially expressed genes (adjusted P value<0.05, |fold change|>2) (full pathways lists are in Supplementary Figure 2 A and B). C) Networks of immune response constructed using significantly changed genes by guadecitabine.
Integrated methylome-transcriptome analysis
DNA methylation plays an important role in gene regulation and by inducing demethylation, DNMTIs can cause gene upregulation. To examine the relationships between CpG island methylation and gene expression in tumor cells after treatment with guadecitabine, we performed an integrated transcriptome-methylome analysis on all C1D1 v. C2D8 tumor samples. As CpG island hypermethylation has been shown to directly silence genes, we focused on promoter CpG island-containing genes that were hypomethylated and upregulated after guadecitabine treatment and identified 77 genes meeting this criteria (Fig. 4A and Supplementary Table S3) and observed separate clustering of the C1D1 (green) from C2D8 (orange) samples. The network constructed from the 77 reactivated genes included changes in T lymphocyte chemotaxis, inflammatory response, migration of neutrophils, adhesion of immune cells, and homing of leukocytes (Fig. 4B), in total predictive of a significantly altered immune response after guadecitabine treatment. Overall, our integrated ‘omics analysis showed that guadecitabine induced a potent reprogramming of the ovarian cancer methylome and transcriptome to drive major immunomodulatory changes.
Figure 4. Integrated methylome-transcriptome analysis.
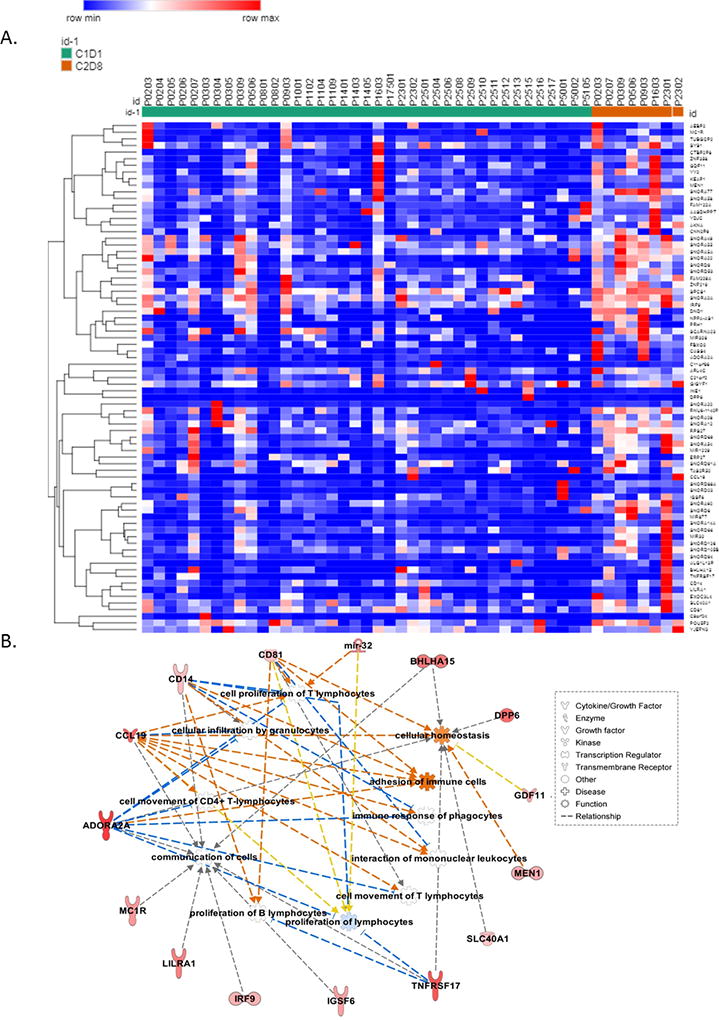
A) A heatmap shows 77 integrated genes that were hypomethylated at promoter CpG island and upregulated (mRNA expression) after guadecitabine treatment. C1D1 (baseline) is coded in green, while C2D8 (post-treatment) is coded in orange. Gene list is shown in Supplementary Table S3. B) Immune-related networks constructed by the 77 integrated genes.
Relationship of guadecitabine-upregulated genes and clinical responses
At C1D1, 1155 genes were significantly associated with PFS in the multivariable Cox regression analysis after correcting for multiple comparisons (Fig. 5A; Supplementary Table S4). Pathways enriched by the 1155 genes include DNA damage-induced 14-3-3σ signaling (Fig. 5B; also seen enriched in Fig. 2B). After guadecitabine treatment, of the 1155 genes, 203 were significantly demethylated (p<0.05, Supplemental Table S5) (Fig. 5C). Among this group of demethylated/reexpressed genes with C1D1 levels that correlated with clinical outcomes, cancer metabolic pathways and the transcriptional regulatory network of embryonic stem cells were enriched (Fig. 5C). An additional 293 genes upregulated by guadecitabine (FC>1.3, p<0.05, Supplemental Table S6) had C1D1 levels that correlated with clinical outcome. Pathways enriched in the group of PFS-associated genes included molecular mechanisms of cancer, apoptosis signaling, cancer metabolism (e.g., amino acid degradation and biosynthesis), and netrin signaling, a tumor suppressor pathway known to be inactivated by methylation in other cancer types (Fig. 5D). No significant correlations were found between promoter methylation or gene expression and PFS by logistic regressions or between C1D1 methylation and PFS by Cox regressions after correcting for multiple comparisons.
Figure 5. Associations between guadecitabine-upregulated genes and clinical outcomes.
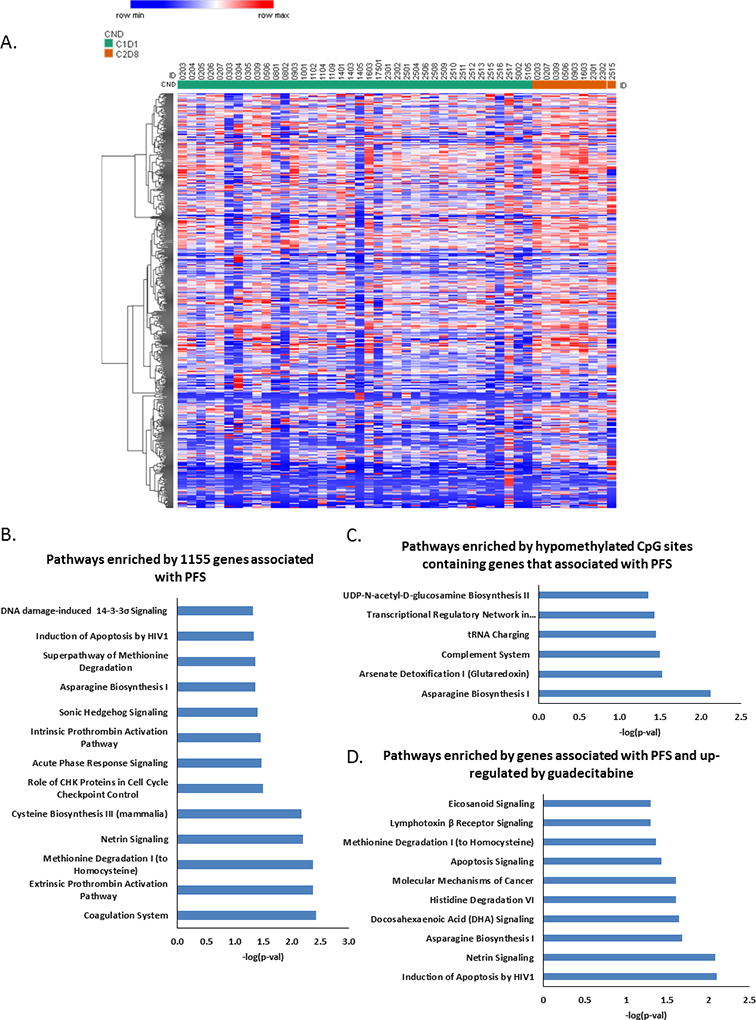
A) A heatmap shows significant up-regulated genes (associated with PFS) by guadecitabine. Adjusted p value<0.05, fold change>1.3. B) Pathways enriched by 1155 genes whose expression profiles significantly associated with PFS in multivariate Cox regression. C) Pathways enriched by hypomethylated CpG sites in genes associated with PFS. D) Pathways enriched by up-regulated genes that are associated with PFS. Adjusted p value<0.05, fold change>1.3.
Functional validation
We used in vitro cellular assays to validate and further investigate specific genes and pathways of interest, selected based on the RNA-sequencing and DNA methylation analyses, our previous studies, and other reports describing their positive contributions to DNA damage-associated apoptosis and/or OC prognosis/outcome. For validation, we selected two genes re-expressed in response to guadecitabine representing functional classes, TSGs and cellular signaling (docking protein 2, DOK2 and miR193a) (Fig. 6A). Both DOK2, an adapter protein downstream of tyrosine kinase, and miR-193a, have been previously reported to play tumor suppressive roles in cancer and to modulate chemo-resistance(34–36).
Figure 6. Docking protein 2 (DOK2) and microRNA 193a (MIR193A) genes are responsive to DNA demethylation and inhibit proliferation in OC cells.
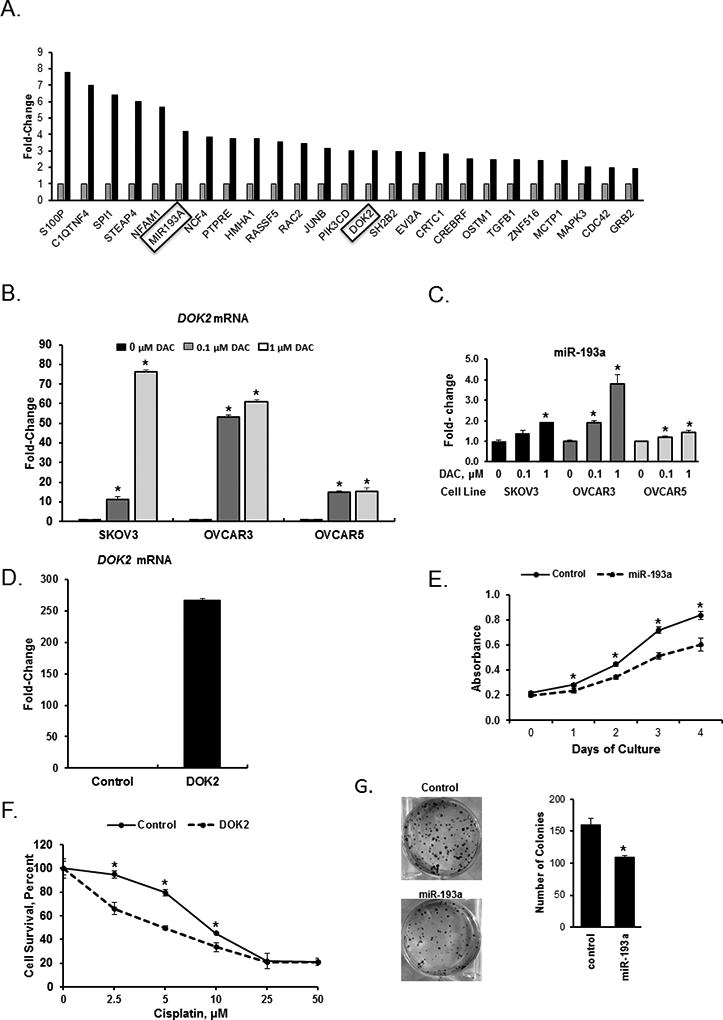
A) Changes in expression of 25 selected genes measured by RNAseq in OC tumors before (n=40) and after (n=9) guadecitabine treatment. The MIR193A and DOK2 genes, which were selected for further validation analyses, are highlighted. B) DOK2 mRNA expression levels measured by real-time RT-PCR in SKOV3, OVCAR3, and OVCAR5 OC cells treated with the hypomethylating agent decitabine (DAC) for 72 hours. C) Real-time RT-PCR measurements of MIR193A mRNA expression levels in SKOV3, OVCAR3, and OVCAR5 OC cells treated with DAC for 72 hours. D) DOK2 mRNA expression levels measured by real-time RT-PCR in SKOV3 cells stably transduced with a vector containing the DOK2 gene. E) Proliferation measured by the CCK8 assay of SKOV3 cells overexpressing or not (Control) the MIR193A gene. F) Survival (CCK8 assay) of SKOV3 cells stably transduced to overexpress the DOK2 gene and treated with cisplatin for 48 hours. G) Clonogenicity of SKOV3 cells overexpressing the MIR193A gene. In B, C, D, E, F and G, experiments were repeated three times, bars represent mean ± SD, n=3. *, P<0.05.
Treatment of OC cell lines SKOV3, OVCAR3 and OVCAR5 with the DNMT inhibitor decitabine significantly increased the expression of both DOK2 and miR193a (Fig. 6B and 6C). To determine the mechanism by which gene reactivation by guadecitabine resensitizes OC cells to platinum therapy, we overexpressed DOK2 (Fig. 6D) or miR-193a (Fig. 6E) in OC cells and examined functional changes using cell proliferation and clonogenic assays in vitro. DOK2 overexpression significantly lowered the concentration of cisplatin required to inhibit SKOV3 OC cell proliferation compared to control (Fig. 6F). Furthermore, miR-193a overexpression decreased (P<0.05) proliferation (Fig. 6E) and colony formation of SKOV3 (Fig. 6G) OC cells, supporting a tumor suppressor function. These results demonstrate that DNA methylation inhibitors lead to upregulation of expression of genes silenced in OC, induce cancer cell growth inhibition, improve chemosensitivity, likely contributing to the clinical benefit recorded in the trial.
Furthermore, we validated one of the pathways found to be enriched in hypomethylated genes in guadecitabine-treated tumors (Fig. 2B), which is involved in cell cycle control and response to chemotherapy (SFN also known as 14-3-3-σ). Knock down of 14-3-3σ by shRNA (Fig. 7A) resulted in increased sensitivity to cisplatin (Fig. 7B), decreased colony formation ability (Fig. 7C) and cell proliferation (Fig. 7D). These results support the involvement of 14-3-3σ in platinum resensitization and tumor growth inhibition induced by the regimen.
Figure 7. Inhibition of stratifin (SFN gene) in OC cells diminishes cell proliferation and increases sensitivity to platinum.
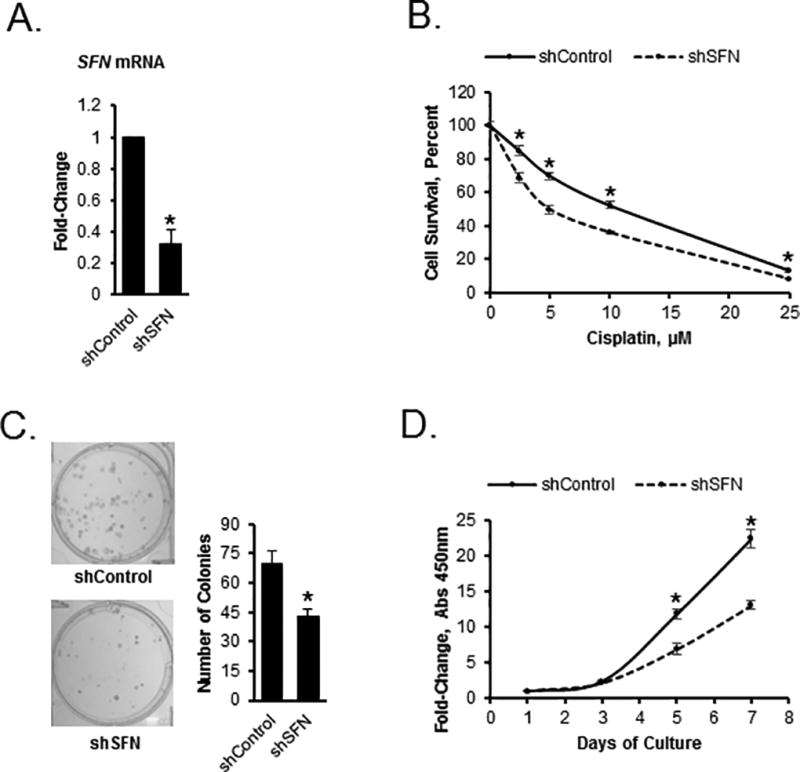
A) Expression levels of the stratifin (SFN) gene in SKOV3 cells stably transfected with control shRNA or shRNA targeting the SFN gene (shSFN, n=3, P<0.05). B) Survival measured by the CCK8 assay of SKOV3 cells transfected with control shRNA or shSFN and treated with cisplatin at the doses indicated (n=3, *P<0.05). C) Clonogenicity of SKOV3 cells transfected with control shRNA or shRNA targeting the SFN gene (shSFN, n=3, *P<0.05). D) Proliferation of SKOV3 cells transfected with control shRNA or shRNA targeting the SFN gene (shSFN, n=3, *P<0.05).
Discussion
Here we present integrated methylomic and transcriptomic analyses of tumor specimens obtained at baseline and after 2 cycles of guadecitabine and carboplatin from women with recurrent, platinum resistant OC enrolled in a randomized phase 2 trial comparing this strategy against physician’s choice of standard chemotherapy. These tumor analyses revealed profound gene expression changes induced by the hypomethylating agent in combination with platinum. Furthermore C1D1 values of these same genes were correlated with observed clinical effects of the regimen. Our study has several important implications.
First, the clinical trial from which tumor and ascites specimens were collected and analyzed represents the first randomized comparison between a novel epigenome targeting strategy and the standard chemotherapy approach for platinum resistant OC. The concept of methylome targeting used in our trial is rooted in accumulating evidence that chromatin changes associated with DNA methylation occur during cancer progression as a consequence of cellular stress, chronic inflammation, and DNA damage. DNMT inhibitors have been shown to be global chromatin remodelers and to exert untargeted effects on the epigenome. While these agents have shown clear activity in myelodysplasia and leukemia, where they are approved for clinical use, their development in solid tumors has lagged due to difficulties of designing tolerable combinations with chemotherapy (37) or biological therapy, and limitations in clinical trial design. In recent years, our group and others have shown that DNMT inhibitors can be safely combined with platinum when using low repetitive doses, which maintain drug biological activity (12,15,19). The clinical results of the current study are reported separately, but of note is that the median rate of PFS at 6 months was 37% for the experimental regimen compared to 13% for physician’s choice treatment (P=0.05), suggesting that the methylome-targeted regimen induces platinum re-sensitization in this setting, and is clinical active.
Second, we show here that guadecitabine induced significant hypomethylation in tumor biopsies and in cells recovered from ascites fluid. These observations are consistent with analyses of PBMCs from patients enrolled in this trial in which guadecitabine-induced demethylation of LINE1 elements was recorded (18). Differences between networks of genes hypomethylated in tumors vs. ascites likely reflect differences in tumor milieu and the “metastatic” state of tumor cells in ascites, with EMT being one of the prominent pathways affected. Significant guadecitabine-induced hypomethylation was also noted in vivo by our group in preclinical studies using OC xenografts treated with this agent (13,16). Global hypomethylation promoted by other DNMTIs in clinical specimens was demonstrated in previous studies testing either decitabine or 5-azacitadine in patients with OC or solid tumors (12,15,38). Our study is limited by lack of histological confirmation, due to scant material obtained through core biopsies and prioritization of nucleic acid extraction for genomic analyses. To mitigate this limitation, an NMF strategy deconvoluted the transcriptomic data and samples included in analyses had a predicted tumor content exceeding 60% (see SM, Supplementary Table 7). CIBERSORT analysis confirmed that the observed significantly demethylated/methylated CpG sites were independent of infiltrating lymphocytes in pre-/post- treatment tissues (See SM, Supplementary Table 8 and Supplementary Figure 3). Additionally, changes in post-treatment tumor biopsies may reflect not only effects of HMA, but also cellular stress in response to platinum.
Interestingly, more than half of guadecitabine-induced differentially methylated sites occurred in gene bodies, consistent with prior observations, which identified such sites as becoming demethylated in response to DNMTIs and rapidly rebounding after the inhibition was removed(39). While the significance of gene body site methylation is not fully elucidated, emerging evidence points to such sites located near enhancer regions as potential regulators of gene expression (40). Additionally, removal of gene body CG sites methylation has been shown to be associated with increased H2A.Z occupancy and enrichment in H3K27me3, contributing to regulation of gene transcription (39).
Integration of methylomic and transcriptomic signals induced by DNMTIs has been generally difficult to demonstrate in human specimens. This is partly explained by variable clinical responses in small data sets and limitations of using core biopsies, which generate small amounts of high quality nucleic acids. Additionally, we acknowledge the nonspecific activity of hypomethylating agents, which exert genome wide effects. It is likely that the re-sensitization effects induced by the regimen are not caused by a single transcript re-expression, but by genome wide reprogramming and activation (or inhibition) of cancer-relevant pathways. Interestingly, among the hypomethylated and re-expressed pathways in tumors, we identified gene networks related to DNA repair, metabolism, and immune response, similar to our previous findings in the phase I/II clinical trial using decitabine in combination with carboplatin(15). A number of metabolic pathways were represented among genes found to be hypomethylated and associated with clinical outcomes. These results are consistent with findings in colon cancer cells exposed to 5-azacitadine, where gene body hypomethylation affected primarily metabolic processes regulated by c-MYC(39).
An important observation from our study relates to reactivation of immune response pathways in ovarian tumors treated with guadecitabine. These results are consistent with our previous and others’ recent findings that epigenome reprogrammers elicit immune stimulation in vivo (15,41,42). A proposed mechanism is DNMTI-induced tumor antigen reexpression (43), as previously shown for the cancer-testis antigen NY-ESO-1 and MAGE antigens, which are frequently repressed epigenetically in ovarian tumors (43,44) and re-expressed as a consequence of treatment with hypomethylating agents (45,46). A recent study using preclinical OC models showed that T helper responses are repressed epigenetically and that removal of this break using epigenetic modulators potentiates response to immunotherapy, including checkpoint inhibitors (47). Additionally, two other studies reported that DNMTIs induce immune signaling in cancer cells by augmenting the viral response pathway and inducing re-expression of endogenous retroviral genes incorporated in the human genome (48,49), suggesting that other immunogenic pathways are also regulated epigenetically. These observations suggest that epigenetic modulators, in particular DNMTIs and HDAC inhibitors may serve as potent primers for immune directed therapy. Indeed, in a phase I study, decitabine potentiated the effects of a NY-ESO-1 directed vaccine, augmenting T-cell immune responses and inducing anti-tumor activity (46) and several new clinical trials exploring combinations of immunotherapy and DNMT inhibitors have recently been activated.
Lastly, we demonstrate that guadecitabine and carboplatin promote reactivation of a number of genes and pathways with tumor suppressor function. Among genes re-expressed in tumor specimens after guadecitabine, we validated that DOK2 and miR193a are silenced epigenetically in ovarian cancer cell lines. Upon re-expression in response to guadecitabine, DOK2 re-sensitized OC cells to platinum and inhibited cancer cell proliferation and clonogenicity, consistent with its previously described functions(50). Likewise, we show that miR193a has tumor suppressor function and is rapidly induced by hypomethylating agents. Lastly, forced downregulation of 14-3-3σ, a pathway whose activation in response to guadecitabine associated with clinical outcomes, inhibited cancer cell proliferation and clonogencity and resensitized OC cells to platinum.
In conclusion, coupled with the clinical results of this study, our tissue-based analyses provide important insight into the mechanisms by which methylome-targeting strategies exert anti-tumor effects. We show that global DNA hypomethylation induced by guadecitabine affects metabolic and immune responses and reactivates TSGs, which contribute to response to platinum. Our data suggest that guadecitabine resensitizes ovarian tumors to platinum, however anti-tumor effects exerted by the novel DNMTI either directly, or indirectly via immune reactivation, cannot be excluded and support future studies exploring hypomethylating agents with other biological interventions.
Supplementary Material
Acknowledgments
We thank Dr. Doug Rusch, Aaron Buechlein and Dave Miller (Center for Genomics and Bioinformatics, Indiana University) for help with data analysis and Dr. Pearlly Yan (The Ohio State University) for technical assistance. This work was funded by the National Cancer Institute Award CA182832-01 and the V- Foundation (to DM and KPN).
Footnotes
Disclaimers: none; no conflicts of interest to disclose.
This study was presented in part at the 2015 American Society of Clinical Oncology Annual Meeting and at the 2014 American Association for Cancer Research
References
- 1.Bukowski RM, Ozols RF, Markman M. The management of recurrent ovarian cancer. Semin Oncol. 2007;34:S1–15. doi: 10.1053/j.seminoncol.2007.03.012. [DOI] [PubMed] [Google Scholar]
- 2.Vaughan S, Coward JI, Bast RC, Jr, Berchuck A, Berek JS, Brenton JD, et al. Rethinking ovarian cancer: recommendations for improving outcomes. Nat Rev Cancer. 2011;11:719–25. doi: 10.1038/nrc3144. [DOI] [PMC free article] [PubMed] [Google Scholar]
- 3.Liu CM. Cancer of the ovary. N Engl J Med. 2005;352:1268–9. author reply-9. [PubMed] [Google Scholar]
- 4.Sandercock J, Parmar MK, Torri V, Qian W. First-line treatment for advanced ovarian cancer: paclitaxel, platinum and the evidence. Br J Cancer. 2002;87:815–24. doi: 10.1038/sj.bjc.6600567. [DOI] [PMC free article] [PubMed] [Google Scholar]
- 5.Barton CA, Hacker NF, Clark SJ, O'Brien PM. DNA methylation changes in ovarian cancer: implications for early diagnosis, prognosis and treatment. Gynecol Oncol. 2008;109:129–39. doi: 10.1016/j.ygyno.2007.12.017. [DOI] [PubMed] [Google Scholar]
- 6.Patch AM, Christie EL, Etemadmoghadam D, Garsed DW, George J, Fereday S, et al. Whole-genome characterization of chemoresistant ovarian cancer. Nature. 2015;521:489–94. doi: 10.1038/nature14410. [DOI] [PubMed] [Google Scholar]
- 7.Watts GS, Futscher BW, Holtan N, Degeest K, Domann FE, Rose SL. DNA methylation changes in ovarian cancer are cumulative with disease progression and identify tumor stage. BMC Med Genomics. 2008;1:47. doi: 10.1186/1755-8794-1-47. [DOI] [PMC free article] [PubMed] [Google Scholar]
- 8.Balch C, Fang F, Matei DE, Huang TH, Nephew KP. Minireview: epigenetic changes in ovarian cancer. Endocrinology. 2009;150:4003–11. doi: 10.1210/en.2009-0404. [DOI] [PMC free article] [PubMed] [Google Scholar]
- 9.Barton CA, Clark SJ, Hacker NF, O'Brien PM. Epigenetic markers of ovarian cancer. Adv Exp Med Biol. 2008;622:35–51. doi: 10.1007/978-0-387-68969-2_4. [DOI] [PubMed] [Google Scholar]
- 10.Fiegl H, Windbichler G, Mueller-Holzner E, Goebel G, Lechner M, Jacobs IJ, et al. HOXA11 DNA methylation--a novel prognostic biomarker in ovarian cancer. Int J Cancer. 2008;123:725–9. doi: 10.1002/ijc.23563. [DOI] [PubMed] [Google Scholar]
- 11.Ibanez de Caceres I, Battagli C, Esteller M, Herman JG, Dulaimi E, Edelson MI, et al. Tumor cell-specific BRCA1 and RASSF1A hypermethylation in serum, plasma, and peritoneal fluid from ovarian cancer patients. Cancer Res. 2004;64:6476–81. doi: 10.1158/0008-5472.CAN-04-1529. [DOI] [PubMed] [Google Scholar]
- 12.Fang F, Balch C, Schilder J, Breen T, Zhang S, Shen C, et al. A phase 1 and pharmacodynamic study of decitabine in combination with carboplatin in patients with recurrent, platinum-resistant, epithelial ovarian cancer. Cancer. 2010;116:4043–53. doi: 10.1002/cncr.25204. [DOI] [PMC free article] [PubMed] [Google Scholar]
- 13.Fang F, Munck J, Tang J, Taverna P, Wang Y, Miller DF, et al. The novel, small-molecule DNA methylation inhibitor SGI-110 as an ovarian cancer chemosensitizer. Clin Cancer Res. 2014;20:6504–16. doi: 10.1158/1078-0432.CCR-14-1553. [DOI] [PMC free article] [PubMed] [Google Scholar]
- 14.Fang F, Zuo Q, Pilrose J, Wang Y, Shen C, Li M, et al. Decitabine reactivated pathways in platinum resistant ovarian cancer. Oncotarget. 2014;5:3579–89. doi: 10.18632/oncotarget.1961. [DOI] [PMC free article] [PubMed] [Google Scholar]
- 15.Matei D, Fang F, Shen C, Schilder J, Arnold A, Zeng Y, et al. Epigenetic resensitization to platinum in ovarian cancer. Cancer Res. 2012;72:2197–205. doi: 10.1158/0008-5472.CAN-11-3909. [DOI] [PMC free article] [PubMed] [Google Scholar]
- 16.Wang Y, Cardenas H, Fang F, Condello S, Taverna P, Segar M, et al. Epigenetic targeting of ovarian cancer stem cells. Cancer Res. 2014;74:4922–36. doi: 10.1158/0008-5472.CAN-14-1022. [DOI] [PMC free article] [PubMed] [Google Scholar]
- 17.Zeller C, Dai W, Steele NL, Siddiq A, Walley AJ, Wilhelm-Benartzi CS, et al. Candidate DNA methylation drivers of acquired cisplatin resistance in ovarian cancer identified by methylome and expression profiling. Oncogene. 2012;31:4567–76. doi: 10.1038/onc.2011.611. [DOI] [PubMed] [Google Scholar]
- 18.Fleming GGS, Lin Yvonne, et al. Clinical epigenetic resensitization of platinum-resistant, recurrent ovarian cancer patients with SGI-110, a novel, second-generation, subcutaneously administered hypomethylating agent (HMA) AACR Annual Meeting. 2014 [Google Scholar]
- 19.Fu S, Hu W, Iyer R, Kavanagh JJ, Coleman RL, Levenback CF, et al. Phase 1b-2a study to reverse platinum resistance through use of a hypomethylating agent, azacitidine, in patients with platinum-resistant or platinum-refractory epithelial ovarian cancer. Cancer. 2011;117:1661–9. doi: 10.1002/cncr.25701. [DOI] [PMC free article] [PubMed] [Google Scholar]
- 20.Ursula A, Matulonis AMO, Angeles Alvarez Secord, et al. Epigenetic resensitization to platinum in recurrent, platinum-resistant ovarian cancer (OC) using guadecitabine (SGI-110), a novel hypomethylatingagent (HMA): results of a randomized Phase 2 study. ASCO National Meeting. 2016:5547. abstract#. [Google Scholar]
- 21.Issa JP, Roboz G, Rizzieri D, Jabbour E, Stock W, O'Connell C, et al. Safety and tolerability of guadecitabine (SGI-110) in patients with myelodysplastic syndrome and acute myeloid leukaemia: a multicentre, randomised, dose-escalation phase 1 study. Lancet Oncol. 2015;16:1099–110. doi: 10.1016/S1470-2045(15)00038-8. [DOI] [PMC free article] [PubMed] [Google Scholar]
- 22.Assenov Y, Muller F, Lutsik P, Walter J, Lengauer T, Bock C. Comprehensive analysis of DNA methylation data with RnBeads. Nat Methods. 2014;11:1138–40. doi: 10.1038/nmeth.3115. [DOI] [PMC free article] [PubMed] [Google Scholar]
- 23.Cardenas H, Vieth E, Lee J, Segar M, Liu Y, Nephew KP, et al. TGF-beta induces global changes in DNA methylation during the epithelial-to-mesenchymal transition in ovarian cancer cells. Epigenetics. 2014;9:1461–72. doi: 10.4161/15592294.2014.971608. [DOI] [PMC free article] [PubMed] [Google Scholar]
- 24.Du P, Zhang X, Huang CC, Jafari N, Kibbe WA, Hou L, et al. Comparison of Beta-value and M-value methods for quantifying methylation levels by microarray analysis. BMC Bioinformatics. 2010;11:587. doi: 10.1186/1471-2105-11-587. [DOI] [PMC free article] [PubMed] [Google Scholar]
- 25.Langmead B, Trapnell C, Pop M, Salzberg SL. Ultrafast and memory-efficient alignment of short DNA sequences to the human genome. Genome Biol. 2009;10:R25. doi: 10.1186/gb-2009-10-3-r25. [DOI] [PMC free article] [PubMed] [Google Scholar]
- 26.Benjamini Y, Yekutieli D. The control of the false discovery rate in multiple testing under dependency. Annals of Statistics. 2001;29:1165–88. [Google Scholar]
- 27.Miller DF, Yan PS, Buechlein A, Rodriguez BA, Yilmaz AS, Goel S, et al. A new method for stranded whole transcriptome RNA-seq. Methods. 2013;63:126–34. doi: 10.1016/j.ymeth.2013.03.023. [DOI] [PMC free article] [PubMed] [Google Scholar]
- 28.Ozes AR, Miller DF, Ozes ON, Fang F, Liu Y, Matei D, et al. NF-kappaB-HOTAIR axis links DNA damage response, chemoresistance and cellular senescence in ovarian cancer. Oncogene. 2016;35:5350–61. doi: 10.1038/onc.2016.75. [DOI] [PMC free article] [PubMed] [Google Scholar]
- 29.Kim D, Pertea G, Trapnell C, Pimentel H, Kelley R, Salzberg SL. TopHat2: accurate alignment of transcriptomes in the presence of insertions, deletions and gene fusions. Genome Biol. 2013;14:R36. doi: 10.1186/gb-2013-14-4-r36. [DOI] [PMC free article] [PubMed] [Google Scholar]
- 30.Anders S, Pyl PT, Huber W. HTSeq--a Python framework to work with high-throughput sequencing data. Bioinformatics. 2015;31:166–9. doi: 10.1093/bioinformatics/btu638. [DOI] [PMC free article] [PubMed] [Google Scholar]
- 31.Harrow J, Frankish A, Gonzalez JM, Tapanari E, Diekhans M, Kokocinski F, et al. GENCODE: the reference human genome annotation for The ENCODE Project. Genome Res. 2012;22:1760–74. doi: 10.1101/gr.135350.111. [DOI] [PMC free article] [PubMed] [Google Scholar]
- 32.Love MI, Huber W, Anders S. Moderated estimation of fold change and dispersion for RNA-seq data with DESeq2. Genome Biol. 2014;15:550. doi: 10.1186/s13059-014-0550-8. [DOI] [PMC free article] [PubMed] [Google Scholar]
- 33.Neupane D, Korc M. 14-3-3sigma Modulates pancreatic cancer cell survival and invasiveness. Clin Cancer Res. 2008;14:7614–23. doi: 10.1158/1078-0432.CCR-08-1366. [DOI] [PMC free article] [PubMed] [Google Scholar]
- 34.Coppin E, Gelsi-Boyer V, Morelli X, Cervera N, Murati A, Pandolfi PP, et al. Mutational analysis of the DOK2 haploinsufficient tumor suppressor gene in chronic myelomonocytic leukemia (CMML) Leukemia. 2015;29:500–2. doi: 10.1038/leu.2014.288. [DOI] [PubMed] [Google Scholar]
- 35.Nakano H, Yamada Y, Miyazawa T, Yoshida T. Gain-of-function microRNA screens identify miR-193a regulating proliferation and apoptosis in epithelial ovarian cancer cells. Int J Oncol. 2013;42:1875–82. doi: 10.3892/ijo.2013.1896. [DOI] [PMC free article] [PubMed] [Google Scholar]
- 36.Deshpande RP, Chandra Sekhar YB, Panigrahi M, Babu PP. Region-Specific Dok2 Overexpression Associates with Poor Prognosis in Human Astrocytoma. Mol Neurobiol. 2016 doi: 10.1007/s12035-016-0324-2. [DOI] [PubMed] [Google Scholar]
- 37.Glasspool RM, Brown R, Gore ME, Rustin GJ, McNeish IA, Wilson RH, et al. A randomised, phase II trial of the DNA-hypomethylating agent 5-aza-2'-deoxycytidine (decitabine) in combination with carboplatin vs carboplatin alone in patients with recurrent, partially platinum-sensitive ovarian cancer. Br J Cancer. 2014;110:1923–9. doi: 10.1038/bjc.2014.116. [DOI] [PMC free article] [PubMed] [Google Scholar]
- 38.Azad NS, El-Khoueiry A, Yin J, Oberg AL, Flynn P, Adkins D, et al. Combination epigenetic therapy in metastatic colorectal cancer (mCRC) with subcutaneous 5-azacitidine and entinostat: a phase 2 consortium/stand up 2 cancer study. Oncotarget. 2017;8:35326–38. doi: 10.18632/oncotarget.15108. [DOI] [PMC free article] [PubMed] [Google Scholar]
- 39.Yang X, Han H, De Carvalho DD, Lay FD, Jones PA, Liang G. Gene body methylation can alter gene expression and is a therapeutic target in cancer. Cancer Cell. 2014;26:577–90. doi: 10.1016/j.ccr.2014.07.028. [DOI] [PMC free article] [PubMed] [Google Scholar]
- 40.Kulis M, Heath S, Bibikova M, Queiros AC, Navarro A, Clot G, et al. Epigenomic analysis detects widespread gene-body DNA hypomethylation in chronic lymphocytic leukemia. Nat Genet. 2012;44:1236–42. doi: 10.1038/ng.2443. [DOI] [PubMed] [Google Scholar]
- 41.Wrangle J, Wang W, Koch A, Easwaran H, Mohammad HP, Vendetti F, et al. Alterations of immune response of Non-Small Cell Lung Cancer with Azacytidine. Oncotarget. 2013;4:2067–79. doi: 10.18632/oncotarget.1542. [DOI] [PMC free article] [PubMed] [Google Scholar]
- 42.Maio M, Covre A, Fratta E, Di Giacomo AM, Taverna P, Natali PG, et al. Molecular Pathways: At the Crossroads of Cancer Epigenetics and Immunotherapy. Clin Cancer Res. 2015;21:4040–7. doi: 10.1158/1078-0432.CCR-14-2914. [DOI] [PubMed] [Google Scholar]
- 43.Adair SJ, Hogan KT. Treatment of ovarian cancer cell lines with 5-aza-2'-deoxycytidine upregulates the expression of cancer-testis antigens and class I major histocompatibility complex-encoded molecules. Cancer Immunol Immunother. 2009;58:589–601. doi: 10.1007/s00262-008-0582-6. [DOI] [PMC free article] [PubMed] [Google Scholar]
- 44.Woloszynska-Read A, Mhawech-Fauceglia P, Yu J, Odunsi K, Karpf AR. Intertumor and intratumor NY-ESO-1 expression heterogeneity is associated with promoter-specific and global DNA methylation status in ovarian cancer. Clin Cancer Res. 2008;14:3283–90. doi: 10.1158/1078-0432.CCR-07-5279. [DOI] [PMC free article] [PubMed] [Google Scholar]
- 45.Nielsen JS, Sahota RA, Milne K, Kost SE, Nesslinger NJ, Watson PH, et al. CD20+ tumor-infiltrating lymphocytes have an atypical CD27− memory phenotype and together with CD8+ T cells promote favorable prognosis in ovarian cancer. Clin Cancer Res. 2012;18:3281–92. doi: 10.1158/1078-0432.CCR-12-0234. [DOI] [PubMed] [Google Scholar]
- 46.Odunsi K, Matsuzaki J, James SR, Mhawech-Fauceglia P, Tsuji T, Miller A, et al. Epigenetic potentiation of NY-ESO-1 vaccine therapy in human ovarian cancer. Cancer Immunol Res. 2014;2:37–49. doi: 10.1158/2326-6066.CIR-13-0126. [DOI] [PMC free article] [PubMed] [Google Scholar]
- 47.Peng D, Kryczek I, Nagarsheth N, Zhao L, Wei S, Wang W, et al. Epigenetic silencing of TH1-type chemokines shapes tumour immunity and immunotherapy. Nature. 2015;527:249–53. doi: 10.1038/nature15520. [DOI] [PMC free article] [PubMed] [Google Scholar]
- 48.Chiappinelli KB, Strissel PL, Desrichard A, Li H, Henke C, Akman B, et al. Inhibiting DNA Methylation Causes an Interferon Response in Cancer via dsRNA Including Endogenous Retroviruses. Cell. 2015;162:974–86. doi: 10.1016/j.cell.2015.07.011. [DOI] [PMC free article] [PubMed] [Google Scholar]
- 49.Roulois D, Loo Yau H, Singhania R, Wang Y, Danesh A, Shen SY, et al. DNA-Demethylating Agents Target Colorectal Cancer Cells by Inducing Viral Mimicry by Endogenous Transcripts. Cell. 2015;162:961–73. doi: 10.1016/j.cell.2015.07.056. [DOI] [PMC free article] [PubMed] [Google Scholar]
- 50.Lum E, Vigliotti M, Banerjee N, Cutter N, Wrzeszczynski KO, Khan S, et al. Loss of DOK2 induces carboplatin resistance in ovarian cancer via suppression of apoptosis. Gynecol Oncol. 2013;130:369–76. doi: 10.1016/j.ygyno.2013.05.002. [DOI] [PubMed] [Google Scholar]
Associated Data
This section collects any data citations, data availability statements, or supplementary materials included in this article.