

Abstract
Prohormone convertase 1/3 is a serine endoprotease belonging to the subtilisin-like proprotein convertase family that is encoded by the proprotein convertase subtilisin/kexin type 1 (PCSK1) gene, and its major function is the processing and bioactivation of the proproteins of many kinds of neuroendocrine hormones, including insulin, cholecystokinin, and adrenocorticotropic hormone. The results of our previous genomewide association study indicated that the PCSK1 gene might be an important candidate gene for fatness traits in chickens. The objectives of this study were to investigate the tissue expression profiles of PCSK1 gene and to identify functional variants associated with fatness and growth traits in the chicken. The results indicated that PCSK1 mRNA was widely expressed in various tissues, especially neuroendocrine and intestinal tissues. Of these 2 tissue types, PCSK1 mRNA expression in lean males was significantly higher than in fat males. A SNP in the 3′ untranslated region of PCSK1 (c.*900G > A) was identified. Association analysis in the Arbor Acres commercial broiler population and Northeast Agricultural University broiler lines divergently selected for abdominal fat content (NEAUHLF) population showed that the SNP c.*900G > A was associated with abdominal fat weight, abdominal fat percentage, BW, metatarsus length, and metatarsal circumference. In the 5th to 19th generation (G5 to G19) of NEAUHLF, the allele frequency of c.*900G > A changed along with selection for abdominal fat content. At G19, allele G of c.*900G > A was predominate in the lean line, whereas allele A was predominate in the fat line. Functional analysis demonstrated that allele A of c.*900G > A reduced mRNA stability and consequently downregulated gene expression. These results suggested that c.*900G > A was a functional SNP for fatness and growth traits in the chicken. The results of this study provide basic molecular information for the role of PCSK1 gene in avian growth and development, especially obesity.
Keywords: chicken, fatness and growth traits, proprotein convertase subtilisin/kexin type 1, single nucleotide polymorphism
INTRODUCTION
Prohormone convertase 1/3 (PC1/3), a member of subtilisin-like proprotein convertase family (Seidah and Prat, 2012), is responsible for the post-translational cleavage of many prohormones and proneuropeptides that participate in the regulation of central and peripheral energy metabolism (Raffin-Sanson et al., 2003; Rehfeld et al., 2008; Yang et al., 2010).
Human QTL mapping results indicated that the proprotein convertase subtilisin/kexin type 1 (PCSK1) gene is located in a QTL region for obesity (Hager et al., 1998; Chagnon et al., 2001; Bell et al., 2004; Chen et al., 2005). A genomewide association study revealed the PCSK1 gene was associated with human obesity (Herbert et al., 2006) and mutations in this gene could cause severe monogenic obesity in humans (Jackson et al., 1997; Kilpeläinen et al., 2009; Chang et al., 2010), because the abnormal PC1/3 hinders maturation of important hormones involved in energy metabolism (Mbikay et al., 2007; Rehfeld et al., 2008). In an obese mouse model, the N222D PC1/3 mutation caused multiple endocrine defects and increased deposition of fat in white adipose tissue due to a defect in insulin maturation (Lloyd et al., 2006). Another PCSK1 knockout mouse model was associated with severe dysplasia, because the absence of the PCSK1 gene leads to reduced progrowth hormone releasing hormone (proGHRH) processing and secondary GH deficiency. Hence, the size of these mice was about 60% of normal at 10 wk (Zhu et al., 2002).
In our previous study, the 55.43 to 56.16 Mb (WUGSC 2.1/galGal3) PCSK1 region of the chicken Z chromosome was identified to be the most heavily selected region associated with the fatness trait (Zhang et al., 2012). However, the function of the chicken PCSK1 gene on fat deposition remains unclear. Therefore, the aims of the current study were to investigate tissue-specific expression profiles of the chicken PCSK1 gene and to identify functional variants associated with fatness and growth traits.
MATERIALS AND METHODS
Ethics Statement
The study protocol was approved by the Laboratory Animal Management Committee of Northeast Agricultural University (Harbin, P.R. China), and all animal experiments were conducted in accordance with the guidelines for the Care and Use of Experimental Animals established by the Ministry of Science and Technology of the People's Republic of China (approval number 2006-398).
Experimental Populations and Management
The Northeast Agricultural University broiler lines divergently selected for abdominal fat content (NEAUHLF) have been established since 1996, according to the abdominal fat percentage (AFP; abdominal fat weight/BW at 7 wk of age) and plasma very-low-density lipoprotein (VLDL) concentration. The original generation of NEAUHLF came from the same base line, which originated from an Arbor Acres grandsire line. Then, the chickens were separated into 2 lines by directional selection, according to their plasma VLDL concentration at 7 wk of age. From the 1st to 19th generation (G1 to G19), birds from each line were raised in 2 hatches. Male birds of 2 lines had access to feed and water ad libitum from hatching to 7 wk of age, and females were under feed restriction starting from 3 wk of age. Plasma VLDL concentrations were measured for all male birds from both hatches at 7 wk of age. Male birds in the first hatch were slaughtered and AFP was calculated. Then, sibling birds in the second hatch, from the families with extreme AFP (lower or higher than the average value in the lean line and the fat line, respectively), were used as candidates for breeding. Simultaneously, plasma VLDL concentration and BW at 7 wk of age (BW7) of male birds in the second hatch and egg production of female birds of both hatches were also considered (Guo et al., 2011). After 19 generations, the average AFP were 0.729% in the lean line and 4.97% in the fat line. A total of 2,743 male birds from G5 to G19 of NEAUHLF were used in the present study.
Another flock, an Arbor Acres commercial broiler population composed of 370 birds (170 male birds and 200 female birds), was also used in the current study.
All birds were kept in similar environmental conditions and had free access to feed and water. Commercial corn–soybean–based diets that met all NRC requirements (NRC, 1994) were provided in the study. The birds were fed starter feed (3,100 kcal ME/kg and 210 g/kg CP) from hatching to 3 wk of age and then a grower diet (3,000 kcal ME/kg and 190 g/kg CP) from 4 to 7 wk of age.
Phenotype Measurements
The phenotypic data of the birds involved in this study were recorded, and genomic DNA was collected and properly kept. Body weight was measured at 1, 3, 5, and 7 wk of age. At 7 wk of age, metatarsus length (MeL), metatarsal circumference (MeC), keel length, and chest width were measured before slaughter (Zhang et al., 2010), and then carcass weight and abdominal fat weight (AFW) were measured after slaughter. Abdominal fat weight was calculated as the ratio of AFW to BW7 (AFP = AFW/BW7).
Sample Collection and Gene Expression
In total, 12 male birds derived from the G19 NEAUHLF population (6 birds from each line) were slaughtered at 7 wk of age after fasting for 10 h. Twenty-nine tissue samples, including the ileum, testis, gizzard fat, cerebrum, hypothalamus, pectoralis muscle, pituitary body, cerebellum, jejunum, pancreas, tibia, duodenum, residual brain, articular cartilage, gizzard, proventriculus, spleen, liver, metatarsus, kidney, heart, femur, abdominal fat, leg muscle, subcutaneous fat, sternum cartilage, sternum, mesentery fat, and crop fat, were collected. After washing with 0.75% NaCl solution, all tissues were snap-frozen in liquid nitrogen and stored at −80°C until used for RNA extraction.
Total RNA was extracted from each tissue (100 mg each) using Trizol reagent (Invitrogen Corp., Carlsbad, CA) in accordance with the manufacturer's protocol. Ribonucleic acid quality was assessed by visualization of the 18S and 28S rRNA bands on a denaturing formaldehyde agarose gel. Only RNA with a 28S:18S ratio of 1.8 to 2.1 was used for reverse transcription. In particular, total RNA of each sample from 3 lean male birds and 3 fat male birds (randomly selected from the 6 sampled birds in each line) was pooled in equal amounts. The pooling sample of each tissue was used for detection of tissue-specific PCSK1 mRNA expression. Samples from individual birds were used for the comparison of PCSK1 mRNA expression levels between fat and lean birds. Reverse transcription was performed using the RNeasy Plus Mini Kit (QIAGEN GmbH, Hilden, Germany) according to the manufacturer's protocol.
Quantitative reverse-transcription PCR (qRT-PCR) was used to analyze gene expression levels against TATA box binding protein (TBP) as an internal reference (Cabiati et al., 2012). Quantitative reverse-transcription PCR was performed using the FastStart Universal SYBR Green Master kit (Roche AG, Basel, Switzerland) on a 7500 Real-Time PCR System (Applied Biosystems Inc., Foster City, CA). A 1-µL aliquot of each reverse-transcription reaction product was amplified in a 10-µL PCR reaction mixture, which was then amplified in an ABI Prism 7500 sequence detection system (Applied Biosystems Inc.) programmed for 1 cycle at 95°C for 10 min and 40 cycles at 95°C for 15 s and at 60°C for 1 min. Dissociation curves were analyzed using Dissociation Curve 1.0 software (Applied Biosystems Inc.) for each PCR reaction to detect and eliminate possible primer dimer artifacts. The relative expression level of the target gene to TBP was determined using the  method, in which CT is the cycle threshold value and ΔCT = CT(PCSK1) − CT(TBP). The statistical significance of the comparison of PCSK1 mRNA expression levels between fat and lean birds was evaluated using the 2-tailed Student's t-test. The primers used for qRT-PCR (Table 1) were designed to cross introns.
Table 1.
Primers used in the quantitative reverse-transcription PCR
| Gene1 | Accession number | Primers (5′–3′)2 |
|---|---|---|
| PCSK1 | XM_003643060 | F: ACT AAG CGT GCT GCT GTG AC |
| R: CAC TCC AAG CCA TCA TCT AAT AC | ||
| TBP | NM_205103 | F: GCG TTT TGC TGC TGT TAT TAT GAG |
| R: TCC TTG CTG CCA GTC TGG AC | ||
| hRluc | AY535007 | F: TGA TCG AGT CCT GGG ACG A |
| R: ACA ATC TGG ACG ACG TCG GG |
PCSK1 = proprotein convertase subtilisin/kexin type 1; TBP = TATA box binding protein; hRluc = synthetic Renilla luciferase.
F = forward; R = reverse.
Sequencing of PCSK1 Exons and Detection of Variants
Six birds from the NEAUHLF G15 population (3 individuals per line) were selected to detect polymorphisms in all exons of the PCSK1 gene. Total RNA isolated from the intestinal tissues of these 6 birds was reverse transcribed into cDNA as described above. A 5,825-bp fragment of PCSK1 gene from each individual was cloned from cDNA and ligated into a T-vector and then sequenced by (Invitrogen, Shanghai, P.R. China). Primers used for cloning are listed in Supplemental Table S1 (see the online version of the article at http://journalofanimalscience.org). Variants of these sequences were detected using the DNAMAN package version 4.0 (Lynnon BioSoft, Vaudreuil-Dorion, QC, Canada). After sequence alignments, 4 SNP were detected, 1 in the coding sequence (CDS) region and 3 others in the 3′ untranslated region (UTR). The SNP in the CDS region is a silent mutation, named c.927T > C. The SNP in the 3′-UTR were named c.*856G > A, c.*900G > A, and c.*1164C > T. c.*900G > A and c.*1164C > T were located in the restriction endonuclease recognition sites of Hpy188I and HinfI, respectively. No restriction endonuclease can recognize the other SNP. So we first genotyped the c.*900G > A by the PCR-RFLP method and investigated its biological function.
Genotyping of SNP
Genomic DNA was isolated from venous blood samples by the conventional phenol–chloroform method. The SNP c.*900G > A was genotyped by the PCR-RFLP method. The primers (5′ GGT TTA GAC TAG TGA CAG TCA TAT TC 3′ and 5′ CCT TCC CTC TAT TTA TGA CTC TC 3′) were designed to amplify a 565-bp fragment containing the SNP c.*900G > A using Primer Premier 5 software (PREMIER Biosoft International, Palo Alto, CA) based on the chicken genome sequence retrieved from the GenBank database (https://www.ncbi.nlm.nih.gov/genbank; accessed 20 November 2012) under the accession number NC_006127. Each 25-µL PCR reaction volume included 50 ng of template, 1x reaction buffer, 5 pM of each primer, 0.16 mM of deoxyribonucleotide triphosphate, 1.5 mM MgCl2, and 1 unit Taq polymerase. The PCR reaction conditions were 94°C for 5 min, 30 cycles of 95°C for 30 s, 55°C for 30 s, 72°C for 30 s, and a final extension at 72°C for 7 min. Two microliters of 565-bp PCR products were digested with 1 unit of the restriction endonuclease Hpy188I in a 10-µL reaction volume at 37°C for 12 h. The genotypes were analyzed by 1.5% agarose gel electrophoresis. The χ2 test was used to evaluate differences in allele frequencies between the lean and fat lines. To assess the change of allele frequencies over generations, a multinomial logistic regression model was used (Schiavo et al., 2016). This model assumes a linear relationship between time (generation) and a log transformation of the ratio between allele frequencies. Following the likelihood ratio theory, a significance test was performed using Wilks test statistics, which took −2 times the difference of the log likelihood between the alternative model and the null model. The corresponding P-value was computed using a χ2 distribution with 1 df. Model fitting and the likelihood ratio test were performed using the NNET package (Venables and Ripley, 2002) in R version 2.15.1 (http://www.R-project.org/).
Association Analyses
The associations between the SNP c.*900G > A and fatness and growth traits were analyzed using the Generalized Linear Mixed Model included with the JMP 4.0 software package (SAS Inst. Inc., Cary, NC). The models used were as follows:
Model [1] was used for association analysis of the Arbor Acres commercial broiler population, which was fitted with the genotype (G) and sex (S) as fixed effects; family (f) and dam nested within family [d(f)] as random effects; G × S as the interaction of G by S effect; and BW7 as a linear covariate (except for the percentage traits and BW traits). Model [2] was used for association analysis of the NEAUHLF population, which was fitted with the genotype (G), line (L), and generation (GE) as fixed effects; family (f) nested within line [f(l)] and dam nested within the line and family [d(f, l)] as random effects; G × L and G × GE as the interaction of G by L and G by GE effects; and BW7 as a linear covariate (except for the percentage traits and BW traits). In the NEAUHLF population, only male birds were slaughtered and phenotyped; therefore, sex effect was not included in model [2].
In both model [1] and model [2], y is the dependent variable for the traits measured in the population, μ is the overall population mean of the traits, and e is the residual random error. Significant differences between least squares means of different genotypes were calculated using a contrast test.
Luciferase Reporter Assay
The reporter construct was prepared by amplifying the 148-bp 3′-UTR of the PCSK1 gene containing the SNP c.*900G > A using the forward primer 5′ CCC TCG AGG GAC TTG AAA GAA CCA ACC 3′ and the reverse primer 5′ TTG CGG CCG CAT GGT CAC AGG TTA AGG ATG 3′ from 2 individuals carrying different alleles. The PCR products were ligated into the psiCHECK-2 basic vector downstream of the Renilla luciferase (hRluc) gene at the XhoI and NotI restriction sites (New England BioLabs Inc., Ipswich, MA) to produce the reporter plasmids PCSK1G-psiCHECK-2 and PCSK1A-psiCHECK-2.
DF-1 is an immortalized fibroblast cell line derived from East Lansing Line 0 leghorn layer embryos (Himly et al., 1998). The DF-1 cell line is widely used in cellular and molecular studies in chickens, including the luciferase reporter assay (Kwok et al., 2008; Mannstadt et al., 2008; Wang et al., 2013); therefore, we used this cell line in this study. DF-1 cells were cultured in Dulbecco's modified Eagle's medium (Invitrogen Corp., Carlsbad, CA; 11965-092) with 10% fetal bovine serum (Biological Industries USA, Inc., Cromwell, CT). Transfections were performed using Lipofectamine 2000 Reagent (Invitrogen Corp., Carlsbad, CA) according to the manufacturer's instructions. DF-1 cells were seeded in 12-well plates, transfected with 1.0 µg/well of the reporter plasmid the next day, and harvested after 32 h. Then, the activities of firefly luciferase (hFluc) and hRluc were measured. Luciferase activity was read using a Synergy 2 device and Gene 5 software (BioTek Instruments, Inc., Winooski, VT). Relative luciferase activity was calculated as the ratio of hRluc activity to hFluc activity. Five independent replicates were performed. The statistical significance of the luciferase reporter assay was evaluated using the 2-tailed Student's t-test.
Messenger RNA Decay Measurements
To estimate mRNA decay rates, transcription was inhibited by the addition of 5 µg/mL actinomycin D (ActD; Sigma-Aldrich Corp., Darmstadt, Germany) to the medium (Eberhardt et al., 2002) 24 h after transfection with the reporter plasmids. Ribonucleic acid was extracted at the indicated time points, and qRT-PCR was used to assess the amount of hRluc transcripts remaining at 0, 2, 4, 6, 9, and 12 h after ActD treatment by the absolute quantitative method. The percentage of remaining hRluc transcripts was calculated with the 0-h time point set to 100%. A linear relationship in each group was ensured, and the regression equation was built according to the amount of RNA in each time point. The half-life was calculated according to the regression equation.
RESULTS
Characterization of the Tissue Expression of the PCSK1 Gene
PCSK1 gene expression was measured in 29 different tissues collected from lean and fat birds. The results showed that chicken PCSK1 was widely expressed in various tissues and highly expressed in neuroendocrine tissues (the pituitary body, hypothalamus, cerebrum, testis, and residual brain) and intestinal tissues (the duodenum, jejunum, and ileum; Fig. 1).
Figure 1.
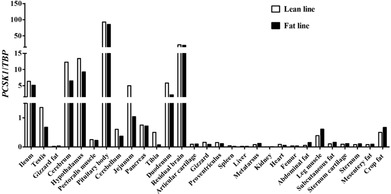
Characterization of the tissue expression pattern of the chicken proprotein convertase subtilisin/kexin type 1 (PCSK1) gene in transcriptional level in 7 wk of age lean and fat male broilers of the Northeast Agricultural University broiler lines divergently selected for abdominal fat content population. TATA box binding protein (TBP) was used as an internal reference gene.
Comparison of PCSK1 mRNA Expression Levels between Fat and Lean Males
Then, PCSK1 gene expression levels in those 8 highly expressed tissues (the duodenum, jejunum, ileum, pancreas, residual brain, cerebrum, pituitary body, and hypothalamus) were compared between birds from fat lines and birds from lean lines. The PCSK1 expression levels of lean line broilers were significantly higher than those of fat line broilers in 7 of the tissues tested (excluding the pancreas; P < 0.05 or P < 0.01; Fig. 2).
Figure 2.
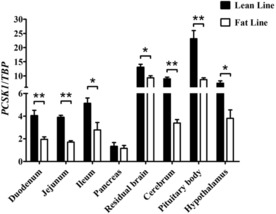
Difference of proprotein convertase subtilisin/kexin type 1 (PCSK1) mRNA expression levels between lean and fat male birds. TATA box binding protein (TBP) was used as an internal reference gene. The results were expressed as means ± SEM (n = 6 animals/group). *P < 0.05; **P < 0.01.
Associations of c.*900G > A in the PCSK1 Gene with Fatness and Growth Traits in the Arbor Acres Commercial Broiler and Northeast Agricultural University Broiler Lines Divergently Selected For Abdominal Fat Content Populations
A SNP located in the 3′-UTR of PCSK1 (c.*900G > A) was detected and genotyped. The genotype and allele frequencies of c.*900G > A in the Arbor Acres commercial broiler and NEAUHLF populations are shown in Supplemental Table S2 (see the online version of the article at http://journalofanimalscience.org) and Table 2, respectively. Association analyses between c.*900G > A and fatness and growth traits in the Arbor Acres commercial broiler (200 female and 170 male birds) and NEAUHLF (2,743 male birds across G5 to G19) populations were performed using model [1] and model [2], respectively. The results indicated that the SNP c.*900G > A was significantly associated with AFW and AFP in both populations (P < 0.01). The SNP c.*900G > A was significantly associated with BW at 5 wk of age, BW7, carcass weight, MeL, MeC, chest width, BW at 1 wk of age, and keel length in the Arbor Acres commercial broiler population and significantly associated with BW at 1 wk of age, MeL, and MeC in the NEAUHLF population (P < 0.05 or P < 0.01; Table 3).
Table 2.
The comparisons of allele frequencies between the lean and fat lines of Northeast Agricultural University broiler lines divergently selected for abdominal fat content from the 5th to the 19th generation (G5 to G19) populations
| Genotype frequency1 | Allele frequency | ||||||
|---|---|---|---|---|---|---|---|
| Generation | Line | GG | AG | AA | G | A | χ2 |
| G5 | Lean line | 0.136 (14) | 0.621 (64) | 0.243 (25) | 0.447 | 0.553 | 1.369 (P = 0.242) |
| Fat line | 0.067 (1) | 0.533 (8) | 0.400 (6) | 0.333 | 0.667 | ||
| G6 | Lean line | 0.219 (30) | 0.496 (68) | 0.285 (39) | 0.467 | 0.533 | 1.544 (P = 0.214) |
| Fat line | 0.162 (12) | 0.486 (36) | 0.351 (26) | 0.405 | 0.595 | ||
| G7 | Lean line | 0.416 (37) | 0.427 (38) | 0.157 (14) | 0.629 | 0.371 | 23.143 (P < 0.001) |
| Fat line | 0.117 (11) | 0.521 (49) | 0.362 (34) | 0.378 | 0.622 | ||
| G8 | Lean line | 0.659 (56) | 0.282 (24) | 0.059 (5) | 0.800 | 0.200 | 76.864 (P < 0.001) |
| Fat line | 0.141 (13) | 0.391 (36) | 0.467 (48) | 0.337 | 0.663 | ||
| G9 | Lean line | 0.699 (65) | 0.280 (26) | 0.022 (2) | 0.839 | 0.161 | 111.070 (P < 0.001) |
| Fat line | 0.126 (12) | 0.347 (33) | 0.526 (50) | 0.300 | 0.700 | ||
| G10 | Lean line | 0.762 (64) | 0.226 (19) | 0.012 (1) | 0.875 | 0.125 | 144.140 (P < 0.001) |
| Fat line | 0.049 (4) | 0.341 (28) | 0.610 (51) | 0.220 | 0.780 | ||
| G11 | Lean line | 0.884 (84) | 0.116 (11) | 0.000 (0) | 0.942 | 0.058 | 227.428 (P < 0.001) |
| Fat line | 0.042 (4) | 0.263 (25) | 0.695 (66) | 0.174 | 0.826 | ||
| G12 | Lean line | 0.936 (88) | 0.064 (6) | 0.000 (0) | 0.968 | 0.032 | 269.171 (P < 0.001) |
| Fat line | 0.000 (0) | 0.247 (23) | 0.753 (70) | 0.124 | 0.876 | ||
| G13 | Lean line | 0.747 (71) | 0.253 (24) | 0.000 (0) | 0.874 | 0.126 | 197.705 (P < 0.001) |
| Fat line | 0.000 (0) | 0.305 (29) | 0.695 (66) | 0.153 | 0.847 | ||
| G14 | Lean line | 0.817 (76) | 0.172 (16) | 0.011 (1) | 0.903 | 0.097 | 263.877 (P < 0.001) |
| Fat line | 0.000 (0) | 0.128 (12) | 0.872 (82) | 0.064 | 0.936 | ||
| G15 | Lean line | 0.705 (67) | 0.274 (26) | 0.021 (2) | 0.842 | 0.158 | 213.103 (P < 0.001) |
| Fat line | 0.000 (0) | 0.189 (18) | 0.811 (77) | 0.095 | 0.905 | ||
| G16 | Lean line | 0.884 (84) | 0.116 (11) | 0.000 (0) | 0.942 | 0.058 | 279.868 (P < 0.001) |
| Fat line | 0.000 (0) | 0.168 (16) | 0.832 (79) | 0.084 | 0.916 | ||
| G17 | Lean line | 0.905 (86) | 0.095 (9) | 0.000 (0) | 0.953 | 0.047 | 297.227 (P < 0.001) |
| Fat line | 0.032 (3) | 0.074 (7) | 0.895 (85) | 0.068 | 0.932 | ||
| G18 | Lean line | 0.895 (85) | 0.095 (9) | 0.011 (1) | 0.942 | 0.058 | 284.676 (P < 0.001) |
| Fat line | 0.000 (0) | 0.149 (14) | 0.851 (80) | 0.074 | 0.926 | ||
| G19 | Lean line | 0.978 (90) | 0.022 (2) | 0.000 (0) | 0.989 | 0.011 | 314.075 (P < 0.001) |
| Fat line | 0.000 (0) | 0.147 (14) | 0.853 (81) | 0.074 | 0.926 | ||
Numbers shown in parentheses are the number of individuals with the specified genotype.
Table 3.
Association analysis of PCSK1 SNP c.*900G > A on fatness and growth traits in the Arbor Acres commercial broiler population and Northeast Agricultural University broiler lines divergently selected for abdominal fat content (NEAUHLF) population (P-value)
| P-value | ||
|---|---|---|
| Trait1 | Arbor Acres commercial broiler population2 | NEAUHLF population3 |
| BW1 | 0.0388* | 0.0363* |
| BW3 | 0.8207 | 0.4319 |
| BW5 | 0.0096** | 0.1932 |
| BW7 | <0.0001** | 0.1533 |
| CW | <0.0001** | 0.7977 |
| MeL | <0.0001** | 0.0118* |
| MeC | <0.0001** | 0.0115* |
| KeL | 0.0472* | 0.1319 |
| ChiW | <0.0001** | 0.4669 |
| AFW | <0.0001** | <0.0001** |
| AFP | <0.0001** | <0.0001** |
BW1, BW3, BW5, and BW7 = BW at 1, 3, 5, and 7 wk of age, respectively; CW = carcass weight; MeL = metatarsus length; MeC = metatarsal circumference; KeL = keel length; ChiW = chest width; AFW = abdominal fat weight; AFP = abdominal fat percentage.
This population included 370 birds (170 male birds and 200 female birds).
This population included 2,743 male birds.
P < 0.05; **P < 0.01.
Comparison of Allele Frequencies of the PCSK1 SNP C.*900G > A between the Fat and Lean Lines from the 5th to the 19th Generation of Northeast Agricultural University Broiler Lines Divergently Selected For Abdominal Fat Content Populations
Analysis of the change in the allele frequency of the SNP c.*900G > A along with selection for abdominal fat indicated that the frequency of allele A significantly increased in the fat line along with the generations (P = 1.21 × 10−49) based on multinomial logistic regression model whereas the frequency of allele G significantly increased in the lean line along with the generations (P = 1.52 × 10−102; Fig. 3). In the lean and fat lines at G19, the frequencies of allele G were 0.989 and 0.074, respectively, whereas those of allele A were 0.011 and 0.926, respectively, which meant allele G was predominate in the lean line and allele A was predominate in the fat line. The changing trends of the frequencies of these 2 alleles were similar to the changing trends of AFP between the 2 lines. There was no significant difference in the allele frequency of the SNP c.*900G > A between the lean and fat lines in the G5 and G6 populations, whereas there were significantly different allele frequencies between the 2 lines from G7 to G19 (Fig. 3; Table 3).
Figure 3.
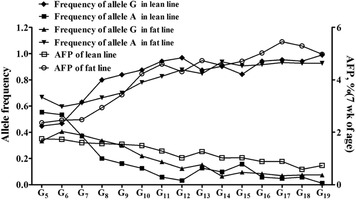
The change of allele frequencies of SNP c.*900G > A along with the selection for abdominal fat content from the 5th to the 19th generation (G5 to G19) in the Northeast Agricultural University broiler lines divergently selected for abdominal fat content population. AFP = abdominal fat percentage.
Effects of c.*900G > A on Luciferase Activity and mRNA Stability
To investigate the biological effects of the different alleles, 2 plasmids were constructed that contained 2 different alleles (A or G) of the SNP c.*900G > A. The luciferase reporter assay was performed using DF-1 cells. The results showed that there were significant differences (P < 0.01) in relative luciferase activities between the 2 constructs carrying the 2 different alleles, and the luciferase activity of the construct carrying allele G (PCSK1G-psiCHECK-2) was about 1.6-fold that of the construct carrying allele A (PCSK1A-psiCHECK-2; Fig. 4A).
Figure 4.
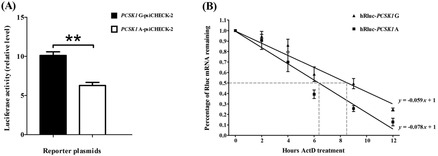
The effects of different alleles of c.*900G > A on luciferase activities and mRNA stability. (A) Relative luciferase activity was calculated as the ratio of synthetic Renilla luciferase (hRluc) activity vs. firefly luciferase (hFluc) activity. DF-1 cells were transfected with 1.0 µg of the psiCHECK-2 plasmids (PCSK1G/A-psiCHECK-2) in 12-well plates. Cells were harvested 32 h after transfection, and the activities of hFluc and hRluc were measured. The results were expressed as means ± SEM. **P < 0.01. (B) DF-1 cells were transfected with 1.0 µg of the psiCHECK-2 plasmids (PCSK1G/A-psiCHECK-2) in 12-well plates. Twenty-four hours after the transfection, the cells were treated with 5 g/mL actinomycin D (ActD). Ribonucleic acid was extracted at the indicated times. The amount of hRluc transcript remaining at each time point was measured by quantitative reverse-transcription PCR by the absolute quantitative method, and the percentage of remained hRluc transcript was calculated with the 0-h time point set to 100%. The linear regression equation was established according to RNA amounts at each time point, and the half-life was calculated according to the regression equation.
Furthermore, differences in mRNA stability between alleles G and A of c.*900G > A were detected. DF-1 cells were transiently transfected with the luciferase constructs carrying different alleles and harvested at 0, 2, 4, 6, 9, and 12 h after ActD treatment. Then, mRNA levels were absolutely quantified by qRT-PCR. As shown in Fig. 4B, the degradation rates of the hRluc mRNA fragments carrying different alleles were dissimilar. The half-life of the hRluc mRNA fragment with allele G was about 8.5 h, whereas the half-life of the hRluc mRNA fragment with allele A was about 6.4 h, indicating that the mRNA stability of hRluc carrying allele A was lower than that carrying allele G.
DISCUSSION
Prohormone convertase 1/3 is a member of the proprotein convertase family, and its major function is processing the proproteins of many kinds of neuroendocrine hormones, such as insulin, cholecystokinin, and adrenocorticotropic hormone, to make them become bioactive (Raffin-Sanson et al., 2003; Rehfeld et al., 2008; Yang et al., 2010). In mammals, the PCSK1 gene has been reported to be an important factor affecting growth and development, especially fat deposition (Jackson et al., 1997; Zhu et al., 2002; Lloyd et al., 2006; Fontanesi et al., 2012). However, the function of the PCSK1 gene has remained relatively unknown in chickens. Therefore, studying the expression characteristics and identifying the functional variants of the chicken PCSK1 gene could elucidate the mechanism of this gene on growth and fat deposition and guide further investigations of the chicken PCSK1 gene.
The results of this study showed that chicken PCSK1 mRNA was mainly expressed in neuroendocrine and intestinal tissues (Fig. 1), which was similar to the results of studies in other species. In humans, the PCSK1 gene is mainly expressed in the pituitary, brain (Seidah et al., 1992), and intestinal tissues (Martín et al., 2013). Similarly, the mouse PCSK1 gene is also expressed in the pituitary (Ftouhi et al., 1994), hypothalamus (Nilaweera et al., 2003), pancreas islet (Liu et al., 2012), and intestines (Gagnon et al., 2009). Deficiencies of many kinds of neuroendocrine hormones that are involved in metabolism and energy balance, such as proopiomelanocortin (Souza et al., 2016) and insulin (Elisha et al., 2017), are reported to be associated with human obesity. On the other hand, hormones secreted by the gut are also associated with obesity through regulation of appetite and energy absorption (Nagaraj and Manjappara, 2016; ten Kulve et al., 2016; Dardzińska et al., 2017). Combining the expression characteristics of the chicken PCSK1 gene in the present study and the function of PC1/3 reported in mammals, it is reasonable to speculate that the function of PC1/3 in the chicken may be similar to that in mammals; therefore, chicken PC1/3 may process a variety of proneuropeptides and prohormones into functional hormones involved in the regulation of central and peripheral energy metabolism. The results of quantitative analysis in the current study showed that PCSK1 mRNA expression was higher in neuroendocrine tissues and intestinal tissues in lean male chickens than in fat male birds (Fig. 2). This phenomenon indicated that there may be differences in transcriptional and/or post-transcriptional processes of the PCSK1 gene between lean and fat birds, and to some extent, these differences may contribute to the disparity of abdominal fat deposition between the 2 lines.
There were some reports about the association of PCSK1 mutations with human obesity. Compound heterozygous PCSK1 mutations were reportedly detected in a patient who presented with several neuroendocrine diseases, including reactive hypoglycemia and severe obesity with onset in infancy (Jackson et al., 1997). Three nonsynonymous SNP (rs6232, rs6234, and rs6235) in PCSK1, which lead to the substitution mutations N221D (rs6232), Q665E (rs6234), and S690T (rs6235), respectively, were found to be associated with extreme obesity in 7 independent European case–control studies (Benzinou et al., 2008). Furthermore, the N221D mutation was reported to cause a significant decrease in the enzymatic activity of PC1/3 (Benzinou et al., 2008; Blanco et al., 2015). In other species, PCSK1 gene mutations were also reportedly associated with fat deposition and obesity. Fontanesi et al. (2012) resequenced a 5.1-kb fragment of the porcine PCSK1 gene and detected 14 polymorphisms. Association analysis results showed that among these 14 polymorphisms, 3 tag SNP were significantly associated with backfat thickness and visible intermuscular fat in the Duroc Italiana strain of the domestic pig (Fontanesi et al., 2012). In a mouse model of obesity, the N222D mutation of the PCSK1 gene led to decreased processing of substrates, such as proinsulin and hypothalamic and pituitary proopiomelanocortin (Lloyd et al., 2006; Prabhu et al., 2014). In the current study, we wanted to first sequence the exons of the PCSK1 gene to detect genetic variants, and PCSK1 was highly expressed in the chicken intestine. Therefore, we sequenced PCSK1 cDNA prepared from intestinal tissues to get all exonic sequences and detected variants in the 5′-UTR, CDS, and 3′-UTR of PCSK1. One variant in the 3′-UTR, named c.*900G > A, was first genotyped. The association between the SNP c.*900G > A in the 3′-UTR of the chicken PCSK1 gene and fatness traits (AFW and AFP) in both the Arbor Acres commercial broiler population and NEAUHLF population was detected (Table 3). The results indicated that similar to that in the human, pig, and mouse, the chicken PCSK1 gene plays an important role in fat deposition.
The gradually separate allele frequencies of the SNP c.*900G > A supported the above conclusion from another perspective. Results of the logistic regression showed that allele frequency significantly changed during G5 to G19. As shown in Fig. 3, the changes in the allele frequency of c.*900G > A were surprisingly similar to the change in the mean AFP in the NEAUHLF populations. Therefore, the PCSK1 gene was selected along with selection against abdominal fat in NEAUHLF, which means that the PCSK1 gene may play important roles, either directly or indirectly, in the deposition of abdominal fat and the SNP (c.*900G > A) in the 3′-UTR of the PCSK1 gene could be an important genetic marker to reduce abdominal fat deposition in chickens.
Besides the fatness trait, the PCSK1 gene also plays an important role in the growth of animals. A PCSK1 knockout mouse model expressed an unexpected phenotype, prenatal lethality and growth retardation, rather than obesity (Zhu et al., 2002). A further study using this model indicated that processing of proGHRH was defective because of the absence of PC1/3, thereby leading to secondary GH deficiency (Zhu et al., 2002). Single nucleotide polymorphisms in the PCSK1 gene were also associated with the growth performance of Italian Large White and Italian Large White × Italian Landrace pigs (Fontanesi et al., 2012). The results of the current study showed that the PCSK1 gene was widely expressed in chicken tissues and significant associations were detected between the SNP c.*900G > A and growth traits in both the Arbor Acres commercial broiler and NEAUHLF populations (Table 3). Other mammal research showed that GHRH was the product of proGHRH modification by the PC1/3 (Dey et al., 2004). Moreover, chicken GHRH (cGHRH) is reportedly important for food intake of chickens (Tachibana et al., 2015). At the same time, the release of chicken GH was found to be mediated by cGHRH (Harvey et al., 2014). We previously evaluated the serum GH levels in the fat and lean lines. The serum chicken GH level in lean birds was significantly higher than that in fat birds (P < 0.01; unpublished data). Taken together, these findings indicate that the PCSK1 gene could affect the growth traits of chickens by taking part in cGHRH processing, thereby further affecting food intake. Therefore, the SNP c.*900G > A of the PCSK1 gene might be a functional variant that influences not only fatness but also growth traits in chickens.
In this study, we observed that the allele frequencies of c.*900G > A followed the dynamic pattern of AFP changes in the NEAUHLF. However, we could not determine whether this variation was functional or not from this phenomenon. Therefore, we performed the luciferase reporter assay and analyzed the mRNA stability to investigate the biological effects of this variation. First, the dual luciferase reporter gene plasmids with either allele G or allele A inserted in the 3′-UTR of hRluc were used to transiently transfect chicken DF-1 cells. The results showed that allele A significantly decreases the relative activity of hRluc, compared with allele G (Fig. 4), which indicated that allele A might negatively regulate PCSK1 gene expression. As mentioned above, there was a significant difference in PCSK1 mRNA expression levels between the 2 chicken lines. Also, mutations in the 3′-UTR could affect mRNA stability (Wang et al., 2006; Kamiyama et al., 2007; Laguette et al., 2011). Taken together, these findings suggest that the SNP c.*900G > A might enforce some biological effects by affecting mRNA stability. Therefore, a mRNA stability assay was used to verify this conjecture. The results showed that stability of the hRluc mRNA carrying allele A was lower than that of allele G, further indicating that allele A decreases the stability of PCSK1 mRNA, thereby reducing expression of mutational PCSK1 at the mRNA level. Moreover, other studies demonstrated that the SNP in the 3′-UTR could regulate gene expression in a variety of ways, including interacting with microRNAs (Zhang et al., 2011; Wang et al., 2016a,b) and proteins (Suhl et al., 2015), and affecting the secondary structure and, consequently, the stability of mRNA (Werk et al., 2014). The results of these experiments indicated that this variation may be functional. However the mechanism of how c.*900G > A affects the stability of PCSK1 mRNA will require further studies.
In summary, the results of the present study showed that PCSK1 mRNA was expressed in various tissues and highly expressed in neuroendocrine and intestinal tissues. The SNP c.*900G > A in the 3′-UTR of the PCSK1 gene was found to be associated with fatness and growth traits in chickens. There was a significant difference in the allele frequency of c.*900G > A between the fat and lean lines. The stability of PCSK1 mRNA was lower with allele A of c.*900G > A, resulting in reduced PCSK1 mRNA expression. The results obtained in this study indicated that the PCSK1 gene played an important role in chicken growth and development, especially in obesity, and will guide further detailed investigations of PCSK1 gene function in these processes.
Footnotes
This research was supported by the National 863 Project of China (number 2013AA102501), the China Agriculture Research System (number CARS-42), the National Natural Science Foundation (number 31301960), Natural Science Foundation of Heilongjiang Province of China (QC2016023), and the University Nursing Program for Young Scholars with Creative Talents in Heilongjiang Province (number UNPYSCT-2015007). The authors would like to thank the members of the poultry breeding group at Northeast Agricultural University for helping in managing the birds and collecting the data.
LITERATURE CITED
- Bell C. G., Benzinou M., Siddiq A., Lecoeur C., Dina C., Lemainque A., Clément K., Basdevant A., Guy-Grand B., Mein C. A. 2004. Genome-wide linkage analysis for severe obesity in French Caucasians finds significant susceptibility locus on chromosome 19q. Diabetes 53(7):1857–1865. doi: 10.2337/diabetes.53.7.1857 [DOI] [PubMed] [Google Scholar]
- Benzinou M., Creemers J. W. M., Choquet H., Lobbens S., Dina C., Durand E., Guerardel A., Boutin P., Jouret B., Heude B. 2008. Common nonsynonymous variants in PCSK1 confer risk of obesity. Nat. Genet. 40(8):943–945. doi: 10.1038/ng.177 [DOI] [PubMed] [Google Scholar]
- Blanco E. H., Ramos-Molina B., Lindberg I. 2015. Revisiting PC1/3 mutants: Dominant-negative effect of endoplasmic reticulum-retained mutants. Endocrinology 156(10):3625–3637. doi: 10.1210/en.2015-1068 [DOI] [PMC free article] [PubMed] [Google Scholar]
- Cabiati M., Raucci S., Caselli C., Guzzardi M. A., D'Amico A., Prescimone T., Giannessi D., Del R. S. 2012. Tissue-specific selection of stable reference genes for real-time PCR normalization in an obese rat model. J. Mol. Endocrinol. 48(3):251–260. doi: 10.1530/JME-12-0024 [DOI] [PubMed] [Google Scholar]
- Chagnon Y. C., Rice T., Pérusse L., Borecki I. B., Ho-Kim M. A., Lacaille M., Paré C., Bouchard L., Gagnon J., Leon A. S. 2001. Genomic scan for genes affecting body composition before and after training in Caucasians from HERITAGE. J. Appl. Physiol. 90(5):1777–1787. [DOI] [PubMed] [Google Scholar]
- Chang Y. C., Chiu Y. F., Shih K. C., Lin M. W., Sheu W. H. H., Donlon T., Curb J. D., Jou Y. S., Chang T. J., Li H. Y., Chuang L. M. 2010. Common PCSK1 haplotypes are associated with obesity in the Chinese population. Obesity (Silver Spring) 18(7):1404–1409. doi: 10.1038/oby.2009.390 [DOI] [PubMed] [Google Scholar]
- Chen G., Adeyemo A. A., Johnson T., Zhou J., Amoah A., Owusu S., Acheampong J., Agyenimboateng K., Eghan B. A., Oli J. 2005. A genome-wide scan for quantitative trait loci linked to obesity phenotypes among West Africans. Int. J. Obes. 29(3):255–259. doi: 10.1038/sj.ijo.0802873 [DOI] [PubMed] [Google Scholar]
- Dardzińska J. A., Kaska Ł., Wiśniewski P., Aleksandrowicz-Wrona E., Małgorzewicz S. 2017. Fasting and post-prandial peptide YY levels in obese patients before and after mini versus Roux-en-Y gastric bypass. Minerva Chir. 72(1):24–30. doi: 10.23736/S0026-4733.16.07212-6 [DOI] [PubMed] [Google Scholar]
- Dey A., Norrbom C., Zhu X., Stein J., Zhang C., Ueda K., Steiner D. F. 2004. Furin and prohormone convertase 1/3 are major convertases in the processing of mouse pro-growth hormone-releasing hormone. Endocrinology 145(4):1961–1971. doi: 10.1210/en.2003-1472 [DOI] [PubMed] [Google Scholar]
- Eberhardt W., Els A., Rebhan J., Frank S., Beck K. F., Franzen R., Hamada F. M., Pfeilschifter J. 2002. Inhibition of cytokine-induced matrix metalloproteinase 9 expression by peroxisome proliferator-activated receptor alpha agonists is indirect and due to a NO-mediated reduction of mRNA stability. J. Biol. Chem. 277(36):33518–33528. doi: 10.1074/jbc.M202008200 [DOI] [PubMed] [Google Scholar]
- Elisha B., Disse E., Chabot K., Taleb N., Prud'Homme D., Bernard S., Rabasa-Lhoret R., Bastard J. P. 2017. Relative contribution of muscle and liver insulin resistance to dysglycemia in postmenopausal overweight and obese women: A MONET group study. Ann. Endocrinol. (Paris) 78(1):1–8. doi: 10.1016/j.ando.2016.10.003 [DOI] [PubMed] [Google Scholar]
- Fontanesi L., Bertolini F., Scotti E., Trevisi P., Buttazzoni L., Dall'Olio S., Davoli R., Bosi P., Russo V. 2012. Polymorphisms in an obesity-related gene (PCSK1) are associated with fat deposition and production traits in Italian heavy pigs. Animal 6(12):1913–1924. doi: 10.1017/S1751731112001280 [DOI] [PubMed] [Google Scholar]
- Ftouhi N., Day R., Mbikay M., Chrétien M., Seidah N. G. 1994. Gene organization of the mouse pro-hormone and pro-protein convertase PC1. DNA Cell Biol. 13(4):395–407. doi: 10.1089/dna.1994.13.395 [DOI] [PubMed] [Google Scholar]
- Gagnon J., Mayne J., Mbikay M., Woulfe J., Chrétien M. 2009. Expression of PCSK1 (PC1/3), PCSK2 (PC2) and PCSK3 (furin) in mouse small intestine. Regul. Pept. 152(1–3):54–60. doi: 10.1016/j.regpep.2008.07.006 [DOI] [PubMed] [Google Scholar]
- Guo L., Sun B., Shang Z., Leng L., Wang Y., Wang N., Li H. 2011. Comparison of adipose tissue cellularity in chicken lines divergently selected for fatness. Poult. Sci. 90(9):2024–2034. doi: 10.3382/ps.2010-00863 [DOI] [PubMed] [Google Scholar]
- Hager J., Dina C., Francke S., Dubois S., Houari M., Vatin V., Vaillant E., Lorentz N., Basdevant A., Clement K., Guy-Grand B., Froguel P. 1998. A genome-wide scan for human obesity genes reveals a major susceptibility locus on chromosome 10. Nat. Genet. 20(3):304–308. doi: 10.1038/3123 [DOI] [PubMed] [Google Scholar]
- Harvey S., Gineste C., Gaylinn B. D. 2014. Growth hormone (GH)-releasing activity of chicken GH-releasing hormone (GHRH) in chickens. Gen. Comp. Endocrinol. 204(8):261–266. doi: 10.1016/j.ygcen.2014.06.007 [DOI] [PubMed] [Google Scholar]
- Herbert A., Gerry N. P., McQueen M. B., Heid I. M., Pfeufer A., Illig T., Wichmann H. E., Meitinger T., Hunter D., Hu F. B. 2006. A common genetic variant is associated with adult and childhood obesity. Science 312(5771):279–283. doi: 10.1126/science.1124779 [DOI] [PubMed] [Google Scholar]
- Himly M., Foster D. N., Bottoli I., Iacovoni J. S., Vogt P. K. 1998. The DF-1 chicken fibroblast cell line: Transformation induced by diverse oncogenes and cell death resulting from infection by avian leukosis viruses. Virology 248(2):295–304. doi: 10.1006/viro.1998.9290 [DOI] [PubMed] [Google Scholar]
- Jackson R. S., Creemers J. W. M., Ohagi S., Raffin-Sanson M. L., Sanders L., Montague C. T., Hutton J. C., O'Rahilly S. 1997. Obesity and impaired prohormone processing associated with mutations in the human prohormone convertase 1 gene. Nat. Genet. 16(3):303–306. doi: 10.1038/ng0797-303 [DOI] [PubMed] [Google Scholar]
- Kamiyama M., Kobayashi M., Araki S., Iida A., Tsunoda T., Kawai K., Imanishi M., Nomura M., Babazono T., Iwamoto Y. 2007. Polymorphisms in the 3′ UTR in the neurocalcin delta gene affect mRNA stability, and confer susceptibility to diabetic nephropathy. Hum. Genet. 122(3–4):397–407. doi: 10.1007/s00439-007-0414-3 [DOI] [PubMed] [Google Scholar]
- Kilpeläinen T. O., Bingham S. A., Khaw K. T., Wareham N. J., Loos R. J. 2009. Association of variants in the PCSK1 gene with obesity in the EPIC-Norfolk study. Hum. Mol. Genet. 18(18):3496–3501. doi: 10.1093/hmg/ddp280 [DOI] [PMC free article] [PubMed] [Google Scholar]
- Kwok A. H., Wang Y., Wang C. Y., Leung F. C. 2008. Molecular cloning and characterization of chicken prostaglandin E receptor subtypes 2 and 4 (EP2 and EP4). Gen. Comp. Endocrinol. 157(2):99–106. doi: 10.1016/j.ygcen.2008.04.001 [DOI] [PubMed] [Google Scholar]
- Laguette M. J., Abrahams Y., Prince S., Collins M. 2011. Sequence variants within the 3′-UTR of the COL5A1 gene alters mRNA stability: Implications for musculoskeletal soft tissue injuries. Matrix Biol. 30(5–6):338–345. doi: 10.1016/j.matbio.2011.05.001 [DOI] [PubMed] [Google Scholar]
- Liu T., Zhao Y., Tang N., Feng R., Yang X., Lu N., Wen J., Li L. 2012. Pax6 directly down-regulates Pcsk1n expression thereby regulating PC1/3 dependent proinsulin processing. PLoS One 7(10):e46934. doi: 10.1371/journal.pone.0046934 [DOI] [PMC free article] [PubMed] [Google Scholar]
- Lloyd D. J., Bohan S., Gekakis N. 2006. Obesity, hyperphagia and increased metabolic efficiency in Pc1 mutant mice. Hum. Mol. Genet. 15(11):1884–1893. doi: 10.1093/hmg/ddl111 [DOI] [PubMed] [Google Scholar]
- Mannstadt M., Bertrand G., Muresan M., Weryha G., Leheup B., Pulusani S. R., Grandchamp B., Jüppner H., Silve C. 2008. Dominant-negative GCMB mutations cause an autosomal dominant form of hypoparathyroidism. J. Clin. Endocrinol. Metab. 93(9):3568–3576. doi: 10.1210/jc.2007-2167 [DOI] [PMC free article] [PubMed] [Google Scholar]
- Martín M. G., Lindberg I., Solorzanovargas R. S., Wang J., Avitzur Y., Bandsma R., Sokollik C., Lawrence S., Pickett L. A., Chen Z. 2013. Congenital proprotein convertase 1/3 deficiency causes malabsorptive diarrhea and other endocrinopathies in a pediatric cohort. Gastroenterology 145(1):138–148. doi: 10.1053/j.gastro.2013.03.048 [DOI] [PMC free article] [PubMed] [Google Scholar]
- Mbikay M., Croissandeau G., Sirois F., Anini Y., Mayne J., Seidah N. G., Chrétien M. 2007. A targeted deletion/insertion in the mouse Pcsk1 locus is associated with homozygous embryo preimplantation lethality, mutant allele preferential transmission and heterozygous female susceptibility to dietary fat. Dev. Biol. 306(2):584–598. doi: 10.1016/j.ydbio.2007.03.523 [DOI] [PubMed] [Google Scholar]
- Nagaraj S., Manjappara U. V. 2016. Studies on the influence of CCK-8 on the ability of obestatin to reduce food intake, gain in body weight and related lipid parameters. Biochimie 125:126–130. doi: 10.1016/j.biochi.2016.03.009 [DOI] [PubMed] [Google Scholar]
- Nilaweera K. N., Barrett P., Mercer J. G., Morgan P. J. 2003. Precursor-protein convertase 1 gene expression in the mouse hypothalamus: Differential regulation by ob gene mutation, energy deficit and administration of leptin, and coexpression with prepro-orexin. Neuroscience 119(3):713–720. doi: 10.1016/S0306-4522(02)00869-2 [DOI] [PubMed] [Google Scholar]
- NRC 1994. Nutrient Requirements of Poultry. 9th rev. ed. Natl. Acad. Press, Washington, DC. [Google Scholar]
- Prabhu Y., Blanco E. H., Liu M., Peinado J. R., Wheeler M. C., Gekakis N., Arvan P., Lindberg I. 2014. Defective transport of the obesity mutant PC1/3 N222D contributes to loss of function. Endocrinology 155(7):2391–2401. doi: 10.1210/en.2013-1985 [DOI] [PMC free article] [PubMed] [Google Scholar]
- Raffin-Sanson M. L., de Keyzer Y., Bertagna X. 2003. Proopiomelanocortin, a polypeptide precursor with multiple functions: From physiology to pathological conditions. Eur. J. Endocrinol. 149(2):79–90. doi: 10.1530/eje.0.1490079 [DOI] [PubMed] [Google Scholar]
- Rehfeld J. F., Bundgaard J. R., Hannibal J., Zhu X., Norrbom C., Steiner D. F., Friis-Hansen L. 2008. The cell-specific pattern of cholecystokinin peptides in endocrine cells versus neurons is governed by the expression of prohormone convertases 1/3, 2, and 5/6. Endocrinology 149(4):1600–1608. doi: 10.1210/en.2007-0278 [DOI] [PMC free article] [PubMed] [Google Scholar]
- Schiavo G., Galimberti G., Calò D. G., Samorè A. B., Bertolini F., Russo V., Gallo M., Buttazzoni L., Fontanesi L. 2016. Twenty years of artificial directional selection have shaped the genome of the Italian Large White pig breed. Anim. Genet. 47(2):181–191. doi: 10.1111/age.12392 [DOI] [PubMed] [Google Scholar]
- Seidah N. G., Hamelin J., Gaspar A. M., Day R., Chrétien M. 1992. The cDNA sequence of the human pro-hormone and pro-protein convertase PC1. DNA Cell Biol. 11(4):283–289. doi: 10.1089/dna.1992.11.283 [DOI] [PubMed] [Google Scholar]
- Seidah N. G., Prat A. 2012. The biology and therapeutic targeting of the proprotein convertases. Nat. Rev. Drug Discov. 11(5):367–383. doi: 10.1038/nrd3699 [DOI] [PubMed] [Google Scholar]
- Souza G. F., Solon C., Nascimento L. F., Delimajunior J. C., Nogueira G., Moura R., Rocha G. Z., Fioravante M., Bobbo V., Morari J. 2016. Defective regulation of POMC precedes hypothalamic inflammation in diet-induced obesity. Sci. Rep. 6:29290. doi: 10.1038/srep29290 [DOI] [PMC free article] [PubMed] [Google Scholar]
- Suhl J. A., Muddashetty R. S., Anderson B. R., Ifrim M. F., Visootsak J., Bassell G. J., Warren S. T. 2015. A 3′ untranslated region variant in FMR1 eliminates neuronal activity-dependent translation of FMRP by disrupting binding of the RNA-binding protein HuR. Proc. Natl. Acad. Sci. USA 112(47):E6553–E6561. doi: 10.1073/pnas.1514260112 [DOI] [PMC free article] [PubMed] [Google Scholar]
- Tachibana T., Sugimoto I., Ogino M., Khan M. S. I., Masuda K., Ukena K., Wang Y. 2015. Central administration of chicken growth hormone-releasing hormone decreases food intake in chicks. Physiol. Behav. 139:195–201. doi: 10.1016/j.physbeh.2014.11.043 [DOI] [PubMed] [Google Scholar]
- ten Kulve J. S., Veltman D. J., Van B. L., Groot P. F., Ruhé H. G., Barkhof F., Diamant M., Ijzerman R. G. 2016. Endogenous GLP-1 and GLP-1 analogue alter CNS responses to palatable food consumption. J. Endocrinol. 229(1):1–12. doi: 10.1530/JOE-15-0461 [DOI] [PubMed] [Google Scholar]
- Venables W. N., Ripley B. D. 2002. Modern applied statistics with S. Springer, New York, NY. doi: 10.1007/978-0-387-21706-2 [DOI] [Google Scholar]
- Wang J., Pitarque M., Ingelman-Sundberg M. 2006. 3′-UTR polymorphism in the human CYP2A6 gene affects mRNA stability and enzyme expression. Biochem. Biophys. Res. Commun. 340(2):491–497. doi: 10.1016/j.bbrc.2005.12.035 [DOI] [PubMed] [Google Scholar]
- Wang J., Zhang C., Zhang Z., Zheng Z., Sun D., Quan Y., Hadadi C., Li D., Xu X., Xiong M. 2016a. A functional variant rs6435156C > T in BMPR2 is associated with increased risk of chronic obstructive pulmonary disease (COPD) in Southern Chinese population. EBioMedicine 5:167–174. doi: 10.1016/j.ebiom.2016.02.004 [DOI] [PMC free article] [PubMed] [Google Scholar]
- Wang Y., Du X., Zhou Z., Jiang J., Zhang Z., Ye L., Hong H. 2016b. A gain-of-function ACTC1 3′UTR mutation that introduces a miR-139-5p target site may be associated with a dominant familial atrial septal defect. Sci. Rep. 6:25404. doi: 10.1038/srep25404 [DOI] [PMC free article] [PubMed] [Google Scholar]
- Wang Y. S., Ouyang W., Pan Q. X., Wang X. L., Xia X. X., Bi Z. W., Wang Y. Q., Wang X. M. 2013. Overexpression of microRNA gga-miR-21 in chicken fibroblasts suppresses replication of infectious bursal disease virus through inhibiting VP1 translation. Antiviral Res. 100(1):196–201. doi: 10.1016/j.antiviral.2013.08.001 [DOI] [PubMed] [Google Scholar]
- Werk A. N., Bruckmueller H., Haenisch S., Cascorbi I. 2014. Genetic variants may play an important role in mRNA-miRNA interaction: Evidence for haplotype-dependent downregulation of ABCC2 (MRP2) by miRNA-379. Pharmacogenet. Genomics 24(6):283–291. doi: 10.1097/FPC.0000000000000046 [DOI] [PubMed] [Google Scholar]
- Yang Y., Hua Q.-x., Liu J., Shimizu E. H., Choquette M. H., Mackin R. B., Weiss M. A. 2010. Solution structure of proinsulin: Connecting domain flexibility and prohormone processing. J. Biol. Chem. 285(11):7847–7851. doi: 10.1074/jbc.C109.084921 [DOI] [PMC free article] [PubMed] [Google Scholar]
- Zhang H., Hu X., Wang Z., Zhang Y., Wang S., Wang N., Ma L., Leng L., Wang S., Wang Q. 2012. Selection signature analysis implicates the PC1/PCSK1 region for chicken abdominal fat content. PLoS One 7(7):e40736. doi: 10.1371/journal.pone.0040736 [DOI] [PMC free article] [PubMed] [Google Scholar]
- Zhang H., Zhang Y. D., Wang S. Z., Liu X. F., Zhang Q., Tang Z. Q., Li H. 2010. Detection and fine mapping of quantitative trait loci for bone traits on chicken chromosome one. J. Anim. Breed. Genet. 127(6):462–468. doi: 10.1111/j.1439-0388.2010.00871.x [DOI] [PubMed] [Google Scholar]
- Zhang L., Liu Y., Song F., Zheng H., Hu L., Lu H., Liu P., Hao X., Zhang W., Chen K. 2011. Functional SNP in the microRNA-367 binding site in the 3′UTR of the calcium channel ryanodine receptor gene 3 (RYR3) affects breast cancer risk and calcification. Proc. Natl. Acad. Sci. USA 108(33):13653–13658. doi: 10.1073/pnas.1103360108 [DOI] [PMC free article] [PubMed] [Google Scholar]
- Zhu X., Zhou A., Dey A., Norrbom C., Carroll R., Zhang C., Laurent V., Lindberg I., Ugleholdt R., Holst J. J. 2002. Disruption of PC1/3 expression in mice causes dwarfism and multiple neuroendocrine peptide processing defects. Proc. Natl. Acad. Sci. USA 99(16):10293–10298. [DOI] [PMC free article] [PubMed] [Google Scholar]