

Abstract
Objective(s):
The aim of this study is to examine the effect of different smoothing filters on the image quality and SUVmax to achieve the guideline recommended positron emission tomography (PET) image without harmonization.
Methods:
We used a Biograph mCT PET scanner. A National Electrical Manufacturers Association (NEMA) the International Electrotechnical Commission (IEC) body phantom was filled with 18F solution with a background activity of 2.65 kBq/mL and a sphere-to-background ratio of 4. PET images obtained with the Biograph mCT PET scanner were reconstructed using the ordered subsets-expectation maximization (OSEM) algorithm with time-of-flight (TOF) models (iteration, 2; subset, 21); smoothing filters including the Gaussian, Butterworth, Hamming, Hann, Parzen, and Shepp-Logan filters with various full width at half maximum (FWHM) values (1-15 mm) were applied. The image quality was physically assessed according to the percent contrast (QH,10), background variability (N10), standardized uptake value (SUV), and recovery coefficient (RC). The results were compared with the guideline recommended range proposed by the Japanese Society of Nuclear Medicine and the Japanese Society of Nuclear Medicine Technology. The PET digital phantom was developed from the digital reference object (DRO) of the NEMA IEC body phantom smoothed using a Gaussian filter with a 10-mm FWHM and defined as the reference image. The difference in the SUV between the PET image and the reference image was evaluated according to the root mean squared error (RMSE).
Results:
The FWHMs of the Gaussian, Butterworth, Hamming, Hann, Parzen, and Shepp-Logan filters that satisfied the image quality of the FDG-PET/CT standardization guideline criteria were 8-12 mm, 9-11 mm, 9-13 mm, 10-13 mm, 9-11 mm, and 12-15 mm, respectively. The FWHMs of the Gaussian, Butterworth, Hamming, Hann, Parzen, and Shepp-Logan filters that provided the smallest RMSE between the PET images and the 3D digital phantom were 7 mm, 8 mm, 8 mm, 8 mm, 7 mm, and 11 mm, respectively.
Conclusion:
The suitable FWHM for image quality or SUVmax depends on the type of smoothing filter that is applied.
Keywords: FDG PET, Smoothing filter, SUV
Introduction
18F-2-fluoro-2-deoxy-D-glucose (18F-FDG) positron emission tomography/computed tomography (PET/CT) is widely used for the diagnosis and staging of various malignancies and is a valuable tool for the assessment of the response to therapy (1-5). The standardized uptake value (SUV), which is a semi-quantitative metric of FDG-PET, is thought to be helpful for diagnoses, prognostic stratification, and therapy monitoring. Because SUV assesses metabolic information, it could be a better biomarker for treatment responses than anatomical morphological information (6-9).
SUV is the standard semi-quantitative measure derived from whole-body FDG PET/CT examinations; therefore, repeatability and reproducibility are required for it to be used as a biomarker. The advancement of PET/CT scanners has resulted in wide variations in their basic performance. There are considerable differences in SUV due to the PET scanner characteristics, acquisition settings, reconstruction algorithms, and settings (10, 11). Different examination protocols are another cause of SUV variation. Different data acquisition and processing protocols result in variations in the SUV measurements (10-13). Several academic societies have published FDG-PET examination guidelines for standardization (14, 15). However, variations in SUV still exist. For example, a point spread function (PSF) algorithm can improve the spatial resolution even though it causes edge artifacts as an overshoot (16).
The concept of harmonization was developed to directly compare the SUV values between different institutions and devices. As part of harmonizing the PET/CT performance, several organizations, including the American College of Radiology, the Society of Nuclear Medicine Clinical Trials Network (SNM-CTN), and the European Association of Nuclear Medicine (EANM), have set up PET/CT validation procedures as part of site accreditation for multicenter studies. The representative harmonization is to adjust the RC of each PET scanner into the reference RC range using an additional Gaussian filter (GF). FDG-PET harmonization is reported to minimize the variation in SUV measurements via scan acquisition and processing (17, 18). Although the application of GF on reconstructed image file is used as harmonization, the smoothing filter used in the reconstruction process is considered to result the similar effect. However, there are few studies demonstrating the characteristics of different smoothing filters on the image quality and the SUVmax.
The purpose of this study was to evaluate the effect of different smoothing filters on the FDG-PET images. We evaluated the image quality and the SUVmax in comparison to the standard PET imaging protocols and phantom test procedures and criteria proposed Japanese Society of Nuclear Medicine (JSNM).
Methods
NEMA IEC Body Phantom
The NEMA IEC body phantom (Data Spectrum Corp., Hillsborough, NC), consisting of a quasicylindrical cavity (280×210×180 mm) with six spheres (Model ECT/IEC -BODY/P), was used for this study. The spheres were 10, 13, 17, 22, 28, and 37 mm in diameter, with a wall thickness of 1 mm. All of the spheres were filled with 10.6 kBq/mL of 18F-FDG, and the background was filled with 2.65 kBq/mL of 18F-FDG to obtain a sphere-to-background ratio of 4. The radioactivities of three 1.0 mL samples of both hot spheres and the background 18F-FDG were prepared for measurement using a well counter of the AccuFLEX γ7001 (Hitachi, Ltd., Tokyo, Japan). The radioactivity of 18F-FDG was corrected for decay with the 18F half-life of 109 min.
PET/CT Scanner
The PET/CT data were acquired using a Biograph mCT (Siemens Healthineers, Erlangen, Germany). This PET scanner has three rings each containing 144 lutetium orthosilicate of 4×4×20 mm. The axial field of view (FOV) was 16.2 cm, and the transaxial FOV was 70 cm in diameter. The coincidence time window was 4.1 ns, and the spatial resolutions at 1 cm and 10 cm were 4.4 mm and 4.9 mm full width at half maximum (FWHM), respectively. The system sensitivities when the line source was at 0 cm and 10 cm from the center of the FOV were 0.96% and 0.94%, respectively.
Digital phantom
The PET digital phantom developed from the PET digital reference object (DRO) is based on a modified version of the NEMA Image Quality Phantom. The NEMA phantom and the digital object were mathematically developed as an ideal object with a uniform background region that is 20 cm in the transaxial simulated human abdominal cross section with an SUV of 1.00. There are six spheres, whose diameters are 10, 13, 17, 22, 28, and 37 mm with an SUV of 4.00 and a central 5 cm diameter cylinder with an SUV of 0.00 (19). DRO was applied a 3-D GF to simulate the PET image with relatively decreased spatial resolution. The RC of DRO was included in the JSNM reference range with a GF of 10-13 mm FWHM, and the highest RC was obtained with a 10 mm FWHM of GF. DRO10mm was adopted as reference SUV for the evaluation.
Data acquisition and processing
The emission data were acquired for 3 min for the evaluation of the image quality and for 30 min to determine the parameters for the evaluation of the SUVmax. The PET images were reconstructed using 3D ordered subsets-expectation maximization (OSEM) with a time-of-flight (TOF) algorithm with CT attenuation correction. PSF correction was not used for the reconstruction. The reconstruction parameters were as follows: a pixel size of 3.18×3.18 mm; 2 iterations; 21 subsets; and a slice thickness of 5.0 mm. The CT scanning parameters were as follows: 120 kV, 100 mAs (Eff.mAs), a 512×512 matrix, 32-slices, a slice thickness of 3.0 mm, and a 500-mm transaxial FOV.
Six smoothing filters including the Gaussian, Butterworth, Hamming, Hann, Parzen, and Shepp-Logan filters were applied (Table 1). The GF was used to smooth the image with a Gaussian function. With a pixel size of Δx in mm, the filter width is 2b+1 pixels with
Table 1.
The definition of each smoothing filters including Gaussian, Butterworth, Hamming, Hann, Parzen and Shepp-Logan filters.
| Smoothing filter | The definition | |
|---|---|---|
| Gaussian |  |
(1) |
| Butterworth |  |
(2) |
| Hamming |  |
(3) |
| Hann |  |
(4) |
| Parzen |  |
(5) |
| Shepp-Logan |  |
(6) |

The filter was symmetrical and was calculated using equation (1). The filter width given in the FWHM needs to be converted into the cut-off frequency fc. The cut-off frequency is a fraction of the Nyquist frequency, which is defined as half of the sampling frequency , where Δx is the sampling distance in mm. The Butterworth filter is defined by equation (2) with a frequency ω and a filter order o. The Hamming filter is defined by equation (3) with a frequency ω. The Hann filter is defined by equation (4) with a frequency ω. The Parzen filter is defined by equation (5) with a frequency ω. The Shepp-Logan filter is defined by equation (6) with the frequency ω. The FWHM of the smoothing filters ranged from 1 mm to 15 mm, the order of the Butterworth filter was 1.0.
Analysis of the Image quality
The region of interest (ROI) for a 10-mm sphere was a circular ROI with a diameter of 10 mm placed on the cross section through the center of the sphere. We placed twelve 10-mm circular ROIs for the background on five slices. We also placed a volume of interest for all hot spheres equal to each sphere’s inner diameter. The PET images were analyzed using QH,10mm for percent contrast, N10mm for the background variability, and SUV as the standardized uptake value.
These parameters were calculated using the following equations:

where CH,10mm is the average count in the ROI for a 10-mm sphere, CB,10mm is the average count of the 60 background ROIs, aH and aB are the true radioactivity concentrations in the hot sphere and background, respectively. SD10mm is the standard deviation of the 60 background ROIs, A is the measured activity in ROI (Bq/mL), D is the injected dose (Bq), and W is the body weight (g).
The image quality was evaluated and compared with the reference value in the “Japanese Guideline for Oncology FDG PET/CT Data Acquisition Protocol: Synopsis of Version 2.0” published by the JSNM and the Japanese Society of Nuclear Medicine Technology (JSNMT) (20). The guideline recommended N10mm<5.6 (%) as a background noise level and QH,10mm / N10mm >2.8 (%) as a contrast noise ratio to obtain standardized PET image. SUVmax was plotted as a function of the sphere diameter and compared to the reference range proposed by JSNM. The reference ranges of the lower-upper limits of SUVmax on the 10, 17, 22, 28, and 37-mm hot spheres are 1.19-2.00, 1.52-3.04, 2.58-3.71, 3.25-4.09, 3.56-4.21 and 3.82-4.17, respectively (Figure 1).
Figure 1.
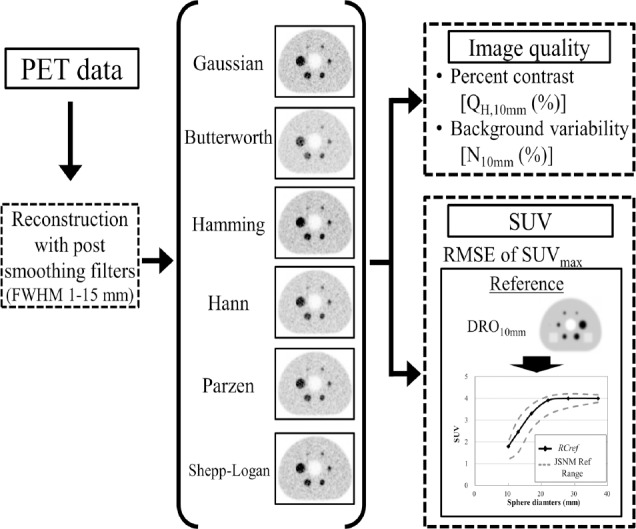
Flow chart for the evaluation of the image quality and harmonization for different smoothing filters and FWHMs.
Analysis of the SUVmax
To evaluate the SUVmax, we defined the SUV of the digital body phantom as the reference SUV (SUVrefj: j=sphere diameter) and the SUV of the PET scanner as the target SUV (SUVj). We used the root mean squared error (RMSE) of the SUV to evaluate the difference between the target and the reference SUV (Figure 2).
Figure 2.

PET images of the NEMA IEC Body phantom using different smoothing filters and FWHMs.

Results
PET images
Figure 2 shows the PET images of the NEMA phantom using different filters and the FHWM. With increasing of FWHM, the images became blurred and the noise decreased for all smoothing filters. However, the influence of the FWHM on the smoothing differed between filters.
Image quality
Figure 3 shows the effect of the smoothing filters on the image quality in relation to FWHM. For all smoothing filters, N10mm decreased with increasing of FWHM. However, the effect of the FWHM on the image quality varied in relation to the type of smoothing filter (Figure 3a). The FWHM that satisfied the recommended values proposed by the FDG-PET/CT standardization guideline criteria (N10mm<5.6 (%) and QH,10mm/N10mm >2.8 (%)) and supplied the maximum QH,10 mm/N10 mm differed between the smoothing filters (Figure 3a and 3b). The FWHMs of the Gaussian, Butterworth, Hamming, Hann, Parzen, and Shepp-Logan filters that satisfied the image quality of the FDG-PET/CT standardization guideline criteria were 8-12 mm, 9-11 mm, 9-13 mm, 10-13 mm, 9-11 mm, and 12-15 mm, respectively (Table 2).
Figure 3.

The image quality in relation to the different smoothing filters and FWHMs: (a) background variability; (b) Contrast noise ratio.
Table 2.
The recommended FWHM of smoothing filters determined by imaging quality and the SUVmax.
| Gaussian | Butterworth | Hamming | Hann | Parzen | Shepp-Logan | ||
|---|---|---|---|---|---|---|---|
| Image quality | N10mm < 5.6 | > 8 | > 9 | > 9 | > 10 | > 9 | > 12 |
| QH,10mm / N10mm > 2.8 | 8-12 | 9-11 | 9-13 | 10-13 | 9-11 | 12-15 | |
| SUVmax | JSNM Ref Range | 6-10 | 7-10 | 7-11 | 7-12 | 7-10 | 9-15 |
| The smallest RMSE | 7 | 8 | 8 | 8 | 7 | 11 | |
SUVmax
Figure 4 shows SUVmax in relation to the sphere diameters according to the different FWHMs of the smoothing filters. For all the smoothing filters, SUV decreased with increasing of FWHM. However, the influence of the FWHM on SUVmax differed between the smoothing filters. The FWHMs that permitted SUVmax to be included in the JSNM reference range differed between the smoothing filters, and the FWHM ranges of the Gaussian, Butterworth, Hamming, Hann, Parzen, and Shepp-Logan filters were 6-10 mm, 7-10 mm, 7-11 mm, 7-12 mm, 7-10 mm, and 9-15 mm, respectively (Table 2).
Figure 4.

Recovery coefficients in relation to the different smoothing filters and FWHMs.
Figure 5 shows the RMSE of the six smoothing filters in relation to the FWHM. The FWHM that provided the smallest RMSE differed between the smoothing filters. The FWHM values of the Gaussian, Butterworth, Hamming, Hann, Parzen, and Shepp-Logan filters that provided the smallest RMSE were 7 mm, 8 mm, 8 mm, 8 mm, 7 mm, and 11 mm, respectively (Table 2). Figure 6 shows the relationship between the amplitude and the frequency for the frequency domain filters created from the equation (2-6). The Parzen filter showed the highest smoothing followed by the Hann, Hamming, Butterworth, and Shepp-Logan filters.
Figure 5.

RMSE between the PET images with different smoothing filters and the digital phantom.
Figure 6.

Frequency amplitude in relation to the frequency of the different smoothing filters.
Discussion
We examined the effect of six smoothing filters on the image quality and the SUVmax of FDG-PET images. The effect on both the image quality and SUVmax differed between the different smoothing filters. The suitable FWHM to obtain adequate image quality and SUVmax depends on the type of smoothing filter.
Both the percent contrast and the background variability decreased with increasing of FWHM for all smoothing filters. However, the relationship between the percent contrast and the background variability is similar for the different smoothing filters. Tong et al. evaluated the noise and signal properties for different combinations of reconstruction methods and parameters including no-filter, 4, 7, and 10-mm GF. They reported that the background variability and contrast recovery decreased with increasing post-filtering (21). Alessio et al. evaluated the image quality and noise resolution for different smoothing parameters of PET images. They reported that the post-reconstruction filter varied changing the noise/bias tradeoff (22).
In this study, SUV decreased with the increasing FWHM, irrespective of the type of smoothing filter. Westerterp et al. evaluated the effect of the image reconstruction, resolution, and ROI definition parameters for the FDG-PET quantification. They also reported that SUV decreased with the increasing of FWHM of the post-filter using GF of 5, 7, and 9-mm FWHM (11). However, the degree of SUV change in relation to the FWHM was dependent on the type of smoothing filter.
The suitable FWHM of the GF for SUVmax was 7.0 mm in our study. The EANM guideline reported that spatial filters applied during or after reconstruction should not exceed a FWHM of 7 mm (14). Saha reported that the largest amount of smoothing is provided by the Parzen filter, while the Shepp-Logan filter produces the least smoothing (23). In this study, the FWHMs of the Butterworth, Hamming, Hann, Parzen, and Shepp-Logan filters that provided the smallest RMSE between the SUVs of the PET image and the digital phantom were 8 mm, 8 mm, 8 mm, 7 mm, and 11 mm, respectively. To adjust the RC for same reference RC, a high smoothing filter requires a small FWHM and a low smoothing filter requires a large FWHM. Regarding all smoothing filters, the suitable FWHM varied between filters. The FWHM functions differently in each filter due to differences in the characteristics of the frequency. It is necessary to determine the suitable FWHM for each filter.
This study has some limitations. First, the digital phantom, which was developed from a CT image of an NEMA body phantom obtained with a GF with a 10-mm FWHM, was defined as the reference for the SUVmax. It is thought that the suitable FWHM of the smoothing filter may vary for other references of SUVmax. Second, the PET images were reconstructed using 3D OSEM with a TOF algorithm without PSF correction. The suitable FWHM for SUVmax may vary due to the reconstruction parameters. Finally, we evaluated SUV relation to the different smoothing filters using only SUVmax, therefore further examination is required to examine the SUVpeak and SUVmean.
Conclusion
The suitable FWHM for image quality or SUVmax depends on the smoothing filter. Each smoothing filter could provide SUVmax that satisfy the JSNM reference range with its own suitable FWHM.
Acknowledgements
The authors thank the staff of the Division of Radiology Department of Medical Technology at Kyushu University Hospital their valuable support.
Conflicts of interest
No potential conflicts of interest were disclosed.
References
- 1.Fletcher JW, Djulbegovic B, Soares HP, Siegel BA, Lowe VJ, Lyman GH, et al. Recommendations on the use of 18F-FDG PET in oncology. J Nucl Med. 2008;49(3):480–508. doi: 10.2967/jnumed.107.047787. [DOI] [PubMed] [Google Scholar]
- 2.Ben-Haim S, Ell P. 18F-FDG PET and PET/CT in the evaluation of cancer treatment response. J Nucl Med. 2009;50(1):88–99. doi: 10.2967/jnumed.108.054205. [DOI] [PubMed] [Google Scholar]
- 3.Gupta T, Master Z, Kannan S, Agarwal JP, Ghsoh-Laskar S, Rangarajan V, et al. Diagnostic performance of post-treatment FDG PET or FDG PET/CT imaging in head and neck cancer: a systematic review and meta-analysis. Eur J Nucl Med Mol Imaging. 2011;38(11):2083–95. doi: 10.1007/s00259-011-1893-y. [DOI] [PubMed] [Google Scholar]
- 4.Bengtsson T, Hicks RJ, Peterson A, Port RE. 18F-FDG PET as a surrogate biomarker in non-small cell lung cancer treated with erlotinib: newly identified lesions are more informative than standardized uptake value. J Nucl Med. 2012;53(4):530–7. doi: 10.2967/jnumed.111.092544. [DOI] [PubMed] [Google Scholar]
- 5.Hicks RJ. Role of 18F-FDG PET in assessment of response in non-small cell lung cancer. J Nucl Med. 2009;50(Suppl 1):31S–42S. doi: 10.2967/jnumed.108.057216. [DOI] [PubMed] [Google Scholar]
- 6.Hellwig D, Graeter TP, Ukena D, Groeschel A, Sybrecht GW, Schaefers HJ, et al. 18F-FDG PET for mediastinal staging of lung cancer: which SUV threshold makes sense? J Nucl Med. 2007;48(11):1761–6. doi: 10.2967/jnumed.107.044362. [DOI] [PubMed] [Google Scholar]
- 7.Dijkman BG, Schuurbiers OC, Vriens D, Looijen-Salamon M, Bussink J, Timmer-Bonte JN, et al. The role of (18)F-FDG PET in the differentiation between lung metastases and synchronous second primary lung tumours. Eur J Nucl Med Mol Imaging. 2010;37(11):2037–47. doi: 10.1007/s00259-010-1505-2. [DOI] [PMC free article] [PubMed] [Google Scholar]
- 8.Agarwal M, Brahmanday G, Bajaj SK, Ravikrishnan KP, Wong CY. Revisiting the prognostic value of preoperative (18)F-fluoro- 2-deoxyglucose ((18)F-FDG) positron emission tomography (PET) in early-stage (I &II) non-small cell lung cancers (NSCLC) Eur J Nucl Med Mol Imaging. 2010;37(4):691–8. doi: 10.1007/s00259-009-1291-x. [DOI] [PMC free article] [PubMed] [Google Scholar]
- 9.Liao S, Penney BC, Wroblewski K, Zhang H, Simon CA, Kampalath R, et al. Prognostic value of metabolic tumor burden on 18F-FDG PET in nonsurgical patients with non-small cell lung cancer. Eur J Nucl Med Mol Imaging. 2012;39(1):27–38. doi: 10.1007/s00259-011-1934-6. [DOI] [PubMed] [Google Scholar]
- 10.Boellaard R, Krak NC, Hoekstra OS, Lammertsma AA. Effects of noise, image resolution, and ROI definition on the accuracy of standard uptake values: a simulation study. J Nucl Med. 2004;45(9):1519–27. [PubMed] [Google Scholar]
- 11.Westerterp M, Pruim J, Oyen W, Hoekstra O, Paans A, Visser E, et al. Quantification of FDG PET studies using standardised uptake values in multi-centre trials: effects of image reconstruction, resolution and ROI definition parameters. Eur J Nucl Med Mol Imaging. 2007;34(3):392–404. doi: 10.1007/s00259-006-0224-1. [DOI] [PubMed] [Google Scholar]
- 12.Sunderland JJ, Christian PE. Quantitative PET/CT scanner performance characterization based upon the society of nuclear medicine and molecular imaging clinical trials network oncology clinical simulator phantom. J Nucl Med. 2015;56(1):145–52. doi: 10.2967/jnumed.114.148056. [DOI] [PubMed] [Google Scholar]
- 13.Lasnon C, Desmonts C, Quak E, Gervais R, Do P, Dubos-Arvis C, et al. Harmonizing SUVs in multicentre trials when using different generation PET systems: prospective validation in non-small cell lung cancer patients. Eur J Nucl Med Mol Imaging. 2013;40(7):985–96. doi: 10.1007/s00259-013-2391-1. [DOI] [PMC free article] [PubMed] [Google Scholar]
- 14.Boellaard R, Delgado-Bolton R, Oyen WJ, Giammarile F, Tatsch K, Eschner W, et al. FDG PET/CT: EANM procedure guideline for tumor imaging: version 2.0. Eur J Nucl Med Mol Imaging. 2015;42(2):328–54. doi: 10.1007/s00259-014-2961-x. [DOI] [PMC free article] [PubMed] [Google Scholar]
- 15.Fukukita H, Suzuki K, Matsumoto K, Terauchi T, Daisaki H, Ikari Y, et al. Japanese guideline for the oncology FDG-PET/CT data acquisition protocol: synopsis of Version 2.0. Ann Nucl Med. 2014;28(7):693–705. doi: 10.1007/s12149-014-0849-2. [DOI] [PMC free article] [PubMed] [Google Scholar]
- 16.Rahmima A, Qi J, Sossi V. Resolution modeling in PET imaging: Theory, practice, benefits, and pitfalls. Med Phys. 2013;40(6):064301. doi: 10.1118/1.4800806. [DOI] [PMC free article] [PubMed] [Google Scholar]
- 17.Quak E, Le Roux PY, Hofman MS, Robin P, Bourhis D, Callahan J, et al. Harmonizing FDG PET quantification while maintaining optimal lesion detection: prospective multicentre validation in 517 oncology patients. Eur J Nucl Med Mol Imaging. 2015;42(13):2072–82. doi: 10.1007/s00259-015-3128-0. [DOI] [PMC free article] [PubMed] [Google Scholar]
- 18.Makris NE, Huisman MC, Kinahan PE, Lammertsma AA, Boellaard R. Evaluation of strategies towards harmonization of FDG PET/CT studies in multicenter trials: comparison of scanner validation phantoms and data analysis procedures. Eur J Nucl Med Mol Imaging. 2013;40(10):1507–15. doi: 10.1007/s00259-013-2465-0. [DOI] [PMC free article] [PubMed] [Google Scholar]
- 19.Quantitative imaging biomarker alliance. QIBA Profile. FDG-PET/CT for Response to Cancer Therapy. [Accessed 28 July 2017]. Available at: URL: http://qibawikirsnaorg/images/1/1f/QIBA_FDG-PET_Profile_v113pdf .
- 20.Standard PE. Imaging protocols and phantom test procedures and criteria: executive summary. Japan: Japanese Society of Nuclear Medicine Website; 2016. [Google Scholar]
- 21.Tong S, Alessio AM, Kinahan PE. Noise and signal properties in PSF-based fully 3D PET image reconstruction: an experimental evaluation. Phys Med Biol. 2010;55(5):1453–73. doi: 10.1088/0031-9155/55/5/013. [DOI] [PMC free article] [PubMed] [Google Scholar]
- 22.Alessio A, Kinahan P. PET image reconstruction. Nucl Med. 2006;1:1–22. [Google Scholar]
- 23.Saha GB. Basics of PET imaging physics, chemistry, and regulations. New York: Springer; 2014. [Google Scholar]