

Abstract
Objective:
T-peak–T-end (TPE) interval, which represents the dispersion of repolarization, is defined as the interval between the peak and end of the T-wave, and is associated with increased malignant ventricular arrhythmia and sudden cardiac death (SCD) in patients with ST elevation myocardial infarction (STEMI). Although prolonged TPE interval is associated with poor short- and long-term outcomes, even in patients with STEMI treated with successful primary percutaneous coronary intervention (pPCI), clinical, angiographic, and laboratory parameters that affect TPE remain to be elucidated. The aim of our study was to evaluate the potential relationship between prolonged TPE interval and reperfusion success using ST segment resolution (STR) in patients with STEMI undergoing pPCI.
Methods:
In the current study, 218 consecutive patients with STEMI who underwent pPCI were enrolled; after exclusion, 164 patients were included in the study population.
Results:
Patients were divided into two groups according to the presence of complete (STR%≥70) or incomplete (STR%<70) STR. Preprocedural corrected TPE (cTPEPRE;116±21 ms vs. 108±21 ms; p=0.027), postprocedural TPE (TPEPOST; 107±16 ms vs. 92±21 ms; p<0.001), and postprocedural cTPE (cTPEPOST; 119±19 ms vs. 102±17 ms; p<0.001) intervals were significantly longer in patients with incomplete STR than in patients with complete STR, whereas there was no statistically significant difference between the two groups in terms of pre- and postprocedural and corrected QT intervals. cTPEPRE and cTPEPOST were found to be independent predictors for incomplete STR.
Conclusion:
To our knowledge, this is the first study that evaluated the relationship between TPE interval and no-reflow defined by STR in patients with STEMI who were treated with pPCI.
Keywords: ST elevation myocardial infarction, reperfusion, no-reflow, T-peak–T-end interval
Introduction
T-peak–T-end (TPE) interval, which is defined as the interval between the peak and end of the T-wave, represents the dispersion of repolarization. Abnormal repolarization and prolonged TPE interval are associated with increased malignant ventricular arrhythmia and sudden cardiac death (SCD) in many acquired and congenital cardiac diseases (1, 2). Recently, the relationship between prolonged TPE interval and worse short- and long-term outcomes in patients with STEMI has been established (3-5). Although prolonged TPE interval has been shown to be associated with poor short- and long-term outcomes, even in patients with ST elevation myocardial infarction (STEMI) who are treated with successful primary percutaneous coronary intervention (pPCI), clinical, angiographic, and laboratory parameters that affect the TPE interval remain unclear.
Coronary no-reflow (NR) is defined as imperfect myocardial perfusion despite successful restoration of epicardial coronary flow (6), and is associated with larger myocardial infarct size, lower left ventricular ejection fraction, adverse left ventricular remodeling, increased mechanical complications, heart failure, and death (7-9). NR has been reported in up to 60% of patients with STEMI, and its incidence varies according to the diagnostic method, such as thrombolysis in myocardial infarction (TIMI) grade, corrected TIMI frame count, myocardial blush grade (MBG), and ST segment resolution (STR) (10-18). Despite prolonged TPE interval and NR being associated with poor prognosis in patients with STEMI, no study has investigated the possible relationship between TPE interval and NR using STR. In the present study, we aimed to investigate the relationship between TPE interval and coronary NR using STR in patients with STEMI treated with pPCI.
Methods
Study population
A total of 218 consecutive patients with STEMI who underwent pPCI between January 2014 and January 2015 were enrolled in this cross-sectional study. STEMI was defined based on the following criteria: ongoing ischemic symptoms (within 12 h); typical rise or fall in cardiac biomarker levels; new ST elevation in ≥2 contiguous leads, with leads V1, V2, and V3 measuring at least 0.2 mV or remaining leads measuring at least 0.1 mV; or newly developed left bundle branch block pattern (19). Patients with a previous history of MI and structural heart disease (26 patients), inappropriate electrocardiogram (ECG) due to poor image quality, bundle branch block, second- and third-degree AV block, QRS duration (QRSD) of >120 ms (17 patients), and inconclusive clinical data from hospital files and computer records (11 patients) were excluded from the study. Thus, 164 patients constituted the study population. Using hospital records, the patients’ baseline clinical and demographic characteristics and past history, including hypertension (HT), diabetes mellitus (DM), CAD, family history of CAD, dyslipidemia, and smoking status were obtained. The study protocol was reviewed and approved by the local Ethics Committee of our university in accordance with the Declaration of Helsinki.
ECG analysis
A digital 12-lead ECG recorded at a speed of 25 mm/s and voltage of 10 mm/mV was obtained for all patients at admission (preprocedural ECG) and 60 min after pPCI (postprocedural ECG). All ECGs were scanned, loaded on a computer, sufficiently magnified, and analyzed with a digital image processing software (imagej.nih.gov/ij/). All measurements were evaluated by two independent cardiologists who were blinded to other patients’ clinical information. STR ≥70% was defined as succesful reperfusion. The TPE interval was measured from the lead that had the longest TPE interval to no ST-T wave change by the tail method (22). Heart rate and QRS and QT intervals were also measured. Because the QT and TPE intervals vary with heart rate, Bazett’s formula (corrected index interval=index interval/√R–R) was applied to the QT and TPE intervals to determine corrected values of QT (cQT) and TPE (cTPE) intervals, respectively (23). The durations in milliseconds (ms) were obtained from pre- and postprocedural ECGs. The sum of the pre- and postprocedural ST segment elevation (∑STEPRE, ∑STEPOST) was measured 20 ms after the end of QRS complex of the infarct-related artery (IRA) leads. The percentage of STR was calculated according to the following formula: 100 * (∑STEPRE – ∑STEPOST) / ∑STEPOST.
Coronary angiography
Coronary angiography and PCI were performed according to standard practice. All patients received anticoagulation therapy with unfractionated heparin [70–100 units/kg (maximum dose, 10.000 U)] and dual antiplatelet therapy with aspirin (300 mg) and clopidogrel (600 mg) before the procedure. Coronary blood flow patterns before and after primary PCI were thoroughly evaluated using TIMI flow grades (0–3) (10). MBG was assessed according to the technique defined by van’t Hof et al. (20). Thrombus burden was assessed according to TIMI thrombus grading scale, ranging from grade 0 (no thrombus) to 5 (very large thrombus causing vessel occlusion). Patients with grade 5 thrombus were reclassified into grades 0–4 after recanalization with guidewire or small balloon (21).
Statistical analysis
Data were analyzed using the SPSS 17.0 version (SPSS Inc., Chicago, Illinois, USA). Intra- and interobserver variabilities in TPE measurements were estimated by calculating the Lin’s concordance correlation coefficient. Concordance correlation coefficients were 0.991 [95% confidence interval (CI), 0.988–0.994] for the preprocedural TPE interval and 0.992 (95% CI, 0.989–0.994) for the postprocedural TPE interval, evaluated by the same observer. Concordance correlation coefficients were 0.990 (95% CI, 0.986–0.992) for the preprocedural TPE interval and 0.988 (95% CI, 0.984–0.991) for the postprocedural TPE interval between the two observers. Normality of the data distribution was analyzed using the Kolmogorov-Smirnov test. The numerical variables with a normal distribution were presented as the mean±standard deviation, whereas those without a normal distribution were presented as the median (interquartile range). Categorical variables were presented as number and percentage (%). Continuous variables between the two independent groups were compared using the Student’s t-test or Mann–Whitney U test. Continuous variables with normal distribution between the two dependent groups were compared using the paired t-test. Categorical data were compared using the chi-square or Fisher’s exact test. Statistical significance was defined as a p value of <0.05. Multiple variable logistic regression analysis was performed to identify the independent predictors for incomplete STR (STR<70%) using variables that showed marginal association with STR (p<0.05) on univariate testing. Receiver operating characteristic (ROC) curve analyses were performed to determine the best cut-off value of pre- (cTPEPRE) and postprocedural cTPE (cTPEPOST) intervals for predicting incomplete STR. The effect size (Cohen’s d) and power value (1–β) for cTPEPRE and cTPEPOST intervals, compared between patients with complete and incomplete STR, were calculated using the G*Power software (version 3.1.9.2). The alpha level used for this analysis was <0.05. The effect size and power value were 0.94 and 0.99 for cTPEPOST and 0.38 and 0.76 for cTPEPRE.
Results
The study population consisted of 164 patients with STEMI (mean age, 62±12 years; females, 25.6%) who underwent pPCI. Patients were divided into two groups: with STR% <70 (n=102) and STR% ≥70 (n=62). Patients with STR% <70 had older age, higher incidence of HT, DM, current smoking, fasting blood glucose, C-reactive protein (CRP) levels, and peak CK-MB levels compared with those with STR% ≥70. Increased symptom to balloon time, longer lesion length, preprocedural TIMI grade 0, TIMI thrombus grade ≥2, and angiographic NR were seen more frequently in patients with STR% <70. The baseline characteristics, and clinical, angiographic, and laboratory findings of all study patients are summarized in Table 1.
Table 1.
Demographic, clinical, laboratory and coronary angiographic characteristics of all patients, patients with incopmlete STR and complete STR with P value
| All patients (n=164) | STR %<70 (n=102) | STR %≥70 (n=62) | P | |
|---|---|---|---|---|
| Age, years | 62±12 | 65±11 | 57±11 | <0.001 |
| Female sex, n (%) | 42 (25.6) | 28 (27.5) | 14 (22.6) | 0.308 |
| Hypertension, n (%) | 71 (43.3) | 56 (54.9) | 15 (24.2) | <0.001 |
| Diabetes mellitus, n (%) | 58 (35.4%) | 46 (45.1) | 12 (19.%) | 0.001 |
| Dyslipidemia, n (%) | 50 (30.5%) | 35 (34.3) | 15 (24.2) | 0.172 |
| Smoking, n (%) | 93 (56.7%) | 64 (62.7) | 29 (46.8) | 0.045 |
| Family history, n (%) | 48 (29.3%) | 28 (27.5) | 20 (32.3) | 0.512 |
| Systolic blood pressure, mm Hg | 134±21 | 136±18 | 131±24 | 0.193 |
| FGL, mg/dL | 107 (95-127) | 117 (98-132) | 97 (88-112) | <0.001 |
| Creatinine, mg/dL | 0.90±0.18 | 0.88±0.18 | 0.94±0.18 | 0.05 |
| Hemoglobin, g/dL | 14.9±1.7 | 14.7±1.8 | 15.2±1.4 | 0.071 |
| White blood cell, 103/µL | 11.4±3.2 | 11.7±2.9 | 11.1±3.5 | 0.22 |
| Platelet, 103/mm3 | 195 (171-243) | 198 (176-256) | 195 (171-234) | 0.067 |
| Total cholesterol, mg/dL | 169 (159-192) | 171 (151-194) | 167 (159-189) | 0.454 |
| CRP, mg/dL | 0.59 (0.17-1.45) | 0.83 (0.47-1.48) | 0.15 (0.08-0.88) | <0.001 |
| Peak CK-MB, mg/dL | 199 (115-311) | 252 (160-332) | 127 (63-195) | <0.001 |
| Symptom to balloon time, hours | 2.7±0.9 | 3.1±0.8 | 2.1±0.8 | <0.001 |
| IRA of LAD n (%) | 63 (38.4) | 43 (42.2) | 20 (32.3) | 0.206 |
| Proximal lesion, n (%) | 80 (48.8) | 48 (47.1) | 32 (51.6) | 0.572 |
| Preprocedural TIMI 0, n (%) | 103 (62.8) | 75 (73.5) | 28 (45.2) | <0.001 |
| Thrombus grade ≥2, n (%) | 92 (56.1) | 72 (70.6) | 20 (32.3) | <0.001 |
| Postprocedural IRA TFC | 15 (11-21) | 19 (14-30) | 13 (10-14) | <0.001 |
| Angiographic No-reflow n (%) | 81 (49.4) | 70 (68.6) | 11 (17.7) | <0.001 |
| Stent length, mm | 23 (23-28) | 28 (23-33) | 23 (18-23) | <0.001 |
| 3 vessel disease, n (%) | 18(11) | 15 (14.7) | 3 (4.8) | 0.05 |
| LVEF % | 47 (40-52) | 45 (35-52) | 48 (46-52) | 0.013 |
CK-MB-creatine kinase-myocardial band, CRP-C-reactive protein, FGL-fasting glucose level, IRA - infarct related artery, LAD-left anterior descending, LVEF-left ventricular ejection fraction, STR-ST segment resulution, TFC-TIMI frame count, TIMI-trombolysis in myocardial infarction
Continuous variables with normal distrubiton presented as mean±standard deviation were compared using Student t test. Continuous variables without normal distrubiton presented as median and interquartile range were compared using Mann-Whitney U test. Categorical variables presented as number and percentiles were compared using chi-square test
The patients with STR% <70 had higher Q wave on admission ECG and longer cTPEPRE (116±21 vs. 108±21; p=0.027), TPEPOST (107±16 vs. 92±21; p<0.001), and cTPEPOST (119±19 vs. 102±17; p<0.001) than those with STR%≥70 (Table 2, Fig. 1a-1b). There was no statistically significant difference between pre- and postprocedural QT, cQT, TPE, and cTPE intervals in patients with STR <70, but there was a statistically significant decrease in TPE and cTPE intervals after pPCI in patients with STR% ≥70 (Table 3). cTPEPRE, TPEPOST, and cTPEPOST were correlated with STR%, peak CK-MB levels, and postprocedural IRA TFC, with statistically significant correlations between the parameters (Table 4, Fig. 2a-2b).
Table 2.
Electrocardiographic characteristics of all patients, patients with incomplete STR and complete STR with P value
| All patients (n=164) | STR %<70 (n=102) | STR %≥70 (n=62) | P | |
|---|---|---|---|---|
| Preprocedural HR; /min | 72±14 | 73±13 | 69±15 | 0.151 |
| Postprocedural HR; /min | 72±13 | 73±12 | 70±14 | 0.172 |
| Q wave on admission; n (%) | 60 (36.6) | 53 (52) | 7 (11.3) | <0.001 |
| ∑STEPRE | 8 (6-13) | 8 (6-12) | 8 (4-20) | 0.495 |
| ∑STEPOST | 3 (2-5) | 4 (2-8) | 2 (1-3) | <0.001 |
| STR % | 66 (47-75) | 48 (36-64) | 78 (73-93) | <0.001 |
| QTPRE | 392±26 | 391±27 | 393±23 | 0.699 |
| cQTPRE | 426±40 | 429±42 | 420±36 | 0.155 |
| QTPOST | 392±20 | 393±22 | 390±17 | 0.332 |
| cQTPOST | 432±31 | 434±32 | 428±29 | 0.168 |
| TPEPRE | 103±17 | 105±16 | 101±19 | 0.146 |
| cTPEPRE | 113±21 | 116±21 | 108±21 | 0.027 |
| TPEPOST | 102±17 | 107±16 | 92±14 | <0.001 |
| cTPEPOST | 112±20 | 119±19 | 102±17 | <0.001 |
∑STEPRE-preprocedural sum of ST segment elevation, ∑STEPOST-postprocedural sum of ST segment elevation, cQTPOST-postprocedural corrected QT interval, cQTPRE - preprocedural corrected QT interval, cTPEPOST-postprocedural corrected TPE interval, cTPEPRE-preprocedural corrected TPE interval, HR-heart rate, QTPOST - postprocedural QT interval, QTPRE-preprocedural QT interval, STR-ST segment resolution, TPEPOST-postprocedural TPE interval, TPEPRE-preprocedural TPE interval
Continuous variables with normal distribution presented as mean±standard deviation were compared using Student t test. Continuous variables without normal distribution presented as median and interquartile range were compared using Mann-Whitney U test. Categorical variables presented as number and percentiles were compared using chi-square test
Figure 1.

Box plot showing the comparison of cTPEPRE (A) and cTPEPOST (B) intervals in patients with complete and incomplete STR
Table 3.
Pre-postprocedural change of QT, cQT, TPE and cTPE in patients with incomplete STR and complete STR with P value
| STR %<70 (n=102) | STR %≥70 (n=62) | |||||
|---|---|---|---|---|---|---|
| Before pPCI | After pPCI | P | Before pPCI | After pPCI | P | |
| QT | 391±27 | 393±22 | 0.344 | 393+23 | 390+17 | 0.106 |
| cQT | 429±42 | 434±32 | 0.182 | 420+36 | 428+29 | 0.063 |
| TPE | 105±16 | 107±16 | 0.088 | 101+19 | 92+14 | <0.001 |
| cTPE | 116±21 | 119+19 | 0.089 | 108+21 | 102+17 | 0.001 |
cQT-corrected QT interval, cTPE-corrected T peak-T end interval, QT-QT interval, TPE-T peak-T end interval
Units msc (millisecond) Paired t-test was used for comparisons
Table 4.
Correlation between cTPEPRE, TPEPOST, cTPEPOST and STR%, peak CK-MB level, postprocedural IRA TFC, LVEF
| STR % | CK-MB | Postprocedural IRA TFC | LVEF | ||
|---|---|---|---|---|---|
| cTPEPRE | Correlation Coefficient | –0.233 | 0.156 | 0.347 | –0.121 |
| Sig. (2-tailed) | 0.003 | 0.046 | <0.001 | 0.123 | |
| TPEPOST | Correlation Coefficient | –0.555 | 0.458 | 0.393 | –0.313 |
| Sig. (2-tailed) | <0.001 | <0.001 | <0.001 | <0.001 | |
| cTPEPOST | Correlation Coefficient | –0.538 | 0.430 | 0.397 | –0.340 |
| Sig. (2-tailed) | <0.001 | <0.001 | <0.001 | <0.001 |
CK-MB-creatine kinase-myocardial band, cTPEPOST-postprocedural corrected TPE interval, cTPEPRE-preprocedural corrected TPE interval, IRA-infarct related artery, LVEF-left ventricular ejection fraction, STR-ST segment resolution, TFC-TIMI frame count, TPEPOST-postprocedural TPE interval
Spearman’s test was used for correlation analysis
Figure 2.

Scatter plot of correlation between STR% and cTPEPRE (a) and cTPEPOST (b) intervals
Multiple variable logistic regression analysis was used for determining the independent predictors for STR% <70. Univariate analysis showed that age, HT, DM, smoking, fasting glucose level, CRP level, peak CK-MB level, symptom to balloon time, preprocedural TIMI grade 0, thrombus grade ≥2, angiographic NR, stent length, left ventricular ejection fraction, Q wave on admission, cTPEPRE, TPEPOST, and cTPEPOST were significantly associated with STR% <70. However, in multiple variable analysis, age, symptom to balloon time, angiographic NR, cTPEPRE, and cTPEPOST were found to be independent predictors for STR% <70 (Table 5). The cut-off values of cTPEPRE and cTPEPOST intervals for predicting STR% <70 were 96 with a sensitivity of 87.3% and specificity of 40.3% (AUC, 0.592; p=0.048) and 103 with a sensitivity of 81.4% and specificity of 62.9% (AUC, 0.756; p<0.001), respectively (Fig. 3).
Table 5.
Independent predictors of incomplete STR with univariate and multivariate P value, OR with 95% CI
| Univariate P value, OR, 95% CI | Multivariate P value, OR, 95% CI | |||||||
|---|---|---|---|---|---|---|---|---|
| P | OR | Lower | Upper | P | OR | Lower | Upper | |
| Age, years | <0.001 | 1.072 | 1.038 | 1.108 | .001 | 1.078 | 1.013 | 1.148 |
| Symptom to balloon time, hours | <0.001 | 4.437 | 2.663 | 7.393 | .002 | 2.874 | 1.455 | 5.676 |
| Angiographic no-reflow n (%) | <0.001 | 4.525 | 2.546 | 8.042 | .001 | 5.411 | 2.065 | 14.181 |
| cTPEPRE, ms | 0.027 | 1.018 | 1.002 | 1.034 | .019 | 1.015 | 1.001 | 1.029 |
| cTPEPOST,ms | <0.001 | 1.054 | 1.032 | 1.076 | .009 | 1.043 | 1.011 | 1.073 |
cTPEPOST-postprocedural corrected TPE interval, cTPEPRE-preprocedural corrected TPE interval, STR-ST segment resolution
Multiple variable logistic regression analysis with backward elimination was performed
Figure 3.
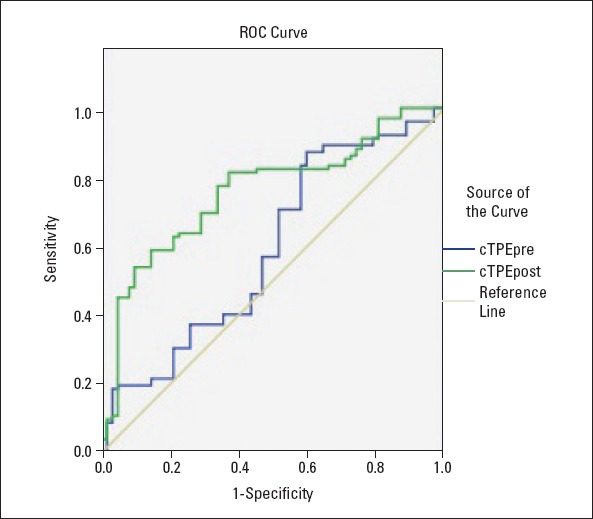
ROC graphs to detect the best cut-off value of cTPEPRE and cTPEPOST intervals in the prediction of incomplete STR. ROC, receiver operating characteristic; cTPEPRE, preprocedural corrected TPE interval; cTPEPOST, postprocedural corrected TPE interval
Discussion
Our study demonstrated that prolonged cTPEPRE and cTPEPOST intervals were significantly associated with reperfusion success and independent predictors for imperfect STR.
In clinical practice, there are several methods to define reperfusion success in the setting of STEMI, including TIMI grade, corrected TIMI frame count, MBG, and STR (10-18). ST segment changes reflect myocardial rather than epicardial flow and thus yield prognostic information beyond that provided by coronary angiogram alone. Numerous studies have shown that STR% ≥70 (complete resolution) was significantly associated with lower infarct size and subsequent morbidity and mortality (14-18). In our study, incomplete STR (<70%) was seen in 62.2% (n=102) of patients. Consistent with the results of previous studies, we found that older age, history of DM, smoking, large infarct size (higher symptom to balloon time, presence of Q wave on admission ECG, peak CK-MB level, decreased LVEF), more frequent preprocedural TIMI grade 0, high thrombus burden, and angiographic NR were associated with incomplete STR (7-13). In addition, we found that history of HT was more prevalent in patients with NR despite lack of evidence regarding the relationship between NR and HT. This contradictory result could be explained by the relationship between HT, endothelial dysfunction (24), slow coronary flow (25), and increased atherosclerotic burden (26) in stable CAD.
Acute MI involves electrochemical and metabolic alterations of cardiac muscles, which in turn affect electrochemical gradient, tissue oxygen level, ion channel conditions, and pH. These changes have a complex effect on the duration of action potentials in the ischemic zone and ischemic border zone; thus, TPE and QT intervals display modestly compatible changes (1-5, 27, 28). We hypothesized that the severity of these changes is related with reperfusion success, and that prolongation of QT and TPE intervals could be predictors for imperfect myocardial flow despite successful restoration of the epicardial flow. It is known that myocardial ischemia prolongs QT interval while reperfusion shortens it (29, 30); however, there was no statistically significant relationship between QT interval and reperfusion features in our study. We observed that TPE and cTPE intervals reduced after pPCI in patients with complete STR; no statistically significant change was observed in patients with incomplete STR despite numerical increase. In addition, patients with incomplete STR had significantly longer cTPEPRE, TPEPOST, and cTPEPOST intervals than those with complete STR; cTPEPRE and cTPEPOST intervals were independent predictors for incomplete STR. Similar to our results, Eslami et al. (5) and Duyuler et al. (31) found that reperfusion success was more closely related with shortened TPE interval than with QT interval. However, there were some differences between the results of our and previous studies. We assessed reperfusion success according to STR, which was claimed to better reflect reperfusion at cellular level, but not according to angiographic indices. Also, we observed that prolonged cTPEPRE interval was an independent predictor for imperfect reperfusion, which was not found in previous studies (5, 31). Shortening of the TPE interval, without shortening of the QT interval, in patients with complete STR can be explained by the fact that these parameters, which have similar clinical applications, represent electrophysiologically different properties in healthy and ischemic myocardia. The duration of the action potential represented by the QT interval on surface ECG is prolonged due to myocardial ischemia/infarction. Moreover, this prolongation could last for hours and days due to the presence of nonischemic causes, such as autonomic alterations, even when tissue perfusion is successfully restored. Interventricular, intraventricular, and transmural heterogeneity in the repolarization duration of myocytes is represented by TPE on surface ECG. During myocardial infarction/ischemia, the heterogeneity in ventricular repolarization becomes more prominent because of increased differences in repolarization duration between normal, ischemic, and ischemic border zones, thus prolonging the TPE interval. Furthermore, the prolongation of TPE interval is more closely related with ischemia-induced metabolic alteration (intra–extracellular electrolyte concentration, electrochemical gradient, and pH), which rapidly improves with the restoration of the blood supply (28).
Prolonged TPEPOST interval in patients with incomplete STR is an expected finding; however, it was surprising that cTPEPRE interval was also longer in these patients. This unusual finding can be explained in several ways: First, the infarct size of patients with NR in our study was larger than those without NR before pPCI, because they had a delayed symptom to balloon time and more frequent presence of Q waves on admission ECG. Large infarct size causes imperfect tissue perfusion due to tissue edema, endothelial dysfunction, and ischemia-reperfusion injury (9). Second, patients with NR had more frequent risk factors for NR development, including older age, history of HT, DM, and smoking in the present study. These factors may have contributed to the expansion of the infarct size and thus the prolongation of the TPE interval before the procedure. Finally, the association of prolonged TPE interval with HT and DM could not only be explained by these being risk factors for NR but also by the results of recent studies which demonstrated that HT and DM could cause prolongation of TPE interval in patients without acute medical illness (32, 33). The presence of more frequent history of DM and HT in patients with NR may have contributed to the prolongation of cTPEPRE interval in these patients.
Study limitations
The present study had a cross-sectional design; hence, it does not provide prognostic data. Reperfusion success was evaluated by visual assessment of coronary angiogram and STR; a more specific and sensitive method, such as coronary flow reserve, contrast ECG, or cardiac magnetic resonance, was not used. Although the ECGs were scanned, loaded on a computer, sufficiently magnified, and analyzed using a digital image processing software for precise measurement, standard calibration of ECG recordings (speed, 25 mm/s, voltage calibration, 10 mm/mV) may have caused errors during TPE and QT interval measurement.
Conclusions
The present study demonstrated that prolonged TPE interval is associated with reperfusion features in patients with STEMI, and that TPE could be used as a marker for reperfusion success. These results may provide valuable information about the factors that play a role in TPE prolongation which leads to poor prognosis in patients with STEMI. It also should be noted that the presence of more frequent history of DM and HT in patients with incomplete STR may contribute to the presence of prolonged cTPEPRE interval in these patients.
Acknowledgment:
The authors would like to thank www.metastata.com for their contributions in statistical analysis and trial design.
Footnotes
Conflict of interest: None declared.
Peer-review: Externally peer-reviewed.
Authorship contributions: Concept – M.Ç., Y.V., İ.R.; Design – M.Ç., S.K.; Supervision – S.K., H.İ.T.; Data collection &/or processing – D.İ., İ.R., İ.A., Y.K., M.Y.; Analysis &/or interpretation – Y.K., H.İ.T., O.T.; Literature search – İ.R., Y.V., S.Ç.E.; Writing – M.Ç., Y.V., H.İ.T.; Critical review – S.K., H.İ.T.
References
- 1.Tse G, Yan BP. Traditional and novel electrocardiographic conduction and repolarization markers of sudden cardiac death. Europace. 2017;19:712–21. doi: 10.1093/europace/euw280. [DOI] [PubMed] [Google Scholar]
- 2.Tse G, Gong M, Wong WT, Georgopoulos S, Letsas KP, Vassiliou VS, et al. The Tpeak - Tend interval as an electrocardiographic risk marker of arrhythmic and mortality outcomes:A systematic review and meta-analysis. Heart Rhythm. 2017;14:1131–7. doi: 10.1016/j.hrthm.2017.05.031. [DOI] [PubMed] [Google Scholar]
- 3.Zhao X, Xie Z, Chu Y, Yang L, Xu W, Yang X, et al. Association between Tp-e/QT ratio and prognosis in patients undergoing primary percutaneous coronary intervention for ST-segment elevation myocardial infarction. Clin Cardiol. 2012;35:559–64. doi: 10.1002/clc.22022. [DOI] [PMC free article] [PubMed] [Google Scholar]
- 4.Tatlisu MA, Özcan KS, Güngör B, Ekmekçi A, Çekirdekçi EI, Aruğarslan E, et al. Can the T-peak to T-end interval be a predictor of mortality in patients with ST-elevation myocardial infarction? Coron Artery Dis. 2014;25:399–404. doi: 10.1097/MCA.0000000000000101. [DOI] [PubMed] [Google Scholar]
- 5.Eslami V, Safi M, Taherkhani M, Adibi A, Movahed MR. Evaluation of QT, QT dispersion, and T-wave peak to end time changes after primary percutaneous coronary intervention in patients presenting with acute ST-elevation myocardial infarction. J Invasive Cardiol. 2013;25:232–4. [PubMed] [Google Scholar]
- 6.Morishima I, Sone T, Mokuno S, Taga S, Shimauchi A, Oki Y, et al. Clinical significance of no-reflow phenomenon observed on angiography after successful treatment of acute myocardial infarction with percutaneous transluminal coronary angioplasty. Am Heart J. 1995;130:239–43. doi: 10.1016/0002-8703(95)90434-4. [DOI] [PubMed] [Google Scholar]
- 7.Wu KC, Zerhouni EA, Judd RM, Lugo-Olivieri CH, Barouch LA, Schulman SP, et al. Prognostic significance of microvascular obstruction by magnetic resonance imaging in patients with acute myocardial infarction. Circulation. 1998;97:765–72. doi: 10.1161/01.cir.97.8.765. [DOI] [PubMed] [Google Scholar]
- 8.Ndrepepa G, Tiroch K, Keta D, Fusaro M, Seyfarth M, Pache J, et al. Predictive factors and impact of no reflow after primary percutaneous coronary intervention in patients with acute myocardial infarction. Circ Cardiovasc Interv. 2010;3:27–33. doi: 10.1161/CIRCINTERVENTIONS.109.896225. [DOI] [PubMed] [Google Scholar]
- 9.Bouleti C, Mewton N, Germain S. The no-reflow phenomenon:State of the art. Arch Cardiovasc Dis. 2015;108:661–74. doi: 10.1016/j.acvd.2015.09.006. [DOI] [PubMed] [Google Scholar]
- 10.Gibson CM, Cannon CP, Murphy SA, Marble SJ, Barron HV, Braunwald E TIMI Study Group. Relationship of TIMI myocardial perfusion grades, flow grades, frame count and percutaneous coronary intervention to long-term outcomes after thrombolytic administration in acute myocardial infarction. Circulation. 2002;105:1909–13. doi: 10.1161/01.cir.0000014683.52177.b5. [DOI] [PubMed] [Google Scholar]
- 11.Hoffmann P, Haager P, Lepper W, Franke A, Hanrath P. Relation of coronary flow pattern to myocardial blush grade in patients with first acute myocardial infarction. Heart. 2003;89:1147–51. doi: 10.1136/heart.89.10.1147. [DOI] [PMC free article] [PubMed] [Google Scholar]
- 12.Henriques JP, Zijlstra F, van't Hof AW, de Boer MJ, Dambrink JH, Gosselink M, et al. Angiographic assessment of reperfusion in acute myocardial infarction by myocardial blush grade. Circulation. 2003;107:2115–9. doi: 10.1161/01.CIR.0000065221.06430.ED. [DOI] [PubMed] [Google Scholar]
- 13.Niccoli G, Burzotta F, Galiuto L, Crea F. Myocardial no-reflow in humans. J Am Coll Cardiol. 2009;54:281–92. doi: 10.1016/j.jacc.2009.03.054. [DOI] [PubMed] [Google Scholar]
- 14.Schröder R. Prognostic impact of early ST-segment resolution in acute ST-elevation myocardial infarction. Circulation. 2004;110:e506–10. doi: 10.1161/01.CIR.0000147778.05979.E6. [DOI] [PubMed] [Google Scholar]
- 15.Sorajja P, Gersh BJ, Costantini C, McLaughlin MG, Zimetbaum P, Cox DA, et al. Combined prognostic utility of ST-segment recovery and myocardial blush after primary percutaneous coronary intervention in acute myocardial infarction. Eur Heart J. 2005;26:667–74. doi: 10.1093/eurheartj/ehi167. [DOI] [PubMed] [Google Scholar]
- 16.Giugliano RP, Sabatine MS, Gibson CM, Roe MT, Harrington RA, Murphy SA, et al. Combined assessment of thrombolysis in myocardial infarction flow grade, myocardial perfusion grade and ST-segment resolution to evaluate epicardial and myocardial reperfusion. Am J Cardiol. 2004;93:1362–7. doi: 10.1016/j.amjcard.2004.02.031. [DOI] [PubMed] [Google Scholar]
- 17.Buller CE, Fu Y, Mahaffey KW, Todaro TG, Adams P, Westerhout CM, et al. ST-segment recovery and outcome after primary percutaneous coronary intervention for ST-elevation myocardial infarction:insights from the Assessment of Pexelizumab in Acute Myocardial Infarction (APEX-AMI) trial. Circulation. 2008;118:1335–46. doi: 10.1161/CIRCULATIONAHA.108.767772. [DOI] [PubMed] [Google Scholar]
- 18.van't Hof AW, Liem A, de Boer MJ, Zijlstra F. Clinical value of 12-lead electrocardiogram after successful reperfusion therapy for acute myocardial infarction. Zwolle Myocardial infarction Study Group. Lancet. 1997;350:615–9. doi: 10.1016/s0140-6736(96)07120-6. [DOI] [PubMed] [Google Scholar]
- 19.Steg PG, James SK, Atar D, Badano LP, Blömstrom-Lundqvist C, Borger MA, et al. ESC Guidelines for the management of acute myocardial infarction in patients presenting with ST-segment elevation. Eur Heart J. 2012;33:2569–619. doi: 10.1093/eurheartj/ehs215. [DOI] [PubMed] [Google Scholar]
- 20.van't Hof AW, Liem A, Suryapranata H, Hoorntje JC, de Boer MJ, Zijlstra F. Angiographic assessment of myocardial reperfusion in patients treated with primary angioplasty for acute myocardial infarction:myocardial blush grade. Zwolle Myocardial Infarction Study Group. Circulation. 1998;97:2302–6. doi: 10.1161/01.cir.97.23.2302. [DOI] [PubMed] [Google Scholar]
- 21.Gibson CM, de Lemos JA, Murphy SA, Marble SJ, McCabe CH, Cannon CP, et al. Combination therapy with abciximab reduces angiograhically evident thrombus in acute myocardial infarction –a TIMI 14 substudy. Circulation. 2001;103:2550–4. doi: 10.1161/01.cir.103.21.2550. [DOI] [PubMed] [Google Scholar]
- 22.Salles GF, Cardoso CRL, Leocardio SM, Muxfeldt ES. Recent ventricular repolarization markers in resistant hypertension:are they different from the traditional QT interval? Am J Hypertens. 2008;21:47–53. doi: 10.1038/ajh.2007.4. [DOI] [PubMed] [Google Scholar]
- 23.Erikssen G, Liestøl K, Gullestad L, Haugaa KH, Bendz B, Amlie JP. The terminal part of the QT interval (T peak to T end):a predictor of mortality after acute myocardial infarction. Ann Noninvasive Electrocardiol. 2012;17:85–94. doi: 10.1111/j.1542-474X.2012.00493.x. [DOI] [PMC free article] [PubMed] [Google Scholar]
- 24.Higashi Y, Nakagawa K, Kimura M, Noma K, Hara K, Sasaki S, et al. Circadian variation of blood pressure and endothelial function in patients with essential hypertension:a comparison of dippers and non-dippers. J Am Coll Cardiol. 2002;40:2039–43. doi: 10.1016/s0735-1097(02)02535-4. [DOI] [PubMed] [Google Scholar]
- 25.Evola S, Cuttitta F, Evola G, Macaione F, Piraino D, Meschisi MC, et al. Early detection of coronary artery flow and myocardial perfusion impairment in hypertensive patients evidenced by Myocardial Blush Grade (MBG) and Thrombolysis in Myocardial Infarction (TIMI) Frame Count (TFC) Intern Med. 2012;51:1653–60. doi: 10.2169/internalmedicine.51.7385. [DOI] [PubMed] [Google Scholar]
- 26.Jankowski P, Kawecka-Jaszcz K, Czarnecka D. Ascending aortic blood pressure waveform is related to coronary atherosclerosis in hypertensive as well as in normotensive subjects. Blood Press. 2007;16:246–53. doi: 10.1080/08037050701428125. [DOI] [PubMed] [Google Scholar]
- 27.Shenthar J, Deora S, Rai M, Nanjappa Manjunath C. Prolonged Tpeak-end and Tpeak-end/QT ratio as predictors of malignant ventricular arrhythmias in the acute phase of ST-segment elevation myocardial infarction:a prospective case-control study. Heart Rhythm. 2015;12:484–9. doi: 10.1016/j.hrthm.2014.11.034. [DOI] [PubMed] [Google Scholar]
- 28.Michael G, Xiao L, Qi XY, Dobrev D, Nattel S. Remodelling of cardiac repolarization:How homeostatic responses can lead to arrhythmogenesis. Cardiovasc Res. 2009;81:91–9. doi: 10.1093/cvr/cvn266. [DOI] [PubMed] [Google Scholar]
- 29.Endoh Y, Kasanuki H, Ohnishi S, Shibata N, Hosoda S. Influence of early coronary reperfusion on QT interval dispersion after acute myocardial infarction. Pacing Clin Electrophysiol. 1997;20:1646–53. doi: 10.1111/j.1540-8159.1997.tb03534.x. [DOI] [PubMed] [Google Scholar]
- 30.Nikiforos S, Hatzisavvas J, Pavlides G, Voudris V, Vassilikos VP, Manginas A, et al. QT-interval dispersion in acute myocardial infarction is only shortened by thrombolysis in myocardial infarction grade 2/3 reperfusion. Clin Cardiol. 2003;26:291–5. doi: 10.1002/clc.4950260611. [DOI] [PMC free article] [PubMed] [Google Scholar]
- 31.Duyuler PT, Duyuler S, Demir M. Impact of myocardial blush grade on Tpe interval and Tpe/QT ratio after successful primary percutaneous coronary intervention in patients with ST elevation myocardial infarction. Eur Rev Med Pharmacol Sci. 2017;21:143–9. [PubMed] [Google Scholar]
- 32.Demir M, Uyan U. Evaluation of Tp-e interval and Tp-e/QT ratio in patients with non-dipper hypertension. Clin Exp Hypertens. 2014;36:285–8. doi: 10.3109/10641963.2013.810233. [DOI] [PubMed] [Google Scholar]
- 33.Tokatlı A, Kılıçaslan F, Alış M, Yiğiner O, Uzun M. Prolonged Tp-e Interval, Tp-e/QT Ratio and Tp-e/QTc Ratio in Patients with Type 2 Diabetes Mellitus. Endocrinol Metab (Seoul) 2016;31:105–12. doi: 10.3803/EnM.2016.31.1.105. [DOI] [PMC free article] [PubMed] [Google Scholar]