

Abstract
World Health Organization recommends exclusive breastfeeding for infants for the first 6 months of life, followed by introduction of nutritious complementary foods alongside breastfeeding. Breast milk remains a significant source of nourishment in the second half of infancy and beyond; however, it is not clear whether more breast milk is always better. The present study was designed to determine the association between amount of breast milk intake at 9–10 months of age and infant growth and development by 12–18 months of age. The study was nested in a randomized controlled trial conducted in Malawi. Regression analysis was used to determine associations between breast milk intake and growth and development. Mean (SD) breast milk intake at 9–10 months of age was 752 (244) g/day. Mean (SD) length‐for‐age z‐score at 12 months and change in length‐for‐age z‐score between 12 and 18 months were −1.69 (1.0) and −0.17 (0.6), respectively. At 18 months, mean (SD) expressive vocabulary score was 32 (24) words and median (interquartile range) skills successfully performed for fine, gross, and overall motor skills were 21 (19–22), 18 (16–19), and 38 (26–40), respectively. Breast milk intake (g/day) was not associated with either growth or development. Proportion of total energy intake from breast milk was negatively associated with fine motor (β = −0.18, p = .015) but not other developmental scores in models adjusted for potential confounders. Among Malawian infants, neither breast milk intake nor percent of total energy intake from breast milk at 9–10 months was positively associated with subsequent growth between 12 and 18 months, or development at 18 months.
Keywords: breast milk intake, growth and development, infant, lipid‐based nutrient supplements, Malawi
Key messages.
Breast milk continues to be an important source of nourishment for healthy growth and development during the second half of infancy and beyond.
Neither the amount of breast milk nor the percent of total energy intake from breast milk at 9–10 months was associated with subsequent growth between 12 and 18 months, or gross and total motor scores or language development at 18 months. Percent of energy from breast milk was inversely associated with fine motor scores.
More data are needed to understand the contribution of breast milk to growth and development in the second half of infancy and beyond.
1. INTRODUCTION
Exclusive breastfeeding is recommended for the first 6 months of life (UNICEF & WHO, 2003). After 6 months of age, breast milk alone is not sufficient to meet the increasing demand for nutrients and energy of the growing infant but it continues to be an important source of nutrients and energy during the second half of infancy and beyond (Dewey, Pan American Health Organization, & WHO, 2003). Breast milk has immunological functions, contributing towards prevention of infection and protection against inflammation (Walker, 2010) and may also contribute towards promotion of the integrity of the intestinal barrier by regulating the gut microbiota (Rogier et al., 2014). The process of breastfeeding also plays an important role in mother–infant bonding, which may positively affect behaviour and cognitive development by enhancing mother–infant interaction.
Although continued breastfeeding is recommended up to 2 years of age and beyond, there is a lack of information about the association between the quantity of breast milk intake and health outcomes among children during the complementary feeding period. There is a concern that too much energy from complementary foods may displace breast milk (Dewey, 2000), because infants self‐regulate their total energy intake (Dewey & Lonnerdal, 1986). In communities where complementary foods are of poor nutritional value, as is the case in developing countries (Dewey, 2013), too much displacement of breast milk could be detrimental to child growth and development. However, whether more breast milk is always “better” is still unclear.
The present study addressed the association between the amount of breast milk consumed at 9–10 months of age and the infant's growth and development by 12–18 months of age. The study also assessed the association between proportion of total energy intake from breast milk with growth and development. The study was conducted in rural Malawi, sub‐Saharan Africa, where breastfeeding is almost universal, and a high proportion of mothers continue breastfeeding until their children reach age 18 months or beyond. The objective of this study was therefore to examine whether a greater quantity of breast milk per day, or a greater percentage of infant dietary intake from breast milk as compared to other foods, after age 6 months would be associated with indicators of growth and development.
2. MATERIALS AND METHODS
2.1. Study design, site, and participants
This was a prospective cohort study, nested in a randomized controlled single blinded trial, the iLiNS‐DOSE trial, conducted in areas surrounding Mangochi District Hospital and Namwera Health Centre in southern Malawi (Maleta et al., 2015). The iLiNS‐DOSE trial was designed to test the efficacy of small quantity lipid‐based nutrient supplements (SQ‐LNS), in doses ranging from 10 to 40 g/day, for supporting infant growth. Healthy infants were eligible for enrolment into the trial if they were 5.50–6.49 months of age, resided in the study area, would be available during the 12‐month study period, and were not concurrently participating in any other clinical trial.
Out of 1,932 infants enrolled in the iLiNS‐DOSE trial, 595 mother–infant pairs were invited to participate in a substudy designed to assess the impact of SQ‐LNS supplementation on breast milk intake at 9–10 months. Four hundred infants were randomized into the breast milk intake substudy at enrolment into the main iLiNS‐DOSE trial. Block randomization and a set of opaque envelopes were used to assign participants to both the intervention groups and the present substudy (Maleta et al., 2015). However, because of higher attrition than anticipated, a second phase of recruitment from the main iLiNS‐DOSE trial was implemented to reach the planned sample size. Participants for the second enrolment were selected at random during the remaining period of enrolment for the main iLiNS‐DOSE trial. Specifically, at enrolment, mothers were asked if they would be interested to participate in both the main and the present substudy before they selected the randomization envelop. The main reasons for attrition were that the mother–infant dyads were not always available to provide saliva samples at the assigned time points and/or they were not available for body weight measurements (Kumwenda et al., 2014). Because their saliva and/or body weight data were incomplete, breast milk intake could not be measured reliably, the total number excluded on this basis was 124. We did not observe a significant impact of SQ‐LNS supplementation on breast milk intake among infants at 9–10 months of age (Kumwenda et al., 2014). The same children were prospectively followed until they turned 18 months, their growth was measured at 12 and 18 months, and motor and language development was assessed at 18 months. We then examined the association between amount of breast milk consumed and growth and development among these children.
Mother–infant pairs were eligible for the breast milk intake substudy if the infant was enrolled in the main iLiNS‐DOSE trial, infant age was between 9.0 and 10.0 months, the mother was breastfeeding the infant on demand, and the mother and infant would be available for the full study period of 2 weeks. Participants were not eligible if the mother was breastfeeding more than one infant or the mother or infant had a severe illness warranting hospital referral. The trial was registered at ClinicalTrials.gov registration as ID: NCT00945698.
2.2. Measurement of breast milk intake and energy from complementary foods
For each infant, breast milk intakes over a 14‐day period were measured using the dose‐to‐mother deuterium oxide dilution technique developed by Coward, Cole, Sawyer, and Prentice (1982). A comprehensive description of the method is provided elsewhere (Haisma et al., 2003). The details of the assessment of breast milk intake for the present sample have also been described elsewhere (Kumwenda et al., 2014). In brief, on day zero of the substudy, a baseline saliva sample was taken from both the mother and the infant, followed by a 30 g dose of deuterium given to the mother. Additional saliva samples were collected from both the mother and the infant on study Days 1, 2, 3, 4, 13, and 14. Deuterium enrichment in the saliva of both the mother and the infant over the 2‐week study period was measured by Fourier transform infrared spectroscopy (FTIR 8400 Series; Shimadzu Corporation; IAEA, 2010). Using the solver function in Excel, a two compartment steady state model (Coward et al., 1982) was run to estimate mean daily breast milk intake over the 14‐day period.
Energy intake from breast milk was calculated by multiplying mean breast milk intake in grams by a factor of 0.67 kcal/g, which is the mean energy content per gram of breast milk (Butte, Lopez‐Alarcon, & Garza, 2002). Daily energy intake from nonbreast milk sources and meal frequency were derived from the dietary intake data assessed by 4‐pass 24‐hr interactive dietary recalls (Ferguson et al., 1995; Hemsworth et al., 2016) on 2 days, approximately 1 week apart, during the same 14‐day period. Details of dietary intake assessment have been provided elsewhere (Hemsworth et al., 2016). Briefly, daily energy from complementary foods consumed by infants was calculated as the average from two recall days. A meal was defined as any feeding episode where the infant consumed a starchy staple in the form of a porridge (phala) or thick porridge (nsima) or boiled rice, and the number of such meals was summed for each day. Meal frequency was defined as the average of this sum across the 2 days. Breastfeeding frequency was assessed using a food frequency questionnaire from the main iLiNS‐DOSE trial (Arimond et al., 2017). Precoded responses (0 = Not at all; 1 = only at night; 2 = very little, only 1, or 2 times during the day; 3 = moderately, about 3 to 5 times during the day; 4 = very often, at least 6 times during the day) were read to mothers, who were asked to identify the response that most closely matched the frequency of breastfeeding the infant in the previous day. Response 4 was categorized as high breastfeeding frequency.
2.3. Anthropometric measurements
Anthropometric measurements were taken at mean (SD) ages 5.9 (0.3) months (baseline), 12.0 (0.5) months, and 18 (0.8) months by trained data collectors, who were routinely supervised and retrained every 3 months; all measurements were done in triplicate. Measuring equipment was calibrated on a regular basis. Mothers were weighed in light clothing to the nearest 0.01 kg using an electronic scale (SECA 846; Chasmors Ltd, London England) and height was measured to the nearest 0.1 cm using a stadiometer (Harpenden; Holtain Ltd, Crosswell, UK). Infants were weighed nude to the nearest 0.01 kg using an electronic scale (SECA 735; Chasmors Ltd, London England) and length was measured to the nearest 1 mm using a length board (Harpenden Infantometer, Holtain Limited, Crosswell, Crymych, UK). Length‐for‐age z‐scores (LAZ) were calculated using the World Health Organization Child Growth Standards (WHO, Multicentre Growth Reference, & Study Group, 2006). Change in LAZ‐score was calculated by subtracting z‐score at 12 months from z‐score at 18 months.
2.4. Assessment of development at 18 months of age
Developmental assessment was conducted by trained fieldworkers who were evaluated for reliability and retrained every 6 months. Children were assessed 53 weeks after enrolment, at a mean age of approximately 18 months. Motor development was assessed using the Kilifi Developmental Inventory, which is a tool that was developed in Kenya based on several standard tests originating in high‐income countries, including the Griffiths Mental Development Scale and the Merrill‐Palmer Scales (Abubakar, Holding, van Baar, Newton, & van de Vijver, 2008). Children were evaluated on 35 gross motor skills, such as walking and climbing, and 34 fine motor skills, such as threading beads on a string. The score was the total number of skills the child successfully completed in each of the subscales (gross and fine motor) and the total motor score (sum of all 69 skills).
Language development was assessed using an adapted version of the MacArthur‐Bates Communicative Development Inventory (Fenson et al., 2007), based in part on previous adaptations of this tool in Bangladesh (Hamadani et al., 2010) and Kenya (Alcock et al., 2010). The score was the total number of meaningful words the child was able to say out of a 100‐word vocabulary checklist reported through an interview with a caregiver.
2.5. Social‐demographic and other independent variables
We measured developmental stimulation from the environment using the Family Care Indicators score (Kariger et al., 2012), which was the sum of the source of play materials (3 items), variety of play materials (7 items), whether or not books or magazines were present in the home (2 items), and activities items (6 items) indicating whether any adult has engaged in each of six activities with the child in the past 3 days (maximum 18 points).
Social‐demographic data (maternal education and age, household assets) were collected during enrolment into the main iLiNS‐DOSE trial through interviews using structured questionnaires. The household asset index was constructed using principal components analysis (Vyas & Kumaranayake, 2006) and was standardized with a mean of zero and standard deviation of one. The index reflected baseline ownership of a set of assets (radio, television, refrigerator, cell phone, and stove), drinking water supply, sanitation facilities, and flooring materials.
The Household Food Insecurity Access scale is a continuous measure of the degree of food insecurity (not actual food quality or intake) in the household based on experiential questions. The Household Food Insecurity Access scale is based on a set of questions that captures perceptions and reported experiences of three domains of food insecurity: anxiety and uncertainty about the household food supply; insufficient quality; and insufficient food intake and its physical consequences (Coates, Swindale, & Bilinsky, 2007). Each household received a score from 0 to 27 based on a simple sum of the frequency of occurrence of each food insecurity condition. The higher the score, the higher the degree of household food insecurity experienced in the previous 4 weeks.
2.6. Statistical analysis
This study is based on a total sample size of 358 infants from the substudy designed to assess the impact of LNS on breast milk intake (Kumwenda et al., 2014). The sample size was determined for the primary outcome of the breast milk intake substudy. The calculation took into account the WHO (1998) average breast milk intake at 9–11 months of age of 616 ± 172 g/day; on this basis, a sample size of 89 mother–infant pairs per group was needed to detect a group difference in milk intake of ~86 g/day between the four supplementation groups (0, 10, 20, or 40 g; a = 0.05, b = 0.80, effect size = 0.5); the number was increased to 100 per group to account for attrition, which was estimated as 12%. However, the final sample sizes used in different models in this analysis are lower than the total sample size because of missing values. With a sample size of ≥158 for each model, our study had over 80% power to detect a correlation coefficient of 0.2 at the significance level of 5%.
Data analyses were done using STATA (version 12; STATA Corp, College Station, TX). Continuous variables were assessed for normality to establish the need for data transformation. Fine, gross, and total motor development scores were skewed (skewness > 1) therefore were log (k‐x) transformed, where k refers to the maximum score, then multiplied by minus one (−1). This transformation reduced skewness to <1 and preserved the original direction of the score (higher is better). For all other scores, the skewness was <1 and therefore did not require transformation.
Bivariate analysis was conducted using simple linear regression to assess the independent association between breast milk intake or percent of total energy intake from breast milk and each outcome (attained LAZ at 12 months, change in LAZ between 12 and 18 months, motor and language scores). The following covariates were identified a priori to be included in the adjusted models based on their known biologically plausible relationship with growth and development: maternal education and height, infant weight at 9–10 months, household asset score, family care index, and household food insecurity. Presence of multicollinearity and adjusted associations between the two dietary variables and growth and development were assessed using multiple linear regressions. The p value of ≤.05 was considered statistically significant for all tests.
3. RESULTS
The study was conducted between March 2010 and November 2011. Data are from 358 mother–infant pairs who participated in the breast milk intake substudy (Figure 1). The baseline characteristics of the participants in the substudy and those in the main iLiNS‐DOSE trial are shown in Table 1. Complete data for growth and development variables were available for 302 and 309 infants, respectively (Figure 1). Mean breast milk energy intakes and total daily energy intakes did not differ between those with and those without growth and development data (p > .05).
Figure 1.
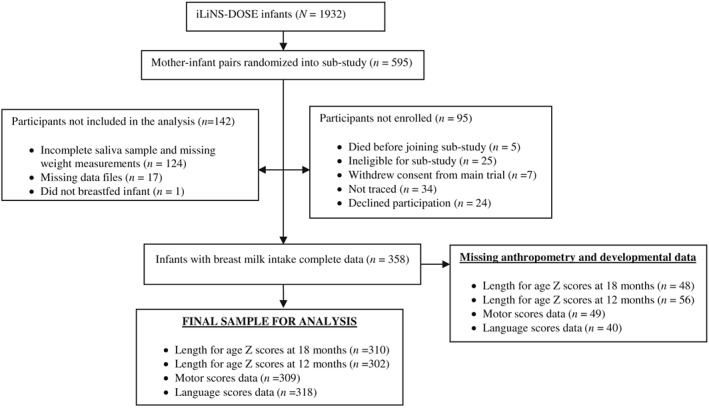
Participant flow
Table 1.
Baseline characteristics of the mother–infant pairs
| Study group | Breast milk intake substudy (n = 358) | Participants not included in the substudy (n = 1,337) |
|---|---|---|
| Infant characteristics | ||
| Proportion of males | 47% | 51% |
| Length‐for‐age z‐score at 5.5–6 months of age | −1.43 (1.03) | −1.39 (1.06) |
| Weight‐for‐length z‐score at 5.5–6 months of age | 0.27 (1.10) | 0.25 (1.12) |
| Maternal characteristics | ||
| Heighta (cm) | 155.1 (5.4) | 155.0 (5.7) |
| Age (year)b | 26 (17–43) | 25 (21–30) |
| Education (year)b | 4 (0–12) | 5 (2–7) |
| Body mass index (kg/m2) | 21.9 (3.0) | 21.9 (2.9) |
| Parityb | 3 (1–9) | 3 (2–4) |
| Household variables | ||
| Household food insecurity score | 6 (2–13) | 6 (1–10) |
| Household asset z‐scoresb | −0.17 (−0.72–0.36) | 0.04 (−0.72–0.40) |
| Family care index | 8.9 (3) | 9 (3) |
Height and weight were measured at enrolment into the main trial.
Household asset z‐scores and maternal age, parity, and education are medians (interquartile range).
Infant feeding data are presented in Table 2. The mean (SD) breast milk intake among study participants was 752 (244) g/day or 94 (30) g/kg body weight per day. The mean (SD) breast milk intakes of children less than 10 months of age and those greater than or equal to 10 months were 748 (237) and 758 (256) g/day, respectively and were not significantly different (p = .70). Breast milk intake ranged from 125 to 1,895 g/day (Figure 2). The mean (SD) energy intake from complementary foods was 403 (171) and the median (interquartile range [IQR]) energy from breast milk was 495 (410‐583). The mean (SD) total energy intake was 911 (228) kcal. The mean (SD) percent of total energy intake from breast milk was 56 (13.3)%. Breastfeeding frequency was quite high, with 90% of the participants reporting breastfeeding their infants at least six times during the daytime (Table 2). The mean (SD) LAZ‐score at 12 months was −1.69 (1.0) and the mean (SD) change in LAZ between 12 and 18 months was −0.17 (0.6). At 18 months, the mean (SD) language development score was 32 (24) and the median (IQR) untransformed scores for fine, gross, and overall motor scores were 21 (19–22), 18 (16–19), and 38 (26–40), respectively.
Table 2.
Infant feeding characteristics
| Variable | N | Mean (SD) or % | Min | Max |
|---|---|---|---|---|
| Breast milk intake (g/day) | 358 | 752 (244) | 125 | 1,895 |
| Energy from breast milk (kcal/day) | 284 | 495 (410–583)a | 84 | 1,269 |
| Energy from nonbreast milk sources (kcal/day) | 284 | 403 (171) | 32 | 1,019 |
| Total energy intake (kcal/day) | 284 | 911 (228) | 405 | 1,815 |
| Meal frequency | 284 | 6 (5–7)a | 1 | 13 |
| Breastfeeding frequency | — | — | ||
| 0 = Not at all | 1 | 0.3% | ||
| 1 = Only at night | 1 | 0.3% | — | — |
| 2 = Very little, only 1 or 2 times during the dayb | 2 | 0.7% | — | — |
| 3 = Moderately, about 3 to 5 times during the dayb | 25 | 8.4% | — | — |
| 4 = Very frequent, more than 5 times during the dayb | 269 | 90.0% | — | — |
Values are medians and interquartile range.
Day refers to daytime hours.
Figure 2.

Histogram of breast milk intake (g/day)
In bivariate analyses, breast milk in g/day was weakly positively associated with LAZ at age 12 months (standardized β = 0.15, p = .012), whereas breast milk intake expressed as g/kg body weight per day was weakly negatively associated with LAZ at age 12 months (standardized β = −0.14, p = .021) but neither was associated with change in LAZ from age 12 to 18 months (Table 3). Adjustment of the models for maternal height, education, infant's weight at 9–10 months, household assets, household food insecurity, and family care index eliminated the associations between breast milk intake and LAZ‐score (Table 3). Percent of total energy intake from breast milk was not associated with either LAZ at age 12 months or change in LAZ, in both the bivariate analysis and the adjusted models (Table 3).
Table 3.
Associations between breast milk variablesa and LAZ at 12 months and change in LAZ between 12 and 18 monthsb , c
| Variables | LAZ‐scores at 12 months (n = 163) | Change in LAZ‐scores from 12 to 18 months (n = 158) | ||
|---|---|---|---|---|
| β (95% CI) | p value | β (95% CI) | p value | |
| Breast milk intake (g/day) | 0.15 (0.03 to 0.27) | .012 | 0.01 (−0.12 to 0.14) | .908 |
| Breast milk intake (g/day), adjusted modeld | −0.02 (−0.12 to 0.10) | .830 | 0.03 (−0.12 to 0.18) | .676 |
| Breast milk intake (g/kg/day) | −0.14 (−0.25 to −0.02) | .012 | 0.03 (−0.10 to 0.16) | .625 |
| Breast milk intake (g/kg/day), adjusted modeld | −0.03 (−0.12 to 0.18) | .676 | 0.01 (−0.14 to 0.16) | .871 |
| % total energy intake from breast milk intake | −0.05 (−0.18 to 0.09) | .493 | 0.05 (−0.09 to 0.20) | .468 |
| % total energy intake from breast milk intake, adjusted modeld | −0.08 (−0.19 to 0.04) | .186 | 0.11 (−0.05 to 0.28) | .167 |
Note. LAZ = length‐for‐age z‐score.
Variables measured when infants were 9–10 months old.
Analysis was done using linear regression.
Standardized regression coefficients.
Adjusted for maternal height, education, infants weight at 9–10 months, infant age, household assets, household food insecurity, and family care index.
Results of the analysis for the association between breast milk intake or percent of total energy intake from breast milk and developmental outcomes are shown in Table 4. Breast milk intake expressed as g/day or g/kg body weight/day was not associated with any of the developmental outcomes in unadjusted or adjusted models (Table 4). For percent of total energy intake from breast milk, there was a small but statistically significant negative association with fine motor scores both before (standardized β = −0.19, p = .003) and after adjusting (standardized β = −0.18, p = .015) for maternal height, education, infant's weight at 9–10 months, household assets, household food insecurity, and family care index (Table 4). Percent of total energy intake from breast milk was also negatively associated with language development (standardized β = −0.14, p = .033) in the bivariate analysis; however, the association was no longer significant in the adjusted model (Table 4). None of the breastfeeding variables was associated with gross or total motor scores.
Table 4.
| Variables | 18‐month developmental scores | |||||||
|---|---|---|---|---|---|---|---|---|
| Fine motor (n = 188) | Gross motor (n = 172) | Total motor (n = 185) | Language (n = 194) | |||||
| β (95% CI) | p value | β (95% CI) | p value | β (95% CI) | p value | β (95% CI) | p value | |
| Breast milk intake (g/day) | −0.02 (−0.13 to 0.10) | .771 | 0.06 (−0.07 to 0.18) | .356 | 0.06 (−0.05 to 0.18) | .277 | 0.07 (−0.04 to 0.19) | .204 |
| Breast milk intake (g/day), adjusted modeld | −0.05 (−0.17 to 0.08) | .436 | 0.04 (−0.10 to 0.18) | .588 | 0.03 (−0.06 to 0.16) | .603 | 0.08 (−0.04 to 0.20) | .170 |
| Breast milk intake (g/kg/day) | −0.08 (−0.20 to 0.03) | .168 | −0.02 (−0.15 to 0.11) | .594 | −0.04 (−0.16 to 0.07)0 | .473 | 0.05 (−0.07 to 0.16) | .403 |
| Breast milk intake (g/kg/day) adjusted modeld | −0.03 (−0.16 to 0.09) | .553 | 0.04 (−0.10 to 0.18) | .588 | 0.04 (−0.09 to 0.16) | .542 | 0.08 (−0.04 to 0.20) | .176 |
| % total energy intake from breast milk intake | −0.19 (−0.32 to −0.05) | .003 | −0.01 (−0.15 to 0.13) | .865 | −0.12 (−0.24 to 0.01) | .068 | −0.14 (−0.26 to −0.01) | .033 |
| % total energy intake from breast milk intake adjusted modeld | −0.18 (−0.32 to −0.05) | .007 | −0.04 (−0.19 to 0.12) | .655 | −0.14 (−0.24 to 0.001) | .051 | −0.11 (−0.24 to 0.02) | .100 |
Variables measured when infants were 9–10 months old.
Analysis was done using linear regression.
Standardized regression coefficients.
Adjusted for maternal height, education, infants weight at 9–10 months, infant age, household assets, household food insecurity, and family care index.
4. DISCUSSION
In the present study, we examined whether greater quantity of breast milk per day, or a greater percent of infant dietary intake from breast milk as compared to other foods, after age 6 months is associated with indicators of growth and development among Malawian children. We did not observe an association between either breast milk intake or percent of total energy intake from breast milk at 9–10 months and growth between 12 and 18 months among the study population. Breast milk intake was also not significantly associated with any of the developmental outcomes, whereas percent of total energy intake from breast milk had a weak negative association with fine motor developmental scores both in unadjusted and adjusted models.
Our study has a number of strengths: it had a large sample size, was adequately powered to detect any meaningful associations, and was based on measured breast milk intake rather than maternal breastfeeding recalls, as is the case with most other studies. In the present study, breast milk intake measurement preceded the outcomes we examined, enabling us to establish a temporal relationship and minimize the potential for reverse causality. The study was based on a randomly selected sample of the eligible children thus enabling generalizability of the results to the larger population of our study group. Finally, we controlled for some of the possible confounders of associations between infant diet and growth or development, including maternal height, education, and other socioeconomic variables.
The study also had some limitations. We did not measure the energy content of breast milk in the present sample, and instead used the published mean of 0.67 kcal/g of breast milk; thus, we may have underestimated or overestimated the true energy content of the breast milk of mothers in the present study. Additionally, breast milk was measured at 9–10 months and growth and development were measured at later ages. It is possible that breast milk intake at age 9–10 months was not indicative of the infant's intake during the entire period from 9 to 18 months and therefore had limited value in predicting growth and development at later ages. We previously showed that breast milk intake among the present population was largely predicted by infant weight (Kumwenda et al., 2015). Even though all infants gradually reduce breast milk intake as they grow older, it is also likely that the relative ranking (i.e., high vs. low consumers) of breast milk intake among children was sustained over a considerable time period. We did not measure birth size in our sample, and thus, we were unable to control for size at birth that is also an important determinant of growth during infancy and childhood (Arifeen, Black, Caulfield, Antelman, & Baqui, 2001). Nonetheless, the results for absolute breast milk intake and percent of total energy intake from breast milk were generally similar even though the latter is less likely to be confounded by infant weight and other factors associated with infant size. Finally, we observed a greater than anticipated attrition rate, however, because there were no statistically significant differences in baseline characteristics between those with incomplete data and those who were included in the analysis, we do not believe that this was a biased subsample. Overall, our results show that breast milk intake at 9–10 months is not associated with growth between 12 and 18 months or development at 18 months within our study population.
To our knowledge, there are no previous studies investigating associations between the amount of breast milk consumed in the second half of infancy and subsequent growth and development. Previous evidence for associations with other measures of breastfeeding practices is mixed. Some studies and reviews show lack of apparent association between breastfeeding practices (i.e., any breastfeeding, early initiation, exclusive, and continued breastfeeding) and growth among infants and younger children (Bhutta et al., 2008; Bork, Cames, Barigou, Cournil, & Diallo, 2012; Eriksen et al., 2017; Jones et al., 2014) and older children (Kramer et al., 2007; Kwok, Schooling, Lam, & Leung, 2010). In a recent systematic review and meta‐analysis of breastfeeding promotion studies, Giugliani, Horta, Loret de Mola, Lisboa, and Victora (2015) also demonstrate a lack of association between promotion of optimal breastfeeding practices and growth among children. On the other hand, some breastfeeding studies from both high (Alvarado, Tabares, Delisle, & Zunzunegui, 2005; Diaz et al., 1995; Martin, Smith, Mangtani, Frankel, & Gunnell, 2002) and low (Kuchenbecker et al., 2015; Onyango, Esrey, & Kramer, 1999; Simondon, Simondon, Costes, Delaunay, & Diallo, 2001) income countries have demonstrated positive associations between breastfeeding practices (exclusive breastfeeding, receiving breast milk at any time, and duration of breastfeeding) and growth. Because we could not compare our findings to evidence from studies that used amount of breast milk as an exposure, we cannot comment on the generalizability of our results beyond the study population. More data are needed to elucidate the relationship between breast milk intake and growth beyond the first 6 months of exclusive breastfeeding.
After controlling for possible confounding, we also did not find significant associations between amount of breast milk consumed and developmental outcomes. These findings complement published data from younger infants, on a related but slightly different study question. Dewey, Cohen, Brown, and Rivera (2001) in two randomized trials showed that infants exclusively breastfed to 6 months crawled earlier and (in one of the trials) were more likely to be walking by 12 months than those who received supplementary food from 4 months. The authors speculated that the observed difference was due to the greater consumption of breast milk in the exclusively breastfed than supplementary fed infants. Similar findings have been reported from studies assessing associations between breastfeeding practices such as initiation, exclusivity, and duration and developmental outcomes (Sacker, Quigley, & Kelly, 2006; Thorsdottir, Gunnarsdottir, Kvaran, & Gretarsson, 2005; Vestergaard et al., 1999). In these studies, the authors did not specifically attribute the observed associations to breast milk alone; however, they did control for possible confounding and thus it is plausible that their observed associations are explained by breast milk intake.
The inverse relationship between percent of energy intake from breast milk and fine motor developmental scores in our sample is somewhat puzzling, considering that even after 6 months of exclusive breastfeeding, breast milk continues to be an important source of nutrients essential for child growth and development. This finding may be due to the influence of other nonnutrition factors that may have mediated the relationship between amount of breast milk and fine motor development, for instance, maternal education. In our previous study, we reported an inverse association between amount of breast milk intake and number of years mothers spend in school (Kumwenda et al., 2015). It has been reported that maternal education is crucial for fine motor development (Venetsanou & Kambas, 2009) thus demonstrating that other environmental factors may be more influential than amount of breast milk on fine motor development. Sacker et al. (2006) demonstrated that an association between breastfeeding and fine motor delay became insignificant when they adjusted for biological, socioeconomic, and psychosocial variables. However, in our study, the negative association of the percentage of energy intake from breastmilk with fine motor scores remained significant when adjusting for maternal education and other characteristics. Torsvik, Ueland, Markestad, Midttun, and Monsen (2015) observed that impairment in motor function, including fine motor skills associated with long‐term exclusive breastfeeding was attributed to deficiency of Vitamin B12 among the infants. We were unable to examine whether Vitamin B12 deficiency may account for our results because we did not measure infant Vitamin B12 status.
The lack of apparent association between breast milk intake and the growth and developmental outcomes in our study may be an indication that there are other unmeasured factors that are more important than the amount of breast milk or that mask the benefits of higher quantities of breast milk for growth and development. The mean daily total energy intake was well above the mean requirement, implying infants in the present study had adequate daily energy intake. In other analyses of complementary feeding practices, we found that 58% and 62% of children met the WHO criterion for minimum dietary diversity and meal frequency, respectively. Thus, overall, complementary feeding was neither very suboptimal nor very optimal. Other factors that may play a role include asymptomatic or symptomatic infections, environmental enteropathy, and an unfavourable gut microbiome, all of which may significantly impact growth and development of infants in settings such as those of our study site (Maleta et al., 2015).
CONFLICTS OF INTEREST
The authors declare that they have no conflicts of interest.
CONTRIBUTIONS
KGD, MJH, PA, and KM designed the breast milk intake study and supervised the research. MA, ELP, JP, JH, and UA coordinated and supervised data collection. CK conducted the research, analysed the data, and wrote the draft manuscript. All authors significantly contributed to the manuscript, read, and approved the final manuscript.
ACKNOWLEDGMENT
We are grateful to the iLiNS‐DOSE participants, data collection team, and site supervisors in Mangochi and Namwera for their support and help during the implementation of the study, and the iLiNS Project Steering Committee for oversight, guidance, and leadership. We would also like to express our gratitude to Jan Peerson and Lotta Alho for providing statistical support. Funding was provided by Mathile Institute for the Advancement of Human Nutrition, the International Atomic Energy Agency, the University of Tampere, and the Bill & Melinda Gates Foundation.
Kumwenda C, Hemsworth J, Phuka J, et al. Association between breast milk intake at 9–10 months of age and growth and development among Malawian young children. Matern Child Nutr. 2018;14:e12582 10.1111/mcn.12582
Registration of the trial: This study reported herein was a substudy within the International Lipid‐based Nutrient Supplement DOSE trial; ClinicalTrials.gov ID#NCT00945698.
REFERENCES
- Abubakar, A. , Holding, P. , van Baar, A. , Newton, C. R. , & van de Vijver, F. J. (2008). Monitoring psychomotor development in a resource‐limited setting: An evaluation of the Kilifi Developmental Inventory. Annals of Tropical Paediatrics, 28(3), 217–226. 10.1179/146532808X335679 [DOI] [PMC free article] [PubMed] [Google Scholar]
- Alcock, K. J. , Prado, E. L. , Rimba, K. , Kalu, R. , Newton, C. R. J. C. , & Holding, P. (2010). Parent report of language development in illiterate families—the CDI in two developing country settings In Paper presented at the the 21st congress of the international society for the study of behavioral development. Lusaka, Zambia: Lusaka, Zambia. [Google Scholar]
- Alvarado, B. E. , Tabares, R. E. , Delisle, H. , & Zunzunegui, M. V. (2005). Maternal beliefs, feeding practices and nutritional status in Afro‐Colombian infants. Archivos Latinoamericanos de Nutrición, 55(1), 55–63. [PubMed] [Google Scholar]
- Arifeen, S. E. , Black, R. E. , Caulfield, L. E. , Antelman, G. , & Baqui, A. H. (2001). Determinants of infant growth in the slums of Dhaka: Size and maturity at birth, breastfeeding and morbidity. European Journal of Clinical Nutrition, 55(3), 167–178. [DOI] [PubMed] [Google Scholar]
- Arimond, M. , Abbeddou, S. , Kumwenda, C. , Okronipa, H. , Hemsworth, J. , Jimenez, E. Y. , … Dewey, K. G. (2017). Impact of small quantity lipid‐based nutrient supplements on infant and young child feeding practices at 18 months of age: Results from four randomized controlled trials in Africa. Maternal & Child Nutrition, 13(3). 10.1111/mcn.12377 [DOI] [PMC free article] [PubMed] [Google Scholar]
- Bhutta, Z. A. , Ahmed, T. , Black, R. E. , Cousens, S. , Dewey, K. , Giugliani, E. , … Child Undernutrition Study, Group (2008). What works? Interventions for maternal and child undernutrition and survival. Lancet, 371(9610), 417–440. 10.1016/S0140-6736(07)61693-6 [DOI] [PubMed] [Google Scholar]
- Bork, K. , Cames, C. , Barigou, S. , Cournil, A. , & Diallo, A. (2012). A summary index of feeding practices is positively associated with height‐for‐age, but only marginally with linear growth, in rural Senegalese infants and toddlers. The Journal of Nutrition, 142(6), 1116–1122. 10.3945/jn.112.157602 [DOI] [PubMed] [Google Scholar]
- Coates, J. , Swindale, A. , & Bilinsky, P. (2007). Household food insecurity access scale (HFIAS) for measurement of food access: Indicator guide (Vol. 3). Washington, DC: FHI 360/FANTA. [Google Scholar]
- Coward, W. A. , Cole, T. J. , Sawyer, M. B. , & Prentice, A. M. (1982). Breast‐milk intake measurement in mixed‐fed infants by administration of deuterium oxide to their mothers. Human Nutrition. Clinical Nutrition, 36(2), 141–148. [PubMed] [Google Scholar]
- Dewey, K. G. (2000). Complementary feeding and breastfeeding. Pediatrics, 106(5), 1301. [PubMed] [Google Scholar]
- Dewey, K. G. (2013). The challenge of meeting nutrient needs of infants and young children during the period of complementary feeding: An evolutionary perspective. The Journal of Nutrition, 143(12), 2050–2054. 10.3945/jn.113.182527 [DOI] [PMC free article] [PubMed] [Google Scholar]
- Dewey, K. G. , Cohen, R. J. , Brown, K. H. , & Rivera, L. L. (2001). Effects of exclusive breastfeeding for four versus six months on maternal nutritional status and infant motor development: Results of two randomized trials in Honduras. The Journal of Nutrition, 131(2), 262–267. [DOI] [PubMed] [Google Scholar]
- Dewey, K. G. , & Lonnerdal, B. (1986). Infant self‐regulation of breast milk intake. Acta Paediatrica Scandinavica, 75(6), 893–898. [DOI] [PubMed] [Google Scholar]
- Dewey, K. G. , Pan American Health Organization, & WHO (2003). Guiding principles for complementary feeding of the breastfed child (pp. 37p). Washington, DC, USA: PAHO, Washington, DC, USA. [Google Scholar]
- Diaz, S. , Herreros, C. , Aravena, R. , Casado, M. E. , Reyes, M. V. , & Schiappacasse, V. (1995). Breast‐feeding duration and growth of fully breast‐fed infants in a poor urban Chilean population. The American Journal of Clinical Nutrition, 62(2), 371–376. [DOI] [PubMed] [Google Scholar]
- Eriksen, K. G. , Johnson, W. , Sonko, B. , Prentice, A. M. , Darboe, M. K. , & Moore, S. E. (2017). Following the World Health Organization's recommendation of exclusive breastfeeding to 6 months of age does not impact the growth of rural gambian infants. The Journal of Nutrition, 147(2), 248–255. 10.3945/jn.116.241737 [DOI] [PMC free article] [PubMed] [Google Scholar]
- Fenson, L. , Marchman, V. A. , Thal, D. J. , Dale, P. S. , Reznick, J. S. , & Bates, E. (2007). MacArthur‐Bates communicative development inventories: User's guide and technical manual (Second Edition ed.). Baltimore: Brookes Publishing. [Google Scholar]
- Ferguson, E. L. , Gadowsky, S. L. , Huddle, J. M. , Cullinan, T. R. , Lehrfeld, J. , & Gibson, R. S. (1995). An interactive 24‐h recall technique for assessing the adequacy of trace mineral intakes of rural Malawian women; its advantages and limitations. European Journal of Clinical Nutrition, 49(8), 565–578. [PubMed] [Google Scholar]
- Butte, N. F. , Lopez‐Alarcon, M. G. , & Garza, C. (2002). Nutrient adequacy of exclusive breastfeeding for the term infant during the first six months of life. Geneva, Switzerland: World Health Organization. [Google Scholar]
- Giugliani, E. R. , Horta, B. L. , Loret de Mola, C. , Lisboa, B. O. , & Victora, C. G. (2015). Effect of breastfeeding promotion interventions on child growth: A systematic review and meta‐analysis. Acta Paediatrica. Supplement, 104(467), 20–29. 10.1111/apa.13160 [DOI] [PubMed] [Google Scholar]
- Haisma, H. , Coward, W. A. , Albernaz, E. , Visser, G. H. , Wells, J. C. , Wright, A. , & Victora, C. G. (2003). Breast milk and energy intake in exclusively, predominantly, and partially breast‐fed infants. European Journal of Clinical Nutrition, 57(12), 1633–1642. 10.1038/sj.ejcn.1601735 [DOI] [PubMed] [Google Scholar]
- Hamadani, J. D. , Baker‐Henningham, H. , Tofail, F. , Mehrin, F. , Huda, S. N. , & Grantham‐McGregor, S. M. (2010). Validity and reliability of mothers' reports of language development in 1‐year‐old children in a large‐scale survey in Bangladesh. Food and Nutrition Bulletin, 31(2 Suppl), S198–S206. [DOI] [PubMed] [Google Scholar]
- Hemsworth, J. , Kumwenda, C. , Arimond, M. , Maleta, K. , Phuka, J. , Rehman, A. M. , … Ferguson, E. L. (2016). Lipid‐based nutrient supplements increase energy and macronutrient intakes from complementary food among Malawian infants. The Journal of Nutrition, 146(2), 326–334. 10.3945/jn.115.215327 [DOI] [PubMed] [Google Scholar]
- IAEA (2010). Stable isotope technique to assess intake of human milk in breastfed infants. Vienna: IAEA. [Google Scholar]
- Jones, A. D. , Ickes, S. B. , Smith, L. E. , Mbuya, M. N. , Chasekwa, B. , Heidkamp, R. A. , … Stoltzfus, R. J. (2014). World Health Organization infant and young child feeding indicators and their associations with child anthropometry: A synthesis of recent findings. Maternal & Child Nutrition, 10(1), 1–17. 10.1111/mcn.12070 [DOI] [PMC free article] [PubMed] [Google Scholar]
- Kariger, P. , Frongillo, E. A. , Engle, P. , Britto, P. M. , Sywulka, S. M. , & Menon, P. (2012). Indicators of family care for development for use in multicountry surveys. Journal of Health, Population, and Nutrition, 30(4), 472–486. [DOI] [PMC free article] [PubMed] [Google Scholar]
- Kramer, M. S. , Matush, L. , Vanilovich, I. , Platt, R. W. , Bogdanovich, N. , Sevkovskaya, Z. , … Group, Probit Study (2007). Effects of prolonged and exclusive breastfeeding on child height, weight, adiposity, and blood pressure at age 6.5 y: Evidence from a large randomized trial. The American Journal of Clinical Nutrition, 86(6), 1717–1721. [DOI] [PubMed] [Google Scholar]
- Kuchenbecker, J. , Jordan, I. , Reinbott, A. , Herrmann, J. , Jeremias, T. , Kennedy, G. , … Krawinkel, M. B. (2015). Exclusive breastfeeding and its effect on growth of Malawian infants: Results from a cross‐sectional study. Paediatrics International Child Health, 35(1), 14–23. 10.1179/2046905514Y.0000000134 [DOI] [PMC free article] [PubMed] [Google Scholar]
- Kumwenda, C. , Dewey, K. G. , Hemsworth, J. , Ashorn, P. , Maleta, K. , & Haskell, M. J. (2014). Lipid‐based nutrient supplements do not decrease breast milk intake of Malawian infants. The American Journal of Clinical Nutrition, 99(3), 617–623. 10.3945/ajcn.113.076588 [DOI] [PubMed] [Google Scholar]
- Kumwenda, C. , Hemsworth, J. , Phuka, J. , Arimond, M. , Ashorn, U. , Maleta, K. , … Dewey, K. G. (2015). Factors associated with breast milk intake among 9‐10‐month‐old Malawian infants. Maternal & Child Nutrition. 10.1111/mcn.12199 [DOI] [PMC free article] [PubMed] [Google Scholar]
- Kwok, M. K. , Schooling, C. M. , Lam, T. H. , & Leung, G. M. (2010). Does breastfeeding protect against childhood overweight? Hong Kong's 'Children of 1997′ birth cohort. International Journal of Epidemiology, 39(1), 297–305. 10.1093/ije/dyp274 [DOI] [PubMed] [Google Scholar]
- Maleta, K. M. , Phuka, J. , Alho, L. , Cheung, Y. B. , Dewey, K. G. , Ashorn, U. , … Ashorn, P. (2015). Provision of 10‐40 g/d lipid‐based nutrient supplements from 6 to 18 months of age does not prevent linear growth faltering in Malawi. The Journal of Nutrition, 145(8), 1909–1915. 10.3945/jn.114.208181 [DOI] [PubMed] [Google Scholar]
- Martin, R. M. , Smith, G. D. , Mangtani, P. , Frankel, S. , & Gunnell, D. (2002). Association between breast feeding and growth: The Boyd‐Orr cohort study. Archives of Disease in Childhood ‐ Fetal and Neonatal Edition, 87(3), F193–F201. [DOI] [PMC free article] [PubMed] [Google Scholar]
- Onyango, A. W. , Esrey, S. A. , & Kramer, M. S. (1999). Continued breastfeeding and child growth in the second year of life: A prospective cohort study in western Kenya. Lancet, 354(9195), 2041–2045. 10.1016/S0140-6736(99)02168-6 [DOI] [PubMed] [Google Scholar]
- Rogier, E. W. , Frantz, A. L. , Bruno, M. E. , Wedlund, L. , Cohen, D. A. , Stromberg, A. J. , & Kaetzel, C. S. (2014). Secretory antibodies in breast milk promote long‐term intestinal homeostasis by regulating the gut microbiota and host gene expression. Proceedings of the National Academy of Sciences of the United States of America, 111(8), 3074–3079. 10.1073/pnas.1315792111 [DOI] [PMC free article] [PubMed] [Google Scholar]
- Sacker, A. , Quigley, M. A. , & Kelly, Y. J. (2006). Breastfeeding and developmental delay: Findings from the millennium cohort study. Pediatrics, 118(3), e682–e689. 10.1542/peds.2005-3141 [DOI] [PubMed] [Google Scholar]
- Simondon, K. B. , Simondon, F. , Costes, R. , Delaunay, V. , & Diallo, A. (2001). Breast‐feeding is associated with improved growth in length, but not weight, in rural Senegalese toddlers. The American Journal of Clinical Nutrition, 73(5), 959–967. [DOI] [PubMed] [Google Scholar]
- Thorsdottir, I. , Gunnarsdottir, I. , Kvaran, M. A. , & Gretarsson, S. J. (2005). Maternal body mass index, duration of exclusive breastfeeding and children's developmental status at the age of 6 years. European Journal of Clinical Nutrition, 59(3), 426–431. 10.1038/sj.ejcn.1602092 [DOI] [PubMed] [Google Scholar]
- Torsvik, I. K. , Ueland, P. M. , Markestad, T. , Midttun, O. , & Monsen, A. L. (2015). Motor development related to duration of exclusive breastfeeding, B vitamin status and B12 supplementation in infants with a birth weight between 2000‐3000 g, results from a randomized intervention trial. BMC Pediatrics, 15(1), 218 10.1186/s12887-015-0533-2 [DOI] [PMC free article] [PubMed] [Google Scholar]
- UNICEF , & WHO (2003). Global strategy for infant and young child feeding. Geneva, Switzerland: WHO. [Google Scholar]
- Venetsanou, F. , & Kambas, A. (2009). Environmental factors affecting preschoolers' motor development. Early Childhood Education Journal, 37(4), 319–327. 10.1007/s10643-009-0350-z [DOI] [Google Scholar]
- Vestergaard, M. , Obel, C. , Henriksen, T. B. , Sorensen, H. T. , Skajaa, E. , & Ostergaard, J. (1999). Duration of breastfeeding and developmental milestones during the latter half of infancy. Acta Paediatrica, 88(12), 1327–1332. [DOI] [PubMed] [Google Scholar]
- Vyas, S. , & Kumaranayake, L. (2006). Constructing socio‐economic status indices: How to use principal components analysis. Health Policy and Planning, 21(6), 459–468. 10.1093/heapol/czl029 [DOI] [PubMed] [Google Scholar]
- Walker, A. (2010). Breast milk as the gold standard for protective nutrients. The Journal of Pediatrics, 156(2 Suppl), S3–S7. 10.1016/j.jpeds.2009.11.021 [DOI] [PubMed] [Google Scholar]
- WHO (1998). Complementary feeding of young children in developing countries: A review of current scientific knowledge. Geneva, Switzerand: World Health Organization. [Google Scholar]
- WHO, Multicentre Growth Reference, & Study Group (2006). WHO child growth standards based on length/height, weight and age. Acta Paediatrica. Supplement, 450, 76–85. [DOI] [PubMed] [Google Scholar]