Abstract
Droplet based single cell transcriptomics has recently enabled parallel screening of tens of thousands of single cells. Clustering methods that scale for such high dimensional data without compromising accuracy are scarce. We exploit Locality Sensitive Hashing, an approximate nearest neighbour search technique to develop a de novo clustering algorithm for large-scale single cell data. On a number of real datasets, dropClust outperformed the existing best practice methods in terms of execution time, clustering accuracy and detectability of minor cell sub-types.
INTRODUCTION
Biological systems harbor substantial heterogeneity, which is hard to decode by profiling population of cells. Over the past few years, technological advances enabled genome wide profiling of RNA, DNA, protein and epigenetic modifications in individual cells (1). Amongst the most recent developments, in-drop (within a droplet) barcoding has gained a lot of attention as it enables 3′ mRNA counting of thousands of individual cells in a matter of several minutes to few hours. With the growing popularity of the assay and availability of affordable commercial platforms, a sharp increase is expected in average sample size of future investigations. A recent work produced an unprecedented ∼250k single cell expression profiles as part of a single study (2). This, gives us an idea about the scale of the future single cell experiments. Since the introduction of single cell RNA sequencing (scRNA-seq) technologies, a number of clustering techniques have been devised while accounting for the unique characteristics of the new data type (3–6). However, a majority of these techniques struggle to scale when studies feature several tens of thousands of transcriptomes. In fact, methods developed solely for such ultra large datasets (henceforth referred to as droplet-seq’ data) are either computationally expensive (7) or over-simplistic (2).
Network based clustering techniques have been used effectively for clustering sc-RNA-seq data (8,9). An exhaustive nearest neighbour search requires quadratic-time tabulation of pair-wise distances. For large sample sizes, this approach turns out to be significantly slow. Seurat, one of the early-proposed methods for droplet-seq data analysis, performs sub-sampling of transcriptomes prior to nearest-neighbour based network construction. Random sampling can be irreversibly lossy when one of the objectives is to identify rare cell populations. In a recent work, Zheng and colleagues (2) used k-means as the method for clustering droplet-seq data. While k-means is reasonably fast, it suffers from two major drawbacks: (i) User needs to specify the number of clusters. (ii) The method struggles to identify clusters of non-spherical shapes.
To address the above shortcomings, we developed dropClust, a scalable yet accurate clustering algorithm for droplet-seq data. dropClust uses Locality Sensitive Hashing (LSH) to find nearest neighbours of individual transcriptomes. This neighbourhood information is used to perform Structure Preserving Sampling (SPS) of the expression profiles, which retains relatively higher number of representative transcriptomes from smaller sub-populations. The sampling technique used in dropClust helps in accelerating unsupervised cell grouping without compromising accuracy.
We evaluated the efficacy of dropClust first on a large cohort of peripheral blood mononuclear cells (PBMCs), annotated based on similarity with purified, major immune cell sub-types (2). Besides the common cell types, a number of minor immune cell sub-populations were identified by dropClust. In fact, clusters yielded by dropClust were found to be maximally concordant (14% improvement in Adjusted Rand Index or ARI with respect to existing best practice methods) with the available cell type annotations. Its performance was consistent on two more droplet-seq datasets curated from independent studies. We also performed a simulation study leveraging a published droplet-seq data containing expression profiles of Jurkat and 293T cells mixed in vitro at equal proportions. Amongst all tested clustering methods, dropClust was found most tolerant to bioinformatic dilution of any of the two cell types, thus providing evidence for its sensitivity to minor cell sub-populations.
MATERIALS AND METHODS
Description of the datasets
We used two datasets from a recent work by Zheng et al. (2). The first single-cell-RNA-seq (scRNA-seq) data consists of ∼68 000 PBMCs, collected from a healthy donor. Single cell expression profiles of 11 purified subpopulations of PBMCs are used as reference for cell type annotation. This dataset served as a gold standard for performance assessment of the clustering techniques. The second dataset from the same study contains expression profiles of Jurkat and 293T cells, mixed in vitro at equal proportions (50:50). All ∼3200 cells of this data are assigned their respective lineages through SNV analysis (2). Expression matrices for both these datasets were downloaded from www.10xgenomics.com.
Two additional datasets were used to benchmark the performance of the clustering algorithms. The datasets contain expression profiles of ∼49k mouse retina cells (7) and ∼2700 mouse embryonic stem (ES) cells respectively (10).
To evaluate the congruence between dropClust and Seurat, we used a doplet-seq data containing ∼20K transcriptomes sampled from the arcuate-median eminence complex (Arc-ME) region of mouse brain (11).
Data preprocessing, normalization and gene selection
Expression matrices for all the datasets were downloaded from publicly available repositories. For each dataset, the genes whose UMI counts were >3 in at least three cells were retained. For PBMC data, only ∼7000 genes qualified this criterion. The filtered data matrix was then subjected to UMI normalization that involves dividing UMI counts by the total UMI counts in each cell and multiplying the scaled counts by the median of the total UMI counts across cells (2). One thousand most variable genes were selected based on their relative dispersion (variance/mean) with respect to the expected dispersion across genes with similar average expression (2,7). Normalized expression matrix with the selected genes thus obtained was log2 transformed after addition of 1 as a pseudo count.
dropClust overview
dropClust employs Locality Sensitive Hashing (LSH), a logarithmic-time algorithm to determine approximate neighbourhood for individual transcriptomes. An approximate k nearest neighbour network of individual transcriptomes thus obtained, is subjected to Louvian (12), a widely used network partitioning algorithm. While Louvian based topological clustering delineates majority of the prevalent cell types, finer subpopulations of seemingly similar cells within large clusters are often not separated at a satisfactory precision (data not shown). Clusters found using Louvian are therefore used as points of reference for further down-sampling of the transcriptomes. dropClust uses an exponential decay function to select higher number of expression profiles from clusters of relatively smaller sizes. Simulated annealing is used to perform hyperparameter search with the aim of restricting the sample size close to a number, manageable by hierarchical clustering. The proposed sampling strategy preserves the rare cell clusters even when the sample sizes are fairly small compared to the population size. The complete dropClust work-flow is illustrated in Supplementary Figure S1.
Structure preserving sampling of transcriptomes
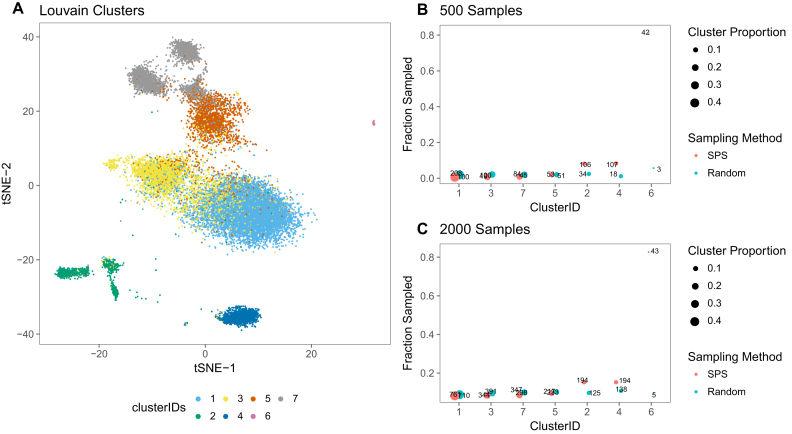
It is hard to avoid subsampling while managing high dimensional genomic data. However, random sub-sampling might result in loss of rare sub-populations. The proposed dropClust pipeline introduces a novel data sampling approach that preserves distinct structural properties of the data. This is achieved in two steps: (a) a fairly large (usually minimum of 20 000 and a third of the whole population) number of scRNA-seq profiles are randomly selected from the complete set of transcriptomes and then subjected to a fast, approximate graph based clustering algorithm; (b) the topological clusters thus obtained are used to guide further sub-sampling of the transcriptomes in a way that retains relatively higher number of cells from smaller clusters, which were otherwise ignored in case of random sub-sampling (Figure 1).
Figure 1.
(A) 2D embedding of 20K PBMC transcriptomes, chosen randomly from the complete dataset. Separate colours are used for the Louvain- predicted clusters. (B) For each cluster, the number of sampled cells is shown using both SPS and random sampling. Size of the Louvain clusters are indicated by the size of the bubbles. X-axis shows cluster ID, whereas Y-axis shows the sampling fraction. True number of cells are also indicated on each of the bubbles. In this case 500 transcriptomes are sampled through SPS. (C) Similar figure with 2000 as sample size.
To construct the network, top-k approximate nearest neighbours (k = 10 by default) are identified rapidly by employing Locality Sensitive Hashing (LSH) (13). A faster and more accurate implementation of the original LSH, called LSHForest is used for this purpose (14). The nearest neighbour network (NNN) of transcriptomes thus created is subjected to Louvain (12), a widely used method for detecting community structures in networks. Notably, Seurat (7) uses Shared Nearest Neighbours (SNN) for network construction at one specific stage. While construction of NNN using LSH takes O(nlog n) time (14), building SNN requires O(n2) time (8), where n denotes the number of single cell expression profiles. The choice of LSH to search nearest neighbours leads to a dramatic reduction in computation time. Since LSH is an approximate method for nearest neighbour search, the clusters obtained need further refinement. Moreover, Louvain offers limited control for determining cluster resolution.
Sampling from primary clusters
To ensure selection of sufficient representative transcriptomes from small clusters, an exponential decay function (15) is used to determine the proportion of transciptomes to be sampled from each cluster. For ith cluster, the proportion of expression profiles pi was obtained as follows.
 |
(1) |
where Si is the size of cluster i, K is a scaling factor, pi is the proportion of cells to be sampled from the ith Louvain cluster. pl and pu are lower and upper bounds of the proportion value respectively. Based on the above equation we may show the following:
 |
(2) |
 |
(3) |
Since Equation (1) does not explicitly impose any upper bound on the final sample size, one may be left with an arbitrarily high or low number of single cell transcriptomes for final clustering. To address this, dropClust allows user specify his preferred sample size and employs simulated annealing (SA) (16) to come up with the right values for pl, pu and K. This operation may formally be described as follows:
 |
(4) |
where τ denotes the user specified sample size. We used simulated annealing implementation from the GenSA R package (16).
Choosing the best principal components
For the cells obtained through structure preserving sampling (SPS), gene selection is performed based on Principal Component Analysis (PCA). It is well known that clustering outcome is often improved by careful selection of genes. PCA has widely been used for this purpose (7,17). Traditionally, genes with high loadings on the top few principal components (PCs) are considered to be most informative. This method, in some sense, guarantees selection of the most variable genes. However, expression variability may not necessarily explain cell type heterogeneity. For gene selection based on high PC loadings, dropClust uses PCs that not only explain a sizeable proportion of the observed expression variance but also manifest a large proportion of phenotypic diversity.
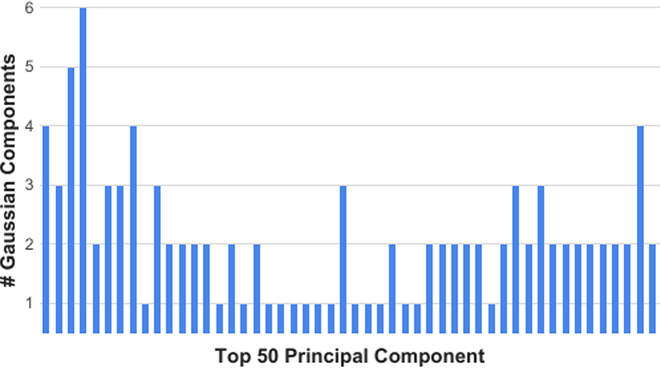
To this end dropClust uses mixtures of Gaussians to detect PCs with multi-modal distribution of the projected transcriptomes. For each of the top 50 PCs, we estimate the explained heterogeneity by inspecting the multi-modal nature of its marginal distribution. Gaussian Mixture Model (GMM) (18), supplemented with Bayesian Information Criterion (BIC) (19) is used to determine the number of modes corresponding to each PC. Each of these modes is expected to represent a cell type. R package mclust is used for this purpose. PCs, modelled by three or more Gaussians are used for PC-loading based gene selection (17). When applied on the real datasets we commonly encountered cases where a top PC featured a small number of modes whereas a trailing PC featured higher levels of modality (Figure 2, Supplementary Figures S2 and S3). Top 200 high-loading genes are retained for the subsequent clustering step.
Figure 2.
Barplot depicting the number of estimated Gaussian components for each of the top 50 principal components derived from the PBMC data.
Clustering of sampled cells
Average-linkage hierarchical clustering is performed to group the sampled cells based on expression of the 200 selected genes. Euclidean distance is used as the measure of dissimilarity. To cut the dendogram cutreeDynamic() is used from the dynamicTreeCut R package (20,21).
Post-hoc cluster assignment for left out transcriptomes
Cells that are not subjected to hierarchical clustering are assigned their respective clusters of origin using a simple post-hoc cluster assignment strategy. To achieve this, locality preserving hash codes are generated for the clustered transcriptomes, using LSH-Forest. For each of the left out transcriptomes k (k = 5, by default) approximate nearest neighbours are then found through LSH queries. Each unallocated transcriptome is assigned the cluster of origin for which the most number of representatives are found in its corresponding set of k nearest neighbours. Ties for cluster assignment are broken at random.
The rationale behind parameter selection for various methods can be found in the Supplementary Data (Section 1). We probed into the possiblity of producing spurious clusters due to technical bias such as library-depth. However, we didnt find any clear evidence of such events (Supplementary Figure S8).
2D embedding of transcriptomes for visualization
The 2D embedding of samples is carried out in two steps. In the first step t-SNE is applied to transcriptomes obtained through SPS. Top 200 PCA-selected genes are used for this purpose. In the next step, remaining transcriptomes are allocated positions in the pre-existing 2D map of the sampled cells. To perform this, we borrow the sets of k nearest neighbours, found at the time of post-hoc cluster assignment. Coordinates for each newly added point are derived by averaging t-SNE coordinate values of neighbours that belonged to its cluster of origin.
Differential expression of genes
To speed up the differential expression (DE) analyses, we consider 100 randomly chosen transcriptomes from each cluster. Only genes with count >3 in at least 0.5% of these cells are retained for the analysis. Fast nonparametric, DE analysis tool NODES is used to to make DE gene calls with 0.05 as the cut off value for false discovery rate (FDR) and a fold change of 1.2 (BioRxiv: https://doi.org/10.1101/049734). Among the DE genes, ones that are significantly upregulated in a specific cluster with respect to each of remaining clusters are named cell type specific genes.
Simulation of rare cell population
The dataset containing Jurkat and 293T cells at equal ratio was used for performing simulations to assess detectability of minor cell populations. Cell type identity of each transcriptome of this dataset was determined by SNV analysis (2). To introduce rareness, we forcibly reduced the frequency of one of the cell types. To prevent bias, we performed these experiments by treating both cell types as rare in separate simulations. In simulated datasets, the proportion of rare cell transcriptomes was varied among 1%, 2.5%, 5% and 10%. For each of these specified concentrations, 10 datasets were created by independent sub-sampling of transcriptomes of a specific type. The transcriptomes of the major cell type were not subjected to any kind of sampling. Since this procedure was repeated for both the cell types, for each concentration a total of 20 datasets were produced.
We used F1-score as a measure for detectability of rare cell clusters. The score is defined as follows.
 |
(5) |
To compute the above score we first associated the predicted cluster that contained the majority of the rare cells to the rare cell group. Following this, recall was defined as the ratio between the number of true rare cells within the predicted rare cell cluster and the total number of known rare cells. On the other hand, precision was defined as the ratio between the number of known rare cells within the predicted rare cell group and the total number of cells in the predicted rare cell group.
RESULTS AND DISCUSSION
Analysis of ∼68K human PBMC data
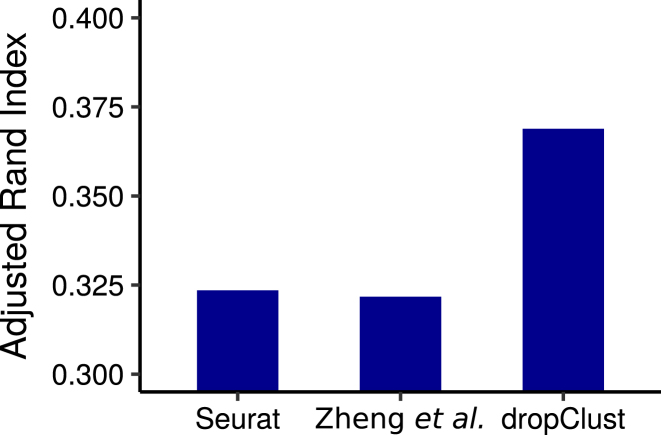
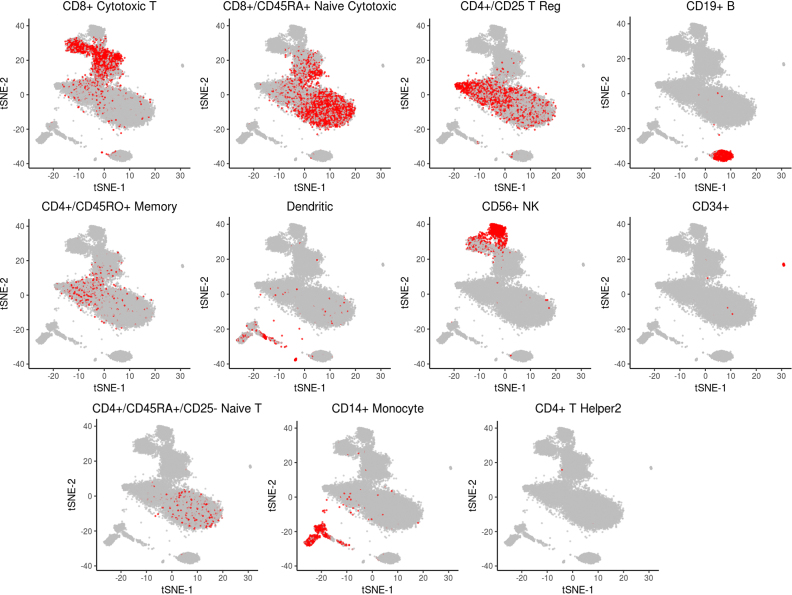
We applied dropClust first on a collection of ∼68K human peripheral blood mononuclear cells (PBMC), annotated based on similarity with matched single cell transcriptomes of 11 purified immune cell subpopulations, purified using fluorescence-activated cell sorting (FACS) (2). We used this information to benchmark the performance of the cell clustering methods under investigation. For each method, concordance between cluster assignment and cell type annotation was measured by Adjusted Rand Index (ARI). Among all methods, dropClust maximized the ARI (Figures 3 and 4).
Figure 3.
Bars show the ARI indexes obtained by comparing clustering outcomes with cell-type annotations.
Figure 4.
Localization of PBMC transcriptomes of same type (based on annotation) on the 2D embedding produced by dropClust. Each sub-figure corresponds to one of the well known immune cell types considered for benchmarking clustering accuracy by Zheng et al. (2).
Identification of cell-type specific Marker
Differential expression (DE) analysis was carried out between each pair of clusters to identify the cell type specific genes for each sub-population. (Table 1; Supplementary Figure S9). Details about the mapping of the dropClust predicted clusters to their respective potential cell types can be found in the Supplementary Data.
Table 1. Markers used for cell type inference from the PBMC data.
| Cluster ID | Potential cell type | Markers |
|---|---|---|
| 1 | Naive T cells | CD27 (22), CCR7 (23), CD8A, CD8Ba |
| 2 | CD4+ memory cells | IL7R (24), CD27 (22), CCR7 (23) |
| 3 | NKT cells | ZNF683 (25,26) (UniProtKB - Q8IZ20), CD8A, CD8Ba |
| 4 | B cells | CD79A (27), CD37 (28) |
| 5 & 7 | CD8+ T cells | GZMK (29), CD8A, CD8Ba |
| 6 | NK cells | CD160 (30,31), NKG7 (32), GNLY (33), CD247 (34), CCL3 (35), GZMB (36) |
| 8 & 9 | CD16+ and CD14+ monocytes | CD68 (37), CD16 (FCGR3A) (38), CD14 (38), S100A12 (39,40) |
| 10 | Regulatory T cells | CCR10, CD25(IL2RA)a, CD52 (41), CMTM7, FOXP3 (42)a |
| 11 | Monocyte derived dendritic cells | CST3 (43), CD1C (44,45), FCER1A (43) |
| 12 | Megakaryocyte progenitors | PF4 (46),PPBP (47), PLA2G12A (48) |
| 13 | Progenitor-NK cells | ID2 (49,50) |
| 14 | Plasmacytoid dendritic cells | GZMB (51), CD123 (IL3RA) (52) |
aMarkers that are well-known but failed to qualify the gene selection criteria.
We could associate the predicted groups of transcriptomes with known cell-types based on marker gene expression. Such associations were not always unambiguous. There are two principal reasons for such ambiguities: (i) Surface protein concentration is not always linearly related to the expression of the corresponding gene. Well known surface markers are commonly found having low expression. (ii) High drop-out rates and lack of sequencing depth cause prevalence of zeros as expression estimate. As a result, cell type specific yet low expressed genes are often not detected in single cell assays. Under these constraints, we tried to gather as much evidence as possible to assign a putative cell type to each of the detected PBMC clusters.
We identified all major lymphoid and myeloid sub-populations including a number of minor subtypes. Among the populous cell-subtypes we detected naive, memory and cytotoxic T cells, B cells, natural killers (NK), natural kill T cells (NKT cells), CD14+ and CD16+ blood monocytes and monocyte derived dendritic cells. Besides these we also found a number of minor cell types including plasmocytoid dendritic cells, regulatory T cells (Tregs), progenitor NK cells and circulating megakaryocyte progenitors (Figure 5). Supplementary Figure S11 shows the heatmap of the cell type specific differentially up-regulated genes.Table 1 lists the cell-type markers with respective predicted clusters.
Figure 5.
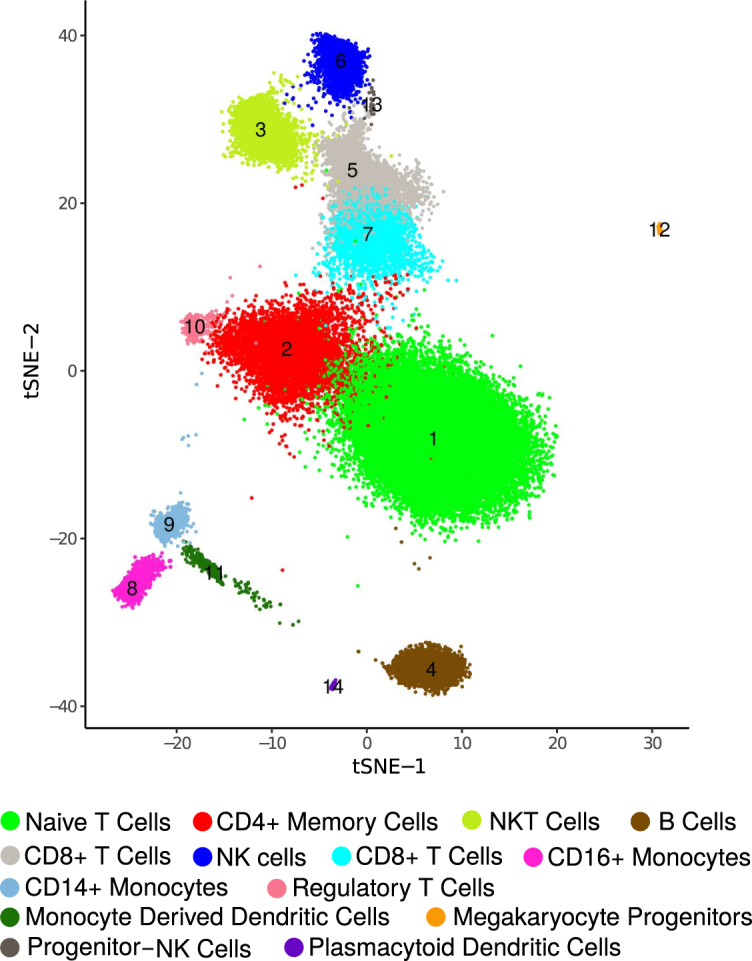
Clustering of ∼68K PBMC data. dropClust based visualization (a modified version of tSNE) of the transcriptomes. Fourteen clusters, retrieved by the algorithm are marked with their respective cluster IDs. Legends show the names of the inferred cell types.
Most notable among the above findings are two crisp subpopulations of Natural Killer progenitors ( 0.1% of the population) and Regulatory T cells ( 0.5%) (Figure 5, Table 1 in the main text; Section 6 in Supplementary Data) that other methods failed to resolve (dropClust projection pictures Supplementary Figure S14). To the best of our knowledge, none of the previously published studies reported transcriptomic characterization of these cell types at single cell resolution.
Computation time
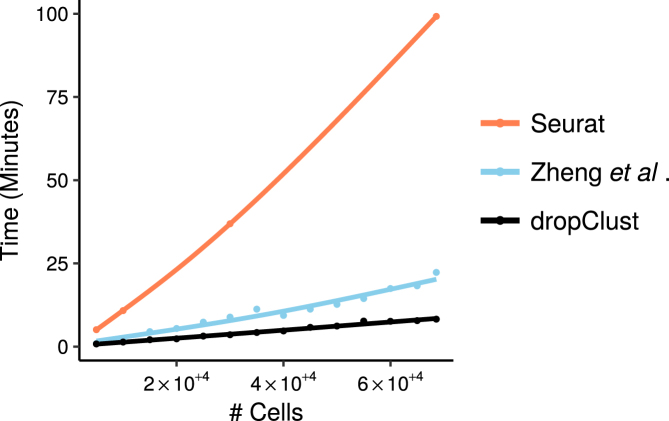
Besides improved clustering accuracy, dropClust is designed to provide significant speed up. On ∼68K PBMC data it took ∼8 min to perform preprocessing, clustering and visualization. The k-means based pipeline proposed by Zheng et al. took around 22 min whereas it took ∼100 min for Seurat for the same. Figure 6 shows the execution time taken by different methods while increasing the number of transcriptomes to analyze.
Figure 6.
Trend of increase in analysis (preprocessing, clustering and vizualization)) time for different pipelines with growing number of transcriptomes under analysis.
Of note, execution time of clustering algorithms vary proportionally with algorithm complexity. Seurat requires  time for computing similarity matrix for N input transcriptomes. dropClust, on the other hand, uses
  algorithm for Structure Preserving Sampling (SPS), followed by hierarchical clustering (usually
  ) of M transcriptomes, selected through SPS. In practice, M is much smaller compared to N. Zheng and colleagues (2) applied k-means clustering on the 68K PBMC data using a priori knowledge about the number of possible clusters (k = 10). As discussed before k-means has significant drawbacks. In fact, finding the optimal k requires
  time (53). Moreover, k-means operates on an Expectation Maximization (EM) like algorithm that often requires many iterations to converge. Default setting of the algorithm employed by Zheng and colleagues forces the algorithm to terminate after the 150th iteration. These clearly highlight the theoretical basis for the speed achieved by dropClust. For component-wise time comparison (Section 4, Supplementary Data).
We were compelled to stick to three methods only as some of the other methods including GiniClust (6), BackSpin (5) and RaceID (54) failed to execute on the complete PBMC data (Section 2 in Supplementary Data). Memory consumption of dropClust for increasing sample size is shown in Supplementary Figure S4.
All time measurements were taken on a system with the following configuration: Intel(R) Xeon(R) CPU E5-2670 v2 @ 2.50GHz with 20 cores and 100GB of RAM.
Detectability of minor cell sub-populations: a simulation study
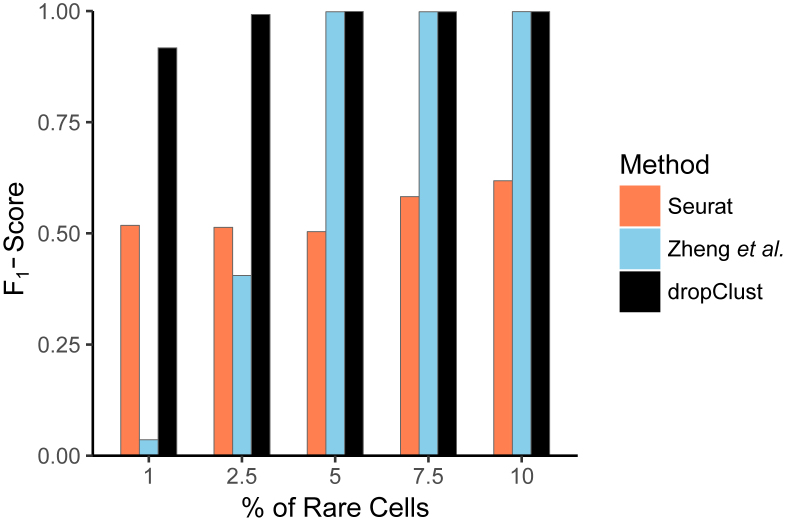
A major promise of single cell expression profiling at a large scale lies in the possibility of identifying rare cell subpopulations. A cell type may be considered as rare when its abundance in the respective population is ≤5% (6,54). The ability of the clustering methods to detect rare cell-types was assessed through a simulation study. For this, we used a collection of ∼3200 scRNA-seq profiles containing Jurkat and 293T cells, mixed in vitro at equal proportion (2). The authors tracked the profile of Single Nucleotide Variants (SNVs) to determine the lineage of the individual cells. The ratio of the two cell types was altered in silico by down-sampling one of the populations. Abundance of the minor cell type was varied between 1% and 10%. A variant of the popular F1 score was used to measure the algorithm efficacies. dropClust turned out to be the only algorithm that detected the minor clusters nearly accurately at all tested concentrations (Figure 7). The existing methods clearly struggled with the smaller concentrations of the rare cell lineage.
Figure 7.
Detectability of minor cell types. Bars showing average of F1-scores, obtained on 10 simulated datasets at each concentration of the minor population. A dataset containing mixture of Jurkat and 293T cells was used for this study.
We also assessed rare cell detectability of dropClust by randomly downsampling the Megakaryocyte Progenitor cluster (∼160 cells) in the ∼68K PBMC data. We could identify the cluster correctly even when the cell type constituted 0.04% of the entire population (Supplementary Table S6).
Results on additional datasets
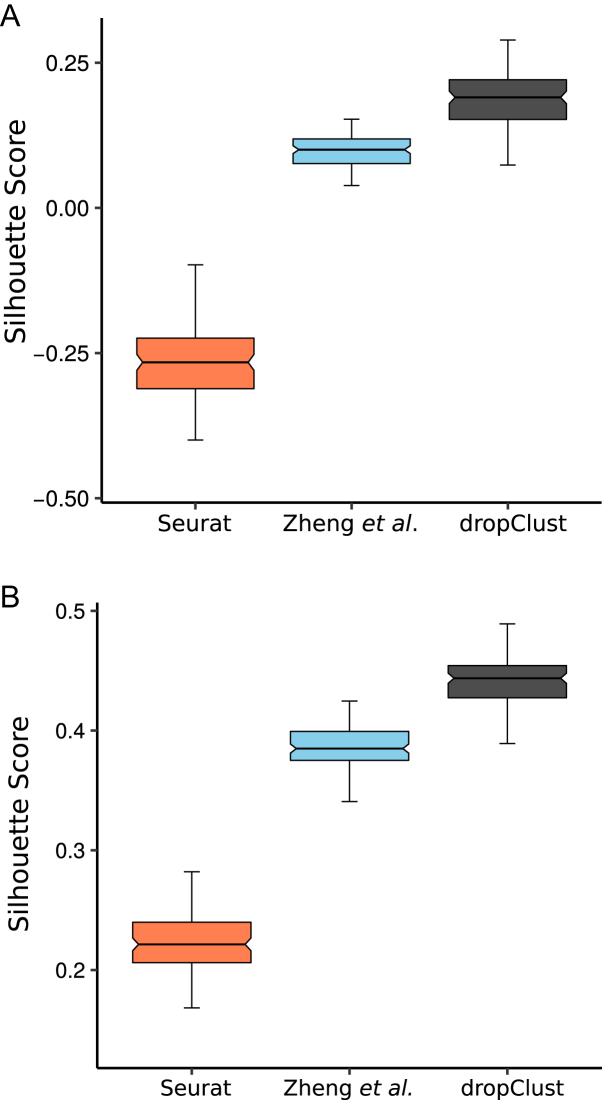
To rule out the possibility of assay sensitivity, we benchmarked the performance of the clustering methods on two additional droplet-seq datasets from independent studies. The first dataset consists of transcriptomes of 49 300 mouse retina cells (GSE63473) (7) and the second dataset contains expression profiles of ∼2700 mouse embryonic stem cells (ESC) (GSE65525) (10). Both the studies are exploratory in nature and therefore lack any secondary source of information for lineage determination. For these datasets, we, therefore, computed the Silhouette scores (a popular unsupervised metric of cluster quality) corresponding to the cell groupings obtained using different clustering methods. Silhouette is a non parametric measure of the trade off between cluster tightness and inter-cluster separation (55). For large sample sizes, it takes a long time to compute Silhouette score. To this end, we created 100 independent sets of 500 transcriptomes through bootstrapping. Average Silhouette scores thus obtained are depicted through the boxplots in Figure 8.
Figure 8.
(A) Boxplots depicting average Silhouette scores computed on 100 bootstrap samples from the mouse retina cell data (7). A separate boxplot is used for each concerned clustering method. (B) Similar plots for the mouse ESC dataset (10).
We used an additional droplet-seq dataset featuring ∼20K transcriptomes derived from mouse hypothalamus (11), for a qualitative assessment of dropClust’s performance with respect to the widely used method Seurat. Despite substantial concordance across the clusters, dropClust was found to be more sensible compared to Seurat in placing the like-cell types geographically closer in their respective 2D maps (Section 8, Supplementary Data for details.)
Visualization
Visualizing large-scale scRNA-seq data is challenging. Both Principal Component Analysis (PCA) and t-distributed Stochastic Neighbourhood Embedding (tSNE) are widely used for visualization of scRNA-seq datasets (56). dropClust uses tSNE to obtain the 2D coordinates of a small sub-sample of the data, followed by inferring coordinate pairs of each remaining transcriptome by averaging the coordinates of its nearest neighbours among the sub-sample (Figures 4, 5 and Supplementary Figure S6). This strategy offered significant speedup and improved the correspondence between clustering and low dimensional visualization of the data. As a sharp contrast to dropClust, 2D maps obtained from Seurat and Zheng et al. (Supplementary Figures S12 and S13), clearly struggled to mitigate overlap between clusters.
CONCLUSION
In this article we report dropClust, a novel algorithm for clustering and visualization of ultra-large single cell RNA-seq (scRNA-seq) data. Its speed and ability of delineating both major and minor cell types make it uniquely suitable for analysis of large scale scRNA-seq, data produced by droplet based transcriptomics platforms. dropClust is advantageous over the existing methods in detecting minor cell sub-populations. This much sought after feature is attained as a result of a number of careful and innovative design considerations including structure preserving data sampling and subjective selection of the most informative principal components. It is an end-to-end informatics pipeline for downstream analysis of droplet-seq data. The dropClust pipeline enables user to perform speedy analysis of ultra-large scRNA-seq data. The major functionalities of the end-to-end pipeline include data normalization, gene selection, unsupervised clustering of transcriptomes, low dimensional visualization of the complete data and differential expression analysis. With the increase in single cell transcriptomic throughput capabilities and technology availability (Chromium™ by 10× Genomics, ICELL8 by WaferGen Biosystems, similar platform by Illumina and Bio-Rad etc.) we predict unique relevance of the proposed dropClust pipeline.
AVAILABILITY
The dropClust R package is available at: https://github.com/debsin/dropClust.
Supplementary Material
SUPPLEMENTARY DATA
Supplementary Data are available at NAR online.
FUNDING
INSPIRE Faculty Fellowship [DST/INSPIRE/04/2015/003068 to D.S.] by the Department of Science and Technology (DST), Govt. of India; J.C. Bose Fellowship [SB/S1/JCB-033/2016 to S.B.] by the DST, Govt. of India; SyMeC Project grant [BT/Med-II/NIBMG/SyMeC/2014/Vol. II] given to the Indian Statistical Institute by the Department of Biotechnology (DBT), Govt. of India. Funding for open access charge: Institutional Funding.
Conflict of interest statement. None declared.
REFERENCES
- 1. Tanay A., Regev A.. Scaling single-cell genomics from phenomenology to mechanism. Nature. 2017; 541:331–338. [DOI] [PMC free article] [PubMed] [Google Scholar]
- 2. Zheng G.X.Y., Terry J.M., Belgrader P., Ryvkin P., Bent Z.W., Wilson R., Ziraldo S.B., Wheeler T.D., McDermott G.P., Zhu J. et al. Massively parallel digital transcriptional profiling of single cells. Nat. Commun. 2017; 8:14049. [DOI] [PMC free article] [PubMed] [Google Scholar]
- 3. Li H., Courtois E.T., Sengupta D., Tan Y., Chen K.H., Goh J.J.L., Kong S.L., Chua C., Hon L.K., Tan W.S. et al. Reference component analysis of single-cell transcriptomes elucidates cellular heterogeneity in human colorectal tumors. Nat. Genet. 2017; 49:708–718. [DOI] [PubMed] [Google Scholar]
- 4. Kiselev V.Y., Kirschner K., Schaub M.T., Andrews T., Yiu A., Chandra T., Natarajan K.N., Reik W., Barahona M., Green A.R. et al. SC3: consensus clustering of single-cell RNA-seq data. Nat. Methods. 2017; 14:483–486. [DOI] [PMC free article] [PubMed] [Google Scholar]
- 5. Zeisel A., Munoz-Manchado A.B., Codeluppi S., Lonnerberg P., La Manno G., Jureus A., Marques S., Munguba H., He L., Betsholtz C. et al. Cell types in the mouse cortex and hippocampus revealed by single-cell RNA-seq. Science. 2015; 347:1138–1142. [DOI] [PubMed] [Google Scholar]
- 6. Jiang L., Chen H., Pinello L., Yuan G.-C.. GiniClust: Detecting rare cell types from single-cell gene expression data with Gini index. Genome Biol. 2016; 17:144. [DOI] [PMC free article] [PubMed] [Google Scholar]
- 7. Macosko E.Z., Basu A., Satija R., Nemesh J., Shekhar K., Goldman M., Tirosh I., Bialas A.R., Kamitaki N., Martersteck E.M. et al. Highly parallel genome-wide expression profiling of individual cells using nanoliter droplets. Cell. 2015; 161:1202–1214. [DOI] [PMC free article] [PubMed] [Google Scholar]
- 8. Xu C., Su Z.. Identification of cell types from single-cell transcriptomes using a novel clustering method. Bioinformatics. 2015; 31:1974–1980. [DOI] [PMC free article] [PubMed] [Google Scholar]
- 9. Levine J.H., Simonds E.F., Bendall S.C., Davis K.L., Amir E.-a.D., Tadmor M.D., Litvin O., Fienberg H.G., Jager A., Zunder E.R. et al. Data-driven phenotypic dissection of AML reveals progenitor-like cells that correlate with prognosis. Cell. 2015; 162:184–197. [DOI] [PMC free article] [PubMed] [Google Scholar]
- 10. Klein A.M., Mazutis L., Akartuna I., Tallapragada N., Veres A., Li V., Peshkin L., Weitz D.A., Kirschner M.W.. Droplet barcoding for single-cell transcriptomics applied to embryonic stem cells. Cell. 2015; 161:1187–1201. [DOI] [PMC free article] [PubMed] [Google Scholar]
- 11. Campbell J.N., Macosko E.Z., Fenselau H., Pers T.H., Lyubetskaya A., Tenen D., Goldman M., Verstegen A.M., Resch J.M., McCarroll S.A. et al. A molecular census of arcuate hypothalamus and median eminence cell types. Nat. Neurosci. 2017; 20:484–496. [DOI] [PMC free article] [PubMed] [Google Scholar]
- 12. Blondel V.D., Guillaume J.-L., Lambiotte R., Lefebvre E.. Fast unfolding of communities in large networks. J. Stat. Mech. 2008; 2008:P10008. [Google Scholar]
- 13. Gionis A., Indyk P., Motwani R.. Similarity search in high dimensions via hashing. VLDB. 1999; 99:518–529. [Google Scholar]
- 14. Bawa M., Condie T., Ganesan P.. LSH forest. Proceedings of the 14th international conference on World Wide Web - WWW ’05. 2005; ACM Press. [Google Scholar]
- 15. Sengupta D., Pyne A., Maulik U., Bandyopadhyay S.. Reformulated kemeny optimal aggregation with application in consensus ranking of microRNA targets. IEEE/ACM Trans. Comput. Biol. Bioinf. 2013; 10:742–751. [DOI] [PubMed] [Google Scholar]
- 16. Xiang Y., Gubian S., Suomela B., Hoeng J.. Generalized simulated annealing for efficient global optimization: the GenSA Package for R. R Journal. 2013; 5:13–28. [Google Scholar]
- 17. Treutlein B., Brownfield D.G., Wu A.R., Neff N.F., Mantalas G.L., Espinoza F.H., Desai T.J., Krasnow M.A., Quake S.R.. Reconstructing lineage hierarchies of the distal lung epithelium using single-cell RNA-seq. Nature. 2014; 509:371–375. [DOI] [PMC free article] [PubMed] [Google Scholar]
- 18. Stauffer C., Grimson W.. Adaptive background mixture models for real-time tracking. Proceedings. 1999 IEEE Computer Society Conference on Computer Vision and Pattern Recognition (Cat. No PR00149). 1999; IEEE Comput. Soc. [Google Scholar]
- 19. Schwarz G. Estimating the Dimension of a Model. Ann. Statist. 1978; 6:461–464. [Google Scholar]
- 20. Langfelder P., Zhang B., Horvath S.. Defining clusters from a hierarchical cluster tree: the Dynamic Tree Cut package for R. Bioinformatics. 2007; 24:719–720. [DOI] [PubMed] [Google Scholar]
- 21. Langfelder P., Zhang B. with contributions from Steve Horvath . dynamicTreeCut: methods for detection of clusters in hierarchical clustering dendrograms. 2016; R package version 1.63-1.
- 22. Okada R., Kondo T., Matsuki F., Takata H., Takiguchi M.. Phenotypic classification of human CD4+ T cell subsets and their differentiation. Int. Immunol. 2008; 20:1189–1199. [DOI] [PubMed] [Google Scholar]
- 23. Schiott A., Lindstedt M., Johansson-Lindbom B., Roggen E., Borrebaeck C.A.. CD27(-) CD4(+) memory T cells define a differentiated memory population at both the functional and transcriptional levels. Immunology. 2004; 113:363–370. [DOI] [PMC free article] [PubMed] [Google Scholar]
- 24. Colpitts S.L., Dalton N.M., Scott P.. IL-7 receptor expression provides the potential for long-term survival of both CD62Lhigh central memory T cells and Th1 effector cells during leishmania major infection. J. Immunol. 2009; 182:5702–5711. [DOI] [PMC free article] [PubMed] [Google Scholar]
- 25. Lee W.-Y., Sanz M.-J., Wong C.H.Y., Hardy P.-O., Salman-Dilgimen A., Moriarty T.J., Chaconas G., Marques A., Krawetz R., Mody C.H., Kubes P.. Invariant natural killer T cells act as an extravascular cytotoxic barrier for joint-invading Lyme Borrelia. Proc. Natl. Acad. Sci. U.S.A. 2014; 111:13936–13941. [DOI] [PMC free article] [PubMed] [Google Scholar]
- 26. van Gisbergen K.P., Kragten N.A., Hertoghs K.M., Wensveen F.M., Jonjic S., Hamann J., Nolte M.A., van Lier R.A.. Mouse Hobit is a homolog of the transcriptional repressor Blimp-1 that regulates NKT cell effector differentiation. Nat. Immunol. 2012; 13:864–871. [DOI] [PubMed] [Google Scholar]
- 27. Chu P.G., Arber D.A.. CD79: a review. Appl. Immunohistochem. Mol. Morphol. 2001; 9:97–106. [DOI] [PubMed] [Google Scholar]
- 28. Oksvold M.P., Kullmann A., Forfang L., Kierulf B., Li M., Brech A., Vlassov A.V., Smeland E.B., Neurauter A., Pedersen K.W.. Expression of B-cell surface antigens in subpopulations of exosomes released from B-cell lymphoma cells. Clin. Therap. 2014; 36:847–862. [DOI] [PubMed] [Google Scholar]
- 29. Bade B. Differential expression of the granzymes A, K and M and perforin in human peripheral blood lymphocytes. Int. Immunol. 2005; 17:1419–1428. [DOI] [PubMed] [Google Scholar]
- 30. Tu T.C., Brown N.K., Kim T.-J., Wroblewska J., Yang X., Guo X., Lee S.H., Kumar V., Lee K.-M., Fu Y.-X.. CD160 is essential for NK-mediated IFN- production. J. Exp. Med. 2015; 212:415–429. [DOI] [PMC free article] [PubMed] [Google Scholar]
- 31. Le Bouteiller P., Tabiasco J., Polgar B., Kozma N., Giustiniani J., Siewiera J., Berrebi A., Aguerre-Girr M., Bensussan A., Jabrane-Ferrat N.. CD160: a unique activating NK cell receptor. Immunol. Lett. 2011; 138:93–96. [DOI] [PubMed] [Google Scholar]
- 32. Turman M.A., Yabe T., McSherry C., Bach F.H., Houchins J.P.. Characterization of a novel gene (NKG7) on human chromosome 19 that is expressed in natural killer cells and T cells. Hum. Immunol. 1993; 36:34–40. [DOI] [PubMed] [Google Scholar]
- 33. Ogawa K., Takamori Y., Suzuki K., Nagasawa M., Takano S., Kasahara Y., Nakamura Y., Kondo S., Sugamura K., Nakamura M., Nagata K.. Granulysin in human serum as a marker of cell-mediated immunity. Eur. J. Immunol. 2003; 33:1925–1933. [DOI] [PubMed] [Google Scholar]
- 34. Valés-Gmez M., Esteso G., Aydogmus C., Blázquez-Moreno A., Marn A.V., Briones A.C., Garcillán B., Garca-Cuesta E.-M., Lpez Cobo S., Haskologlu S. et al. Natural killer cell hyporesponsiveness and impaired development in a CD247-deficient patient. J. Allergy Clin. Immunol. 2016; 137:942–945. [DOI] [PubMed] [Google Scholar]
- 35. Lorenzo J. The Effects of Immune Cell Products (Cytokines and Hematopoietic Cell Growth Factors) on Bone Cells. 2010; Academic Press. [Google Scholar]
- 36. Ida H., Utz P.J., Anderson P., Eguchi K.. Granzyme B and natural killer (NK) cell death. Modern Rheumatology. 2005; 15:315–322. [DOI] [PubMed] [Google Scholar]
- 37. Barros M. H.M., Hauck F., Dreyer J.H., Kempkes B., Niedobitek G.. Macrophage polarisation: an immunohistochemical approach for identifying M1 and M2 macrophages. PLoS ONE. 2013; 8:e80908. [DOI] [PMC free article] [PubMed] [Google Scholar]
- 38. Ziegler-Heitbrock H.L., Passlick B., Flieger D.. The monoclonal antimonocyte antibody My4 stains B lymphocytes and two distinct monocyte subsets in human peripheral blood. Hybridoma. 1988; 7:521–527. [DOI] [PubMed] [Google Scholar]
- 39. Yan W.X., Armishaw C., Goyette J., Yang Z., Cai H., Alewood P., Geczy C.L.. Mast cell and monocyte recruitment by S100A12 and its hinge domain. J. Biol. Chem. 2008; 283:13035–13043. [DOI] [PubMed] [Google Scholar]
- 40. Goyette J.D. The Extracellular Functions of S100A12 PhD thesis Medical Sciences, Faculty of Medicine. 2008; UNSW. [Google Scholar]
- 41. Bandala-Sanchez E., Zhang Y., Reinwald S., Dromey J.A., Lee B.-H., Qian J., Bhmer R.M., Harrison L.C.. T cell regulation mediated by interaction of soluble CD52 with the inhibitory receptor Siglec-10. Nat. Immunol. 2013; 14:741–748. [DOI] [PubMed] [Google Scholar]
- 42. Sugimoto N., Oida T., Hirota K., Nakamura K., Nomura T., Uchiyama T., Sakaguchi S.. Foxp3-dependent and-independent molecules specific for CD25+ CD4+ natural regulatory T cells revealed by DNA microarray analysis. Int. Immunol. 2006; 18:1197–1209. [DOI] [PubMed] [Google Scholar]
- 43. Hruz T., Laule O., Szabo G., Wessendorp F., Bleuler S., Oertle L., Widmayer P., Gruissem W., Zimmermann P.. Genevestigator V3: a reference expression database for the meta-analysis of transcriptomes. Adv. Bioinformatics. 2008; 2008:1–5. [DOI] [PMC free article] [PubMed] [Google Scholar]
- 44. Collin M., McGovern N., Haniffa M.. Human dendritic cell subsets. Immunology. 2013; 140:22–30. [DOI] [PMC free article] [PubMed] [Google Scholar]
- 45. Merad M., Sathe P., Helft J., Miller J., Mortha A.. The dendritic cell lineage: ontogeny and function of dendritic cells and their subsets in the steady state and the inflamed setting. Annu. Rev. Immunol. 2013; 31:563–604. [DOI] [PMC free article] [PubMed] [Google Scholar]
- 46. Lambert M.P., Meng R., Harper D., Xiao L., Marks M.S., Poncz M.. Megakaryocytes exchange significant levels of their alpha-granular PF4 with their environment. Blood. 2014; 124:1432–1432. [Google Scholar]
- 47. Sakurai K., Fujiwara T., Hasegawa S., Okitsu Y., Fukuhara N., Onishi Y., Yamada-Fujiwara M., Ichinohasama R., Harigae H.. Inhibition of human primary megakaryocyte differentiation by anagrelide: A gene expression profiling analysis. Int. J. Hematol. 2016; 104:190–199. [DOI] [PubMed] [Google Scholar]
- 48. Stafforini D.M., McIntyre T.M., Zimmerman G.A., Prescott S.M.. Platelet-activating factor acetylhydrolases. J. Biol. Chem. 1997; 272:17895–17898. [DOI] [PubMed] [Google Scholar]
- 49. Ikawa T., Fujimoto S., Kawamoto H., Katsura Y., Yokota Y.. Commitment to natural killer cells requires the helix-loop-helix inhibitor Id2. Proc. Natl. Acad. Sci. U.S.A. 2001; 98:5164–5169. [DOI] [PMC free article] [PubMed] [Google Scholar]
- 50. Ramirez K., Kee B.L.. Transcriptional regulation of natural killer cell development. Curr. Opin. Immunol. 2010; 22:193–198. [DOI] [PMC free article] [PubMed] [Google Scholar]
- 51. Jahrsdorfer B., Vollmer A., Blackwell S.E., Maier J., Sontheimer K., Beyer T., Mandel B., Lunov O., Tron K., Nienhaus G.U., Simmet T., Debatin K.-M., Weiner G.J., Fabricius D.. Granzyme B produced by human plasmacytoid dendritic cells suppresses T-cell expansion. Blood. 2009; 115:1156–1165. [DOI] [PMC free article] [PubMed] [Google Scholar]
- 52. Masten B.J., Olson G.K., Tarleton C.A., Rund C., Schuyler M., Mehran R., Archibeque T., Lipscomb M.F.. Characterization of myeloid and plasmacytoid dendritic cells in human lung. J. Immunol. 2006; 177:7784–7793. [DOI] [PubMed] [Google Scholar]
- 53. Petrovic S. A comparison between the silhouette index and the davies-bouldin index in labelling ids clusters. Proceedings of the 11th Nordic Workshop of Secure IT Systems. 2006; 53–64. [Google Scholar]
- 54. Grn D., Lyubimova A., Kester L., Wiebrands K., Basak O., Sasaki N., Clevers H., van Oudenaarden A.. Single-cell messenger RNA sequencing reveals rare intestinal cell types. Nature. 2015; 525:251–255. [DOI] [PubMed] [Google Scholar]
- 55. Rousseeuw P.J. Silhouettes: a graphical aid to the interpretation and validation of cluster analysis. J. Comput. Appl. Math. 1987; 20:53–65. [Google Scholar]
- 56. Wagner A., Regev A., Yosef N.. Revealing the vectors of cellular identity with single-cell genomics. Nat. Biotechnol. 2016; 34:1145–1160. [DOI] [PMC free article] [PubMed] [Google Scholar]
Associated Data
This section collects any data citations, data availability statements, or supplementary materials included in this article.


