

Abstract
Autoregressive cross-lagged structural equation modeling was conducted to examine longitudinal relationships between individual assets (social competence, positive values and identity) and problem behaviors in 373 adolescents (174 boys, 199 girls) who participated in a prospective study on the effects of prenatal cocaine exposure from birth. More behavioral problems at age 12 were related to fewer individual assets at age 15, while greater individual assets were related to more behavioral problems, with a non-significant yet nuanced (p = .076) gender difference. More problem behaviors were associated with decreased individual assets in girls, yet greater individual assets were associated with more problem behaviors in boys. Efforts to promote individual assets may not lower the risk of engaging in problem behaviors especially among boys. Continued studies into adulthood will uncover how individual assets and problem behaviors in childhood and adolescence may affect social and vocational adjustment in this high risk population.
Keywords: Individual assets, Problem behavior, Cross-lagged, Structural equation modeling, Adolescents
Adolescence is a period of rapid development with increased opportunities, identity exploration, autonomy, and risk experimentations, subject to developing and/or escalating both adaptive and problematic behaviors (Schwartz et al., 2007). Studies on adolescence have long been centered on behavioral problems, such as delinquency, substance use, and sexual risk behaviors, reflecting the “stress-and-storm” view of adolescence (Hall, 1904); the lack of risk behaviors tends to be synonymous with healthy development in this tradition. As a reaction to the dominant deficit-driven models that marked the study of adolescence, an alternative conception was developed in the 1990s, focusing on the strengths of youth and the plasticity of human development (Lerner, 1998; Scales et al., 2000). In this paradigm, the development of positive individual assets, such as social competence and positive identity that adolescents develop internally, along with ecological resources and support from family, school, and community, are expected to lead to the reduction of problem behaviors (Scales & Leffert, 2004; Schwartz et al., 2010). Thus, both approaches assumed that problem behaviors and positive development constitute opposite ends of a single dimension, overlooking ontogenetic relationships between positive and negative development.
Although greater individual strength and assets tend to be related to fewer problem behaviors in general (e.g., Jelicic et al., 2007; Masten & Curtis, 2000; Schwartz et al., 2010), the nature of these relationships may become more complicated as children enter adolescence (Boles et al., 2006; Warren et al., 2016). For example, popularity in adolescence is associated with higher levels of ego development, secure attachment, and more adaptive interactions with mothers and friends, as well as with engagement in minor levels of drug use and delinquency (Allen et al., 2005) and increased alcohol use and sexual activity (Mayeus et al., 2008). Sports participation, shown to contribute to competence and confidence (Zarrett et al., 2009), is also related to problem alcohol use (Mays et al., 2010; Garry & Morrissey, 2000). A series of recent studies reported that higher levels of confidence and competence were found not only in adolescents showing less likelihood of engagement in problem behavior (depressive symptoms, bullying, delinquency, substance use, sexual activity) but also in adolescents reporting alcohol and marijuana use (Arbeit et al., 2014; Lewin-Bizan et al., 2010b; Phelps et al., 2007; Warren et al., 2016), providing empirical support to the importance of conceptualizing and assessing problem behaviors and individual assets as distinct, separate dimensions of youth development.
Despite great interest in understanding and promoting optimal adolescent development in a more comprehensive and integrative way (Schwartz et al., 2007; Masten & Curtis, 2000), few studies examined how both individual assets and problem behaviors may develop and interrelate prospectively over time during adolescence, failing to disentangle temporal precedence and directions of associations and to control for co-varying and stability effects. A longitudinal study based on Norwegian youth found that lack of social competence (defined as cooperation, assertion, responsibility, and self-control) at age 13 predicted antisocial behavior at age 15, over and above the variance explained by the earlier assessment of antisocial behavior (Sørlie et al., 2008), while others (Racz et al., 2017) reported that higher externalizing behavior at age 10 predicted lower social adaptation (interpersonal relationships, play skills, coping abilities) at age 14, but not vice versa. In contrary, the 4-H Study found that individual assets (operationalized as competence, confidence, character, connection, and caring) assessed in 7th grade were not related to problem behaviors (delinquency, substance use, and depression) assessed a year later in 8th grade when 7th grade problem behaviors were controlled (Lewin-Bizan et al., 2010a), consistent with the NICHD Study of Early Child Care and Youth Development reporting no relationship (i.e., no cross-lagged effect) between social competence and externalizing behavior from ages 9 to 15 (Burt & Roisman, 2010). These mixed findings from longitudinal studies may reflect methodological differences among studies such as variability in operationalization of individual assets (social competence, coping, caring), ages at assessment, length of the intervals between assessments, and confounders controlled for. Further, previous studies mostly consist of the 4-H Study sample, which overrepresented (∼ 65%) White, largely middle-class youth (Lewin-Bizan et al., 2010a), a national study where White adolescents also comprised the majority of the sample (∼ 76%) (Burt & Roisman, 2010), or a sample from a relatively high socioeconomic status group (Sørlie et al., 2008; Racz et al., 2017), severely limiting the relevance of the findings to non-White adolescents in contexts marked by limited resources and multiple adversity.
In a resource-deprived, unpredictable, urban, inner-city setting with diminished opportunities and prospects, high levels of crime and violence and coupled with negative racial images, delinquent and risky behaviors may have adaptive value to achieve social status, especially among boys (Frankenhuis & Del Giudice, 2012). They often enhance reputations for bravery (Ellis et al., 2012), and adolescents even may be encouraged to be aggressive as a way to appear “tough” and to protect themselves in their unsafe environments (Brown 1998; Miller & Sperry 1987). Aggressive children and adolescents may become dominant, respected, and popular leaders in their peer groups, especially when they also possess prosocial skills such as cooperation and negotiation (Rodkin et al., 2006), and their high social status may further facilitate their antisocial behavior (Rodkin et al., 2000). These positive associations between social status and aggression may be more salient for adolescent boys than girls, since societal gender-based norms expect stronger compliance from girls than boys (Martin, 1996; Min et al., 2015; Waasdorp et al., 2013). Boys are socialized to be more competitive and dominant, with aggression perceived as more typical of boys and more detrimental for girls. Thus, social competence and aggression may be positively linked bi-directionally for adolescent boys but not for girls.
The purpose of the current study is to examine the longitudinal relationship between self-reported individual assets and problem behaviors in at-risk adolescents from ages 12 to 17 years. Using a high-risk community sample of minority adolescents with low socio-economic status and prenatal substance exposure, we investigated whether temporal changes in individual assets were related to problem behaviors or vice versa, complementing previous studies that heavily relied on White middle-class adolescents. Correlates of individual assets and problem behaviors were assessed and controlled, including maternal drug use during pregnancy/prenatal exposure to cocaine, race, maternal education, quality of the home environment, violence exposure and IQ, based on our findings from prior studies (Min et al., 2014a; Min et al., 2014b; Singer et al., 2008) and others (Bada et al., 2011; Richardson et al., 2015; Frank et al., 2011). Although it was not clear, given the mixed findings with possible context and gender variations, what to expect for the relationship between individual assets and problem behaviors in our high-risk sample, we hypothesized that, controlling for earlier levels of problem behaviors and individual assets (within-domain stability) and covariation between problem behaviors and individual assets within the same assessments (within-time covariance), adolescents with higher individual assets in prior assessment would have more subsequent behavioral problems, while adolescents with greater behavioral problems in earlier assessment would have lower subsequent individual assets. We further hypothesized that the positive interrelations between individual assets and problem behaviors would be stronger for boys.
Method
Sample and Procedure
The study sample consisted of 373 adolescents (174 boys, 199 girls) who were recruited at birth (September 1994 to June 1996) from a large, urban, teaching hospital in the Midwest United States and followed prospectively for a longitudinal investigation of the developmental effects of prenatal cocaine exposure (Min et al. 2014a; Minnes et al. 2010; Singer et al. 2004, 2008). Drug toxicology screenings were administered to 647 mothers and infants at delivery who were identified to be high risk due to lack of prenatal care, maternal behavior suggesting intoxication, self-admitted drug use, or a history of involvement with the Department of Children and Family Services. During the screening procedure for eligibility, 54 mother-infant dyads were excluded due to confounding conditions that might obscure the effects of prenatal cocaine exposure: maternal age less than 19 years (2); primary heroin use (2); maternal psychiatric history of severe depression, bipolar disorder or schizophrenia (16); maternal low intellectual functioning (1); maternal chronic illness (4); HIV positive status (5); lack of meconium (15); fetal alcohol syndrome (1); infant Down syndrome (2); infant illness (3); and other (3). Of the 593 eligible participants, 415 infants enrolled in the study. Twelve children died since enrollment from sudden infant death syndrome (6), respiratory distress syndrome (2), cardiopulmonary arrest (1), pneumonia (1), accidental asphyxia (1), and unknown illness (1). Of the remaining 403 adolescents, 19 dropped out, 10 were lost to contact, and 1 had low intellectual functioning (IQ < 50). The present study utilizes data from 373 adolescents who completed behavioral assessment at ages 12, 15, and/or 17 years, representing 93% retention of the 403 living participants. Of the total sample of 373, 96% (n = 358) completed ≥ 2 assessments, with 81% (n = 302) completing all 3 assessments. The 30 non-participating adolescents were more likely to be White (p < .005) and had lower Hobel Neonatal Risk scores (p < .001) than the 373 participants. There were no other sociodemographic and drug exposure differences.
The Institutional Review Board of the participating hospital reviewed and approved all research procedures. The initial screenings and enrollment were performed in the hospital at infant birth. The longitudinal follow-up assessments were conducted at the university-based developmental research lab on subjects and their caregivers at 6, 12, and 18 months and 2, 4, 6, 9-12, 15, and 17 years of age postpartum. Parental written informed consent was obtained at each visit, with child assent beginning at age 9. The consent document included a Certificate of Confidentiality number (DA-98-91) issued by U.S. Department of Health and Human Services to protect the release of drug-related information. At each follow up visit, a trained research assistant blind to cocaine exposure status administered the behavioral and cognitive assessment protocol to the children. A different research assistant conducted caregiver interviews privately. For the 12, 15 and 17 year assessments, each subject was given a monetary stipend for participation, along with lunch and assistance with transportation costs if needed.
Participating adolescents were primarily African American (n = 303, 81.2%). On average, adolescents were M = 12.10 (SD = .24), M = 15.63 (SD = .27), and M = 17.81 (SD = .26) years of age at each assessment, respectively. Forty percent of their mothers (n = 151) had not finished high school, with a mean of 11.76 years of education (SD = 1.55). A majority of the adolescents (n = 322, 86%) were prenatally exposed to at least one substance and two-thirds (n = 247) to ≥ 2 substances. Half of the children (n = 190) were prenatally exposed to cocaine, 64% (n = 232) to tobacco, 76% (n = 273) to alcohol, and 31% (n = 112) to marijuana. The majority of the sample reported being recipients of free lunch (n = 293, 83%) and Medicaid (n = 283, 80.2%) at age 15.
Measures
Adolescent individual assets
Individual assets were measured at ages 12, 15, and 17 using the 32-item Internal Assets subscale of the widely used Developmental Assets Profile (DAP; Search Institute, 2005), a youth self-report using a 4-point Likert scale (0 = not at all/rarely; 1 = somewhat/sometimes; 2 = very/often; and 3 = extremely/always) designed to assess 11 to 18 year-old adolescents' positive experiences and qualities within the last 3 months. The internal assets scale identifies characteristics and behaviors that reflect positive personal and psychosocial growth, including commitment to learning (7 items; e.g., “I am eager to do well in school and other groups”), positive values (11 items; e.g., “I take responsibility for what I do”), social competencies (8 items; e.g., “I build friendships with other people”), and positive identity (6 items; e.g., “I am developing a sense of purpose in my life”), with a possible range of 0-30. Higher scores indicate greater assets, with scores < 15 indicating challenged, 15 - 20 vulnerable, 21 - 25 adequate, and > 25 indicating thriving assets (Scales, 2011). The four internal asset subscale scores were used for this investigation. Table 1 indicates internal consistency reliabilities (α) of each subscale by gender and age, ranging from .61 on positive identity at age 12 in boys to .84 on positive values at age 12 in girls.
Table 1. Correlations for observed variables by gender with boys above the diagonal (n = 174) and girls below the diagonal (n = 199).
| 1 | 2 | 3 | 4 | 5 | 6 | 7 | 8 | 9 | 10 | 11 | 12 | 13 | 14 | 15 | 16 | 17 | 18 | M | SD | α | |
|---|---|---|---|---|---|---|---|---|---|---|---|---|---|---|---|---|---|---|---|---|---|
| DAP | |||||||||||||||||||||
| 1. Learning at 12 a | – | .21 | .26 | .60 | .13 | .14 | .54 | .17 | .11 | .40 | .07 | .09 | -.27 | -.06 | -.19 | -.04 | -.22 | -.01 | 21.2 | 6.2 | .82 |
| 2. Learning at 15 a | .37 | – | .43 | .20 | .61 | .32 | .21 | .60 | .42 | .11 | .49 | .35 | -.16 | -.29 | -.07 | -.35 | -.07 | -.34 | 18.2 | 4.9 | .73 |
| 3. Learning at 17 a | .35 | .57 | – | .19 | .30 | .63 | .15 | .28 | .68 | .04 | .25 | .61 | -.28 | -.28 | -.09 | -.16 | -.16 | -.23 | 19.1 | 5.2 | .77 |
| 4. Positive value at 12 | .70 | .26 | .27 | – | .26 | .21 | .70 | .27 | .14 | .48 | .14 | .09 | -.29 | -.03 | -.25 | -.01 | -.22 | -.12 | 20.2 | 5.1 | .80 |
| 5. Positive value at 15 | .41 | .66 | .41 | .48 | – | .42 | .24 | .69 | .42 | .18 | .55 | .34 | -.10 | -.29 | -.02 | -.31 | -.06 | -.20 | 17.9 | 4.0 | .73 |
| 6. Positive value at 17 | .35 | .53 | .63 | .41 | .61 | – | .14 | .33 | .71 | .15 | .25 | .66 | -.24 | -.24 | -.07 | -.22 | -.25 | -.28 | 18.8 | 4.4 | .73 |
| 7. Competence at 12 | .70 | .21 | .21 | .75 | .34 | .33 | – | .21 | .14 | .57 | .20 | .17 | -.29 | .06 | -.20 | .01 | -.26 | -.05 | 21.0 | 5.1 | .72 |
| 8. Competence at 15 | .49 | .62 | .49 | .46 | .70 | .55 | .44 | – | .45 | .19 | .56 | .31 | -.12 | -.30 | -.10 | -.40 | -.12 | -.22 | 18.0 | 4.6 | .68 |
| 9. Competence at 17 | .38 | .46 | .65 | .39 | .47 | .71 | .38 | .63 | – | .13 | .36 | .66 | -.26 | -.27 | -.12 | -.27 | -.16 | -.20 | 19.1 | 5.5 | .78 |
| 10. Identity at 12 | .61 | .13 | .19 | .64 | .25 | .28 | .72 | .30 | .33 | – | .30 | .18 | -.21 | -.00 | -.19 | .06 | -.19 | -.08 | 20.6 | 5.2 | .61 |
| 11. Identity at 15 | .32 | .63 | .43 | .29 | .55 | .49 | .30 | .61 | .55 | .29 | – | .44 | -.14 | -.26 | -.02 | -.24 | -.20 | -.26 | 19.3 | 4.7 | .67 |
| 12. Identity at 17 a | .32 | .36 | .66 | .31 | .37 | .59 | .26 | .44 | .67 | .29 | .58 | – | -.13 | -.23 | .00 | -.23 | -.24 | -.24 | 20.8 | 5.1 | .72 |
| YSR | |||||||||||||||||||||
| 13. Aggression at 12 | -.47 | -.24 | -.14 | -.48 | -.43 | -.31 | -.49 | -.44 | -.25 | -.35 | -.27 | -.22 | – | .34 | .67 | .28 | .52 | .20 | 55.4 | 7.4 | .86 |
| 14. Aggression at 15 a | -.31 | -.36 | -.24 | -.28 | -.40 | -.37 | -.23 | -.46 | -.36 | -.19 | -.39 | -.26 | .60 | – | .43 | .71 | .21 | .48 | 54.3 | 6.6 | .82 |
| 15. Rule-breaking at 12 | -.37 | -.25 | -.11 | -.39 | -.38 | -.29 | -.48 | -.36 | -.22 | -.34 | -.26 | -.12 | .69 | .36 | – | .40 | .29 | .21 | 52.2 | 4.2 | .70 |
| 16. Rule-breaking at 15 | -.25 | -.38 | -.28 | -.21 | -.39 | -.33 | -.19 | -.55 | -.29 | -.13 | -.31 | -.18 | .45 | .69 | .36 | – | .22 | .33 | 55.2 | 6.7 | .81 |
| 17. Inattention at 12 | -.34 | -.24 | -.23 | -.36 | -.26 | -.26 | -.38 | -.28 | -.25 | -.32 | -.23 | -.25 | .61 | .40 | .39 | .37 | – | .30 | 56.4 | 7.4 | .75 |
| 18. Inattention at 15 | -.16 | -.36 | -.20 | -.16 | -.31 | -.27 | -.09 | -.33 | -.28 | -.10 | -.33 | -.25 | .36 | .53 | .16 | .45 | .59 | – | 57.6 | 8.0 | .77 |
|
| |||||||||||||||||||||
| M | 22.9 | 19.9 | 20.5 | 21.2 | 17.6 | 18.3 | 21.6 | 18.7 | 19.8 | 20.7 | 19.3 | 19.4 | 54.9 | 55.7 | 52.2 | 55.2 | 56.7 | 59.2 | – | – | – |
| SD | 5.5 | 5.5 | 5.3 | 5.2 | 4.5 | 4.5 | 5.8 | 5.4 | 5.2 | 6.0 | 5.2 | 5.7 | 6.3 | 7.0 | 3.4 | 5.9 | 7.8 | 8.9 | – | – | – |
| α | .79 | .78 | .75 | .84 | .78 | .78 | .78 | .78 | .76 | .73 | .72 | .79 | .80 | .85 | .66 | .80 | .75 | .76 | – | – | – |
Note. p < .05 when r ≥ | .15|; p < .01 when r ≥ | .20|; p < .001 when r ≥ | .25|.
α = Cronbach's alpha coefficients; DAP = Developmental Assets Profile; Identity = positive identity; M = means; SD = standard deviations; Social Comp = social competence; YSR = Youth Self Report.
Significant (p < .05) gender difference using t-test.
Adolescent problem behaviors
Problem behavior was assessed at ages 12 and 15 using the Youth Self-Report (YSR; Achenbach & Rescorla, 2001), a 105-item youth self-rating of emotional, behavioral, and social problems in the past 6 months. Items were rated on a three-point scale (0 = not true; 1 = sometimes true/somewhat true; 2 = very true/often true), with higher scores indicating greater behavior problems. The age- and gender- standardized T scores of the aggression (17 items), rule-breaking behaviors (15 items), and attention problems (9 items) subscales were used, with α ranging from .66 on rule-breaking behavior at age 12 in girls to .86 on aggression at age 12 in boys (Table 1).
Covariates
Prenatal cocaine exposure was identified based on positive results of maternal or infant urine assay, infant meconium assay, or maternal self-report of cocaine use during pregnancy to medical or research staff at the newborn visit (coded as 1); non-cocaine-exposed infants were negative on all indicators, but may have been exposed to alcohol, tobacco, and/or marijuana (Singer et al., 2004). Infant gender and race were extracted from hospital birth records. Maternal education in years was collected via research interview. Adolescent IQ was assessed at the 11-year visit using the Wechsler Intelligence Scale for Children-Fourth Edition (WISC-IV; Wechsler, 2003) Full Scale IQ scores. The quality of the caregiving environment was assessed at the 12-year visit using the Home Observation for Measurement of the Environment-Early Adolescent version (EA-HOME; α = .83; Caldwell & Bradley, 2003). Violence exposure was also assessed at the 12-year assessment via the Assessment of Liability and Exposure to Substance Use and Antisocial Behavior (ALEXSA; Ridenour et al., 2009), an illustration-based, audio, computer-assisted self-report of antisocial behavior, substance involvement and associated risk factors for children ages 9-12. The ALEXSA violence exposure subscale is composed of 8 items on a five-point scale (0= 0 times to 5 = 5 times or more; α = .76), assessing ever experiencing or witnessing violence (e.g., beating, robbery, stabbing, shooting), with higher scores indicating greater exposure.
Analyses
Autoregressive cross-lagged structural equation models (SEM) were specified, using the AMOS v.24, to assess the reciprocal (i.e., cross-lagged) effects of individual assets and problem behaviors while simultaneously assessing the stability of each construct over time as estimated through autoregressive paths. Missing data were modeled with full information maximum ikelihood estimation, which utilizes all available information from the observed data. The SEM analyses were conducted in three stages: Measurement model, Structural model, Multi-group comparison by gender. First, we examined the measurement model using confirmatory factor analysis (CFA), assessing the adequacy of the factor loadings of the manifest indicators on their respective latent variables, latent construct inter-correlations, and the degree of model fit. The error terms of the same manifest indicator were specified to co-vary over time, as measurement errors of like indicators would be associated over time (Model 1). Additionally, factor loadings involving the same indicator were constrained to be equal over time (Model 2) to ensure that the measurement of the latent factors is comparable over time. Any non-significant (p > .10) measurement error covariance across time was removed, serving as the final CFA model (Model 3).
After an adequate measurement model was established, its structural model was tested to estimate the relation between individual assets and problem behaviors. The SEM models included synchronous, stability, and cross-lagged effects. Four competing SEMs were compared. The first SEM was a stability model including temporal stabilities (autoregressive paths) and synchronous (within-wave) associations of variables over time, without cross-lagged paths (Model 4) as a basis for comparison with later structural models. The second model adds cross-lagged paths from individual assets to problem behavior to the stability model (Model 5), while the third model includes cross-lagged paths from problem behavior to individual assets to the stability model (Model 6). The reciprocal causation model (Model 7) includes both cross-lagged paths. In order to test the robustness of observed paths, Model 7 was examined with covariates by regressing all latent variables/constructs on covariates (Model 8).
A multigroup cross-lagged model was used to explore whether the cross-lagged relations between individual assets and problem behaviors may differ across gender. Based on Model 7, a fully unconstrained measurement model was estimated (Model 9). Measurement invariances, involving invariance for factor loadings (metric invariance; Model 10) and intercepts (scalar invariance; Model 11), and structural invariance (Model 12) were examined sequentially (Little, 1997). The robustness of observed paths was examined with covariates (Model 13).
Model fit was examined using the χ2 goodness-of-fit test, as well as the Comparative Fit Index (CFI), Tucker-Lewis Index (TLI), and Root Mean Square Error of Approximation (RMSEA), with values ≥ .95 for CFI and TLI, and ≤ .06 for RMSEA indicating a good fit (Hu & Bentler, 1998). The model fit of the nested models were compared using the χ2 difference test (Δχ2). A non-significant Δχ2 implies the superiority of the more parsimonious (more constrained) model, while significant Δχ 2 implies the superiority of the more saturated (less constrained) model. When full measurement invariance was not achieved, partial measurement invariance was tested, as having at least two indicators with equivalent factor loadings and intercepts per latent variable to allow valid comparison (Byrne et al., 1989; Steenkamp & Baumgartner, 1998). Also, measurement invariance was deemed present if the change in CFI is negligible (≤ .01; Cheung & Rensvold, 2002). For ease of interpretation, parameter estimates are presented in standardized form.
Results
The means, standard deviations, along with zero-order correlations, and α, for observed variables are presented separately by gender in Table 1. The internal assets scores are mostly hovering in the vulnerable (≤ 20) range, especially during the later adolescence years (at ages 15 & 17) regardless of gender. Girls reported higher commitment to learning at all three assessments, lower positive identity at age 17, and more aggression at age 15 than boys (p's < .05). Girls also reported lower mean scores of violence exposure (M=0.51, SD=0.64) than boys (M=0.68, SD=0.88; p = .04). No gender differences (p > .10) were found in HOME scores (M=48.92, SD=6.35 in girls; M=47.84, SD= 6.77 in boys) or in the Full Scale IQ (M=86.26, SD=13.11 in girls; M=84.45, SD= 13.91 in boys; p's > .10).
The cross-lagged relations between individual assets and problem behaviors
The measurement model, which included all possible associations among factors, was first examined. The latent variables of internal assets and problem behavior were specified to co-vary over time. Errors of each indicator were also specified to co-vary over time. This unconstrained measurement model (Model 1) fitted the data well, χ2 (110) = 159.13, p = .002, CFI= .985, TLI= .977, RMSEA= .035 (90% CI= .022 - .046). To test whether the measurement model is equivalent over time, factor loadings involving the same indicator were constrained to be equal over time (Model 2), χ2 (118) = 209.59, p < .001, CFI= .972, TLI= .960, RMSEA= .046 (90% CI= .035 - .056), indicating that the model without metric invariance fit the data better, Δχ2 (8) = 50.46, p < .001. Partial metric invariance was tested by freely estimating the factor loadings of rule-breaking behavior (Model 2a), yielding an improved model fit, χ2 (117) = 167.14, p = .002, CFI= .985, TLI= .978, RMSEA= .034 (90% CI= .021 - .045). Three non-significant (p > .10) measurement error correlations across time (aggression at 12 & 15; social competencies at 12 & 15; social competencies at 12 & 17) were removed, Δχ2 (3) = 0.26, p = .97, which was accepted as our final measurement model (Model 3). All factor loadings were strong, ranging from .55 on inattention at age 17 to .93 on aggression at age 12.
Based on the final measurement model, a series of cross-lagged models was specified to test the associations between individual assets and problem behavior. The stability model, including autoregressive paths and synchronous associations over time without the cross-lagged paths (Model 4), yielded acceptable fit, χ2 (125) = 183.91, p < .001, CFI= .982, TLI= .977, RMSEA= .034 (90% CI= .024 - .046). Adding a cross-lagged path from individual assets at age 12 to problem behavior at age 15 (Model 5) yielded a better model fit than the stability model, Δχ2 (1) = 3.89, p < .05, as did the addition of two cross-lagged paths from problem behavior to individual assets (Model 6), Δχ2 (2) = 7.20, p = .02. Since a model with both cross-lagged paths (Model 7) yielded a better fit than either Model 5, Δχ2 (2) = 9.29, p < .01, or Model 6, Δχ2 (1) = 5.50, p < .02, Model 7 was retained as the final SEM model, χ2 (122) = 170.99, p = .002, CFI= .985, TLI= .979, RMSEA= .033 (90% CI= .020 - .044). Model 7 indicated more stability in problem behaviors (β= .66 from age 12 to 15) compared to internal assets (β=.36 from age 12 to 15; β= .59 from age 15 to 17). Although higher individual assets were concurrently associated with less problem behavior at both 12 (r= - .47) and 15 years (r= - .49), and more problem behavior at age 12 predicted lower individual assets at age 15 (β= - .17) as hypothesized, greater individual assets at age 12 predicted more problem behaviors at 15 (β= .15), controlling for the prior levels of problem behavior and individual assets at age 12 and within-time covariance. Problem behavior at 15 was not associated with individual assets at 17 (β= - .09, p = .14). Including covariates in Model 7 did not change the significance of path coefficients including cross-lagged associations (Model 8; Figure 1). Prenatal exposure to cocaine (β= .10), non-African-American race (β= -.11), and greater violence exposure (β= .38), were associated with more problem behaviors at age 12; female gender was associated with greater problem behaviors at age 15 (β= -.12); and greater violence exposure (β= -.14) was associated with lower individual assets at age 12. Approximately 40% of the total variance in individual assets at age 17 and 36% of the total variance in problem behavior at age 15 were accounted for by Model 8.
Figure 1. Autoregressive cross-lagged structural equation model on the association between individual assets and problem behaviors in at-risk adolescents for the overall study sample (N = 373).
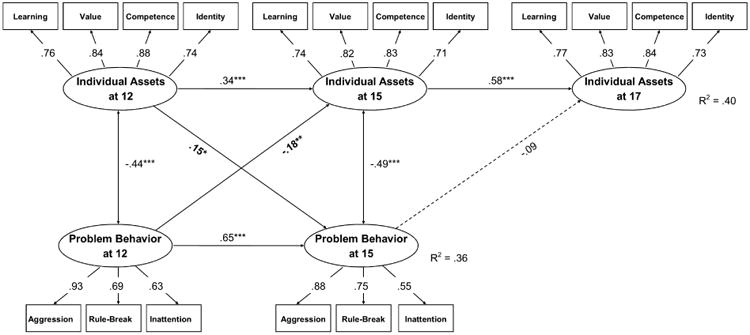
χ2 (222) = 399.92, p < .001, CFI = .950, TLI = .932, RMSEA = .046 (.039 - .054). Single-arrowed lines represent standardized path coefficients whereas double-arrowed lines represent correlations. Solid lines indicate statistically significant coefficients (p < .05) whereas dotted lines indicate non-significant coefficients (p > .05). Estimates are adjusted for prenatal exposure to cocaine, gender, race, violence exposure, HOME scores, and IQ. Covariates and errors associated with the measurement model were not reported for parsimony. Learning = commitment to learning; value = positive value; competence = social competence; identity = positive identity; rule-break = rule-breaking behavior.
*p < .05; ** p < .01; *** p <.001.
Gender variation
Since adding covariates did not substantially change the magnitude of path coefficients, measurement invariance across gender was tested using Model 7 (with no covariates) to reduce computation burden. The fully unconstrained measurement model allowing all parameters to vary across two groups (Model 9) yielded an excellent model fit, χ2 (244) = 326.0, p < .001, CFI= .976, TLI= .966, RMSEA= .030 (90% CI= .021 - .038). Constraining factor loadings to be equivalent across gender (Model 10) did not worsen the model fit from Model 9, Δχ2 (6) = 8.33, p = .22. However, constraining intercepts to be equivalent across gender (Model 11) produced a worsened model fit than Model 10, Δχ2 (18) = 66.31, p < .001. Since gender differences were noted in DAP commitment to learning at all three assessments and positive identity at age 17 and in YSR aggression at age 15 (Table 1), these five intercepts were allowed to vary (Model 11a), χ2 (263) = 357.66, p < .001, CFI= .972, TLI= .964, RMSEA= .031 (90% CI= .022 - .039), yielding an improved model fit. Although the Δχ2 relative to Model 10 (in which no constraints were imposed on the intercepts) was still significant, Δχ2 (13) = 23.33, p = .04, the decline in CFI was negligible (< .01), supporting partial scalar invariance. Thus, Model 11a was used as the measurement model in subsequent multi-group analyses. Finally, imposing equal constrains on structural paths (stability and cross-lagged path) across gender (Model 12) produced adequate model fit, χ2 (269) = 369.07, p < .001, CFI= .970, TLI= .962, RMSEA= .032 (90% CI= .023 -.039), with insignificant Δχ2 (6) = 11.41, p = .076, indicating no significant gender variation. Again, adding covariates (Model 13) did not change the significance of the path coefficients. Among females, prenatal exposure to cocaine (β= .16) and greater violence exposure (β= .21) were associated with more problem behaviors at age 12. Among males, non-African-American race (β= -.26) was associated with more problem behaviors at age 12; greater violence exposure was associated with more problem behaviors (β= .59) as well as with lower individual assets (β=-.19) both at age 12. Table 2 summarizes fit indices for various models estimated. Figure 2 presents gender-specific standardized coefficients that were adjusted for covariates before equivalence was forced on structural paths (Model 13) to show non-significant yet seemingly nuanced gender difference. Although statistical significance of gender difference was not achieved (p = .076), the link between higher individual assets at age 12 and more problem behavior at age 15 seems more relevant for boys than girls, while the link between more problem behaviors at 12 and less individual assets at 15 seems more relevant for girls. Also, boys reported less stability in individual assets from ages 15 to 17 compared to girls. The estimated model accounted for 52% of the total variance in internal assets in girls and 29% in boys at age 17; and 41% of the total variance in problem behavior in girls and 31% in boys at age 15.
Table 2. Model Comparisons.
| χ2(df) | Δχ2(Δdf) | p | CFI | TLI | RMSEA (90% CI) | ||
|---|---|---|---|---|---|---|---|
| Measurement model | |||||||
| Model 1. | CFA model | 159.13 (110) | — | — | .985 | .977 | .035 (.022 - .046) |
| Model 2. | Model 1 with factor loadings constrained across time | 209.59 (118) | 50.46 (8) | < .001 | .972 | .960 | .046 (.035 - .056) |
| Model 2a. | Model 2 without constraining delinquency | 167.14 (117) | 8.01 (7)e | .33 | .985 | .978 | .034 (.021 - .045) |
| Model 3. | Model 2a trimmeda | 167.40 (120) | 0.26 (3) | .97 | .986 | .980 | .033 (.020 - .045) |
| Structural modelb | |||||||
| Model 4. | Model 3 with stability paths & synchronous associations only | 183.91 (125) | — | — | .982 | .976 | .034 (.024 - .046) |
| Model 5. | Model 4 with a cross-lagged path from individual assets to problem behavior | 180.28 (124) | 3.89 (1) | .049 | .983 | .977 | .035 (.023 - .046) |
| Model 6. | Model 4 with cross-lagged paths from problem behavior to individual assets | 176.49 (123) | 7.2 (2)f | .02 | .984 | .978 | .034 (.022 - .045) |
| Model 7. | Model 4 with all cross-lagged paths | 170.99 (122) | 12.92 (3)f | .005 | .985 | .979 | .033 (.020 - .044) |
| Model 8. | Model 7 with significant (p < .10) covariatesc | 399.92 (222) | — | — | .950 | .932 | .046 (.039 - .054) |
| Gender (multi-group) comparison | |||||||
| Model 9. | Model 7 without gender constrained | 326.00 (244) | — | — | .976 | .966 | .030 (.021 - .038) |
| Model 10. | Model 9 with factor loadings constrained | 334.33 (250) | 8.33 (6) | .22 | .975 | .966 | .030 (.021 - .038) |
| Model 11. | Model 10 with measurement intercepts constrained | 400.64 (268) | 66.31 (18) | < .001 | .961 | .950 | .037 (.029 - .044) |
| Model 11a. | Model 11 with 5 measurement interceptsd freed | 357.66 (263) | 23.33 (13)g | .04 | .972 | .964 | .031 (.022 - .039) |
| Model 12. | Model 11a with structural (cross-lagged & stability) paths constrained | 369.07 (267) | 11.41 (6) | .076 | .970 | .962 | .032 (.023 - .039) |
| Model 13. | Model 11a with covariates | 635.85 (429) | — | — | .944 | .926 | .036 (.030 - .042) |
All models are significant (p < .01). CFI = comparative fit index; TLI = Tucker-Lewis index; RMSEA = root mean square error of approximation; CI = confidence intervals; CFA = confirmatory factor analysis.
Non-significant (p > .10) measurement error correlations across time (aggression at age 12 & aggression at age 15; social competencies at age 12 & social competencies at age 15; social competencies at age 12 & social competencies at age 17) from Model 2 were deleted.
Non-significant (p > .10) paths from Model 2 (paths from DAP at age 12 to DAP at age 17 and from problem behavior at age 12 to DAP at age 17) were deleted.
Included covariates are prenatal exposure to cocaine, gender, race, violence exposure, HOME score, and IQ.
Commitment to learning at all three assessments, Aggression at age 15, and Positive Identity at age 17.
Comparison from Model 1.
Comparison from Model 4.
Comparison from Model 10.
Figure 2. Standardized coefficients from the multiple-group cross-lagged structural equation model, with female data (n = 199) presented before the slash and male's (n = 174) after the slash.
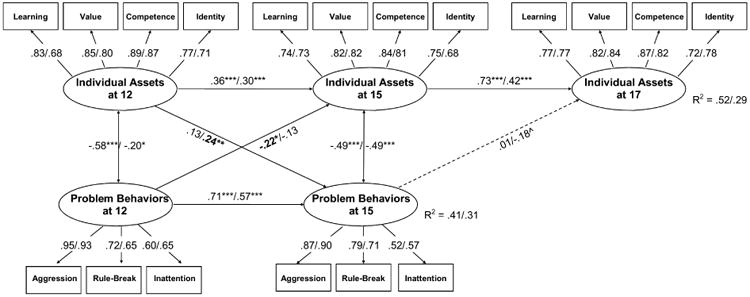
χ2(429) = 635.85, p < .001, CFI = .944, TLI = .926, RMSEA = .036 (.030 - .042). Single-arrowed lines represent path coefficients whereas double-arrowed lines represent correlations. Solid lines indicate statistically significant coefficients (p < .05) for at least one of groups whereas dotted lines indicate nonsignificant coefficients (p > .05). Estimates are adjusted for prenatal exposure to cocaine, gender, race, violence exposure, HOME scores, and IQ. Covariates and errors associated with the measurement model were not reported for parsimony. Learning = commitment to learning; value = positive value; competence = social competence; identity = positive identity; rule-break = rule-breaking behavior.
*p < .05; ** p < .01; *** p <.001; ^ p < .10.
Discussion
The present study examined the longitudinal relationships between individual assets and problem behaviors in adolescents at high risk for maladjustment, as they were mostly offspring of mothers with low SES and a history of substance use during pregnancy. More behavioral problems at age 12 were prospectively related to fewer individual assets at age 15, while greater individual assets at age 12 were related to more behavioral problems at age 15, after controlling for the prior levels of problem behavior and individual assets and within-time covariance. However, no relationship was found between problem behavior at age 15 and individual assets at 17. Follow-up analyses indicated non-significant yet nuanced gender difference in temporal relationships between individual assets and behavioral problems. While more problem behaviors at age 12 were prospectively associated with less individual assets at age 15 in girls, no such association was evident in boys. Instead, greater individual assets at age 12 were associated with more problem behaviors at age 15 in boys.
Our finding of the prospective link between greater individual assets and more problem behaviors, especially in boys, is in line with studies reporting aggression in urban high risk environments as normative and adaptive to achieve personal goals and gain high social status (Waasdorp et al., 2013; Kiefer & Ryan, 2008; Garandeau, Ahn, & Rodkin, 2011). In response to multiple challenges in chronically adverse settings characterized by poverty, substance use problems, discordant families, violent neighborhoods and racial discrimination and feelings of invisibility, African American boys may develop an attitude of bravado (e.g., violence as manly, danger as exciting) that encourages aggression and risk taking (Cunningham & Meunier, 2004; Stevenson, 1997). The bravado attitude may lead to an overrated sense of competence (Cairns & Cairns, 1994), which may in turn increase interpersonal aggression (Hughes et al., 1997). Thus, factors typically considered to be promoting and protective (e.g., social competence) may have differential implications for adolescents in highly adverse settings. For these adolescents, efforts to promote individual assets may not necessarily lower the risk of engaging in problem behaviors, especially among boys, unless those efforts address the adaptive functions of problem behaviors (Ellis et al., 2012).
Problem behavior at age 12 was prospectively related to lower individual assets at age 15, consistent with another longitudinal study that utilized samples from less disadvantaged backgrounds (Racz et al., 2017), but not between age 15 and 17. These seemingly inconsistent findings may reflect complex interrelationships of problem behavior and individual assets that may vary by age/developmental stage (Benson, Scales, Hamilton, & Sesma, 2006), pointing to an important direction for future research.
Identifying ecological resources or risk/protective factors that might account for some of the common variance in the complex relationships between individual assets and problem behaviors (quantified as within-wave associations) may be critical in facilitating optimal adolescent development and preventing problem behavior. In the present study, violence exposure was related to both fewer individual assets and greater behavioral problems at age 12, underscoring its significance in shaping adjustment. Chronic, multiple exposures to violence overburden adolescents' coping resources, undermining the ability to respond effectively to stressful situations (Min et al., 2017), which has been shown to increase the risk of psychopathology (Grant et al., 2003) and substance use (Minnes et al., 2014, 2017). Interventions and policies that are aimed, directly or indirectly, at reducing violence and enhancing safety of home, school, and community may contribute to optimal adolescence development (Abt & Winship, 2016; World Health Organization, 2010).
Limitations in our study must be noted. Relying on adolescents' self-report is influenced by adolescents' ability to assess and reflect on their own individual assets and behavior accurately. Having only two waves of data in problem behaviors assessed via the YSR, instead of three, limits our understanding of how problem behavior at age 17 may be affected by individual assets at ages 12 and 15. The relatively small sample size for multi-group SEM may be responsible for the lack of significant gender difference, calling for a replication study with a bigger sample size. The sample composition may limit generalizability of the findings to low-income, predominantly African American adolescents whose mothers lacked prenatal care and exhibited signs of intoxication at delivery. The present study was conceptualized from a variable-centered perspective, focusing on typical developmental associations between individual assets and problem behaviors. Although our analytic approach allowed for the prospective examination of the longitudinal interrelationships between study constructs in adolescence, it was based on an assumption, given the quite homogeneous sample characteristics, that adolescents in the sample may have a similar association, which may need to be scrutinized in future research. Nevertheless, the present study has a number of methodological strengths including its longitudinal prospective design, strong (93%) retention rate, use of well-validated, widely-used standardized measures, multiple potential confounders (prenatal cocaine exposure, violence exposure, quality of caregiving environment, IQ) controlled to rule out third variable explanations, and adapting a latent variable approach to reduce the influence of measurement errors in individual indicators on the accuracy of the results (Kline, 2005), all enhancing the validity of the findings.
In conclusion, this study extends understanding regarding the developmental process of problem behaviors and individual assets in at-risk urban, inner-city adolescents, complementing previous studies which mainly relied on White, middle-class youth. Continued studies into adulthood will uncover how individual assets and problem behaviors assessed in childhood and adolescence may affect social and vocational adjustment in this high risk population.
Acknowledgments
The authors would like to thank all of our families who participated in our research for 17 years. We would also like to thank Adelaide Lang, PhD for reviewing early drafts, and Laurie Ellison, LISW, and Paul Weishampel, MA for research assistance. This research was supported by National Institute on Drug Abuse Grants R01-07957 and R01-042747.
Footnotes
Publisher's Disclaimer: This is a PDF file of an unedited manuscript that has been accepted for publication. As a service to our customers we are providing this early version of the manuscript. The manuscript will undergo copyediting, typesetting, and review of the resulting proof before it is published in its final citable form. Please note that during the production process errors may be discovered which could affect the content, and all legal disclaimers that apply to the journal pertain.
References
- Abt T, Winship C. What works in reducing community violence: A meta-review and field study for the northern triangle. Washington, DC: United States Agency for International Development; 2016. Retrieved from https://www.usaid.gov/sites/default/files/USAID-2016-What-Works-in-Reducing-Community-Violence-Final-Report.pdf. [Google Scholar]
- Achenbach TM, Rescorla LA. Manual for the ASEBA school-age forms & profiles. Burlington, VT: University of Vermont, Research Center for Children, Youth, & Families; 2001. [Google Scholar]
- Allen JP, Porter MR, McFarland FC, Marsh P, McElhaney KB. The two faces of adolescents' success with peers: Adolescent popularity, social adaptation, and deviant behavior. Child Development. 2005;76(3):747–760. doi: 10.1111/j.1467-8624.2005.00875.x. [DOI] [PMC free article] [PubMed] [Google Scholar]
- Arbeit MR, Johnson SK, Champine RB, Greenman KN, Lerner JV, Lerner RM. Profiles of problematic behaviors across adolescence: Covariations with indicators of positive youth development. Journal of Youth and Adolescence. 2014;43(6):971–990. doi: 10.1007/s10964-014-0092-0. [DOI] [PubMed] [Google Scholar]
- Bada HS, Bann CM, Bauer CR, Shankaran S, Lester B, LaGasse L, et al. Higgins R. Preadolescent behavior problems after prenatal cocaine exposure: Relationship between teacher and caretaker ratings (Maternal Lifestyle Study) Neurotoxicology and Teratology. 2011;33(1):78–87. doi: 10.1016/j.ntt.2010.06.005. [DOI] [PMC free article] [PubMed] [Google Scholar]
- Benson PL, Scales PC, Hamilton SF, Sesma A. Positive youth development: Theory, research, and applications. John Wiley & Sons, Inc; 2006. [Google Scholar]
- Boles S, Biglan A, Smolkowski K. Relationships among negative and positive behaviours in adolescence. Journal of Adolescence. 2006;29(1):33–52. doi: 10.1016/j.adolescence.2005.01.007. [DOI] [PubMed] [Google Scholar]
- Brown S. Understanding youth and crime: Listening to youth? Buckingham, UK: Open University Press; 1998. [Google Scholar]
- Burt KB, Roisman GI. Competence and psychopathology: Cascade effects in the NICHD study of early child care and youth development. Development and Psychopathology. 2010;22(3):557–567. doi: 10.1017/S0954579410000271. [DOI] [PubMed] [Google Scholar]
- Byrne BM, Shavelson RJ, Muthén B. Testing for the equivalence of factor covariance and mean structures: The issue of partial measurement invariance. Psychological Bulletin. 1989;105(3):456–466. doi: 10.1037/0033-2909.105.3.456. [DOI] [Google Scholar]
- Cairns RB, Cairns BD. Lifelines and risks: Pathways of youth in our time. New York: Cambridge University Press; 1994. [Google Scholar]
- Caldwell BM, Bradley RH. HOME Inventory Early Adolescent Version. Little Rock, AR: University of Arkansas for Medical Sciences; 2003. [Google Scholar]
- Cheung GW, Rensvold RB. Evaluating goodness-of-fit indexes for testing measurement invariance. Structural Equation Modeling. 2002;9(2):233–255. doi: 10.1207/S15328007SEM0902_5. [DOI] [Google Scholar]
- Cunningham M, Meunier LN. The influence of peer experiences on bravado attitudes among African American males. In: Way N, Chu JY, editors. Adolescent boys: Exploring diverse cultures of boyhood. New York: New York University Press; 2004. pp. 219–232. [Google Scholar]
- Ellis BJ, Del Giudice M, Dishion TJ, Figueredo AJ, Gray P, Griskevicius V, et al. Wilson DS. The evolutionary basis of risky adolescent behavior: Implications for science, policy, and practice. Developmental Psychology. 2012;48(3):598–623. doi: 10.1037/a0026220. [DOI] [PubMed] [Google Scholar]
- Frank DA, Rose-Jacobs R, Crooks D, Cabral HJ, Gerteis J, Hacker KA, et al. Heeren T. Adolescent initiation of licit and illicit substance use: Impact of intrauterine exposures and post-natal exposure to violence. Neurotoxicology and Teratology. 2011;33(1):100–109. doi: 10.1016/j.ntt.2010.06.002. [DOI] [PMC free article] [PubMed] [Google Scholar]
- Frankenhuis WE, Del Giudice M. When do adaptive developmental mechanisms yield maladaptive outcomes? Developmental Psychology. 2012;48(3):628–646. doi: 10.1037/a0025629. [DOI] [PubMed] [Google Scholar]
- Garandeau CF, Ahn HJ, Rodkin PC. The social status of aggressive students across contexts: the role of classroom status hierarchy, academic achievement, and grade. Developmental psychology. 2011;47(6):1699–1710. doi: 10.1037/a0025271. [DOI] [PubMed] [Google Scholar]
- Garry JP, Morrissey SL. Team sports participation and risk-taking behaviors among a biracial middle school population. Clinical Journal of Sport Medicine. 2000;10(3):185–190. doi: 10.1097/00042752-200007000-00006. [DOI] [PubMed] [Google Scholar]
- Grant KE, Compas BE, Stuhlmacher AF, Thurm AE, McMahon SD, Halpert JA. Stressors and child and adolescent psychopathology: moving from markers to mechanisms of risk. Psychological Bulletin. 2003;129(3):447–466. doi: 10.1037/0033-2909.129.3.447. [DOI] [PubMed] [Google Scholar]
- Hall GS. Adolescence: Its psychology and its relations to physiology, anthropology, sociology, sex, crime, religion and education. New York: D. Appleton and Company; 1904. [Google Scholar]
- Hu LT, Bentler PM. Fit indices in covariance structure modeling: Sensitivity to underparameterized model misspecification. Psychological Methods. 1998;3(4):424–453. doi: 10.1037/1082-989X.3.4.424. [DOI] [Google Scholar]
- Hughes JN, Cavell TA, Grossman PB. A positive view of self: Risk or protection for aggressive children? Development and Psychopathology. 1997;9(1):75–94. doi: 10.1017/s0954579497001077. [DOI] [PubMed] [Google Scholar]
- Jelicic H, Bobek DL, Phelps E, Lerner RM, Lerner JV. Using positive youth development to predict contribution and risk behaviors in early adolescence: Findings from the first two waves of the 4-H Study of positive youth development. International Journal of Behavioral Development. 2007;31(3):263–273. doi: 10.1177/0165025407076439. [DOI] [Google Scholar]
- Kiefer SM, Ryan AM. Striving for social dominance over peers: The implications for academic adjustment during early adolescence. Journal of Educational Psychology. 2008;100(2):417–428. [Google Scholar]
- Kline RB. Principles and practice of structural equation modeling. 2nd. New York: Guilford Press; 2005. [Google Scholar]
- Lerner RM. Theories of human development: Contemporary perspectives. In: Damon W, Lerner RM, editors. Handbook of child psychology: Vol 1 Theoretical model of human development. 5th. New York: Wiley; 1998. pp. 1–24. [Google Scholar]
- Lewin-Bizan S, Bowers EP, Lerner RM. One good thing leads to another: Cascades of positive youth development among American adolescents. Development and Psychopathology. 2010a;22(4):759–770. doi: 10.1017/S0954579410000441. [DOI] [PubMed] [Google Scholar]
- Lewin-Bizan S, Lynch AD, Fay K, Schmid K, McPherran C, Lerner JV, Lerner RM. Trajectories of positive and negative behaviors from early-to middle-adolescence. Journal of Youth and Adolescence. 2010b;39(7):751–763. doi: 10.1007/s10964-010-9532-7. [DOI] [PubMed] [Google Scholar]
- Little TD. Mean and covariance structures (MACS) analyses of cross-cultural data: Practical and theoretical issues. Multivariate Behavioral Research. 1997;32(1):53–76. doi: 10.1207/s15327906mbr3201_3. [DOI] [PubMed] [Google Scholar]
- Martin KA. Puberty, sexuality, and the self: Boys and girls at adolescence. New York: Routledge; 1996. [Google Scholar]
- Masten AS, Curtis WJ. Integrating competence and psychopathology: Pathways toward a comprehensive science of adaptation in development. Development and psychopathology. 2000;12(3):529–550. doi: 10.1017/s095457940000314x. [DOI] [PubMed] [Google Scholar]
- Mayeux L, Sandstrom MJ, Cillessen AH. Is being popular a risky proposition? Journal of Research on Adolescence. 2008;18(1):49–74. doi: 10.1111/j.1532-7795.2008.00550.x. [DOI] [Google Scholar]
- Mays D, DePadilla L, Thompson NJ, Kushner HI, Windle M. Sports participation and problem alcohol use: A multi-wave national sample of adolescents. American Journal of Preventive Medicine. 2010;38(5):491–498. doi: 10.1016/j.amepre.2010.01.023. [DOI] [PMC free article] [PubMed] [Google Scholar]
- Miller P, Sperry LL. The socialization of anger and aggression. Merrill-Palmer Quarterly. 1987;33(1):1–31. [Google Scholar]
- Min MO, Minnes S, Kim JY, Yoon M, Singer LT. Association of prenatal cocaine exposure, childhood maltreatment, and responses to stress in adolescence. Drug and Alcohol Dependence. 2017;177:93–100. doi: 10.1016/j.drugalcdep.2017.03.028. [DOI] [PMC free article] [PubMed] [Google Scholar]
- Min MO, Minnes S, Lang A, Weishampel P, Short EJ, Yoon S, Singer LT. Externalizing behavior and substance use related problems at 15 years in prenatally cocaine exposed adolescents. Journal of Adolescence. 2014a;37(3):269–279. doi: 10.1016/j.adolescence.2014.01.004. [DOI] [PMC free article] [PubMed] [Google Scholar]
- Min MO, Minnes S, Lang A, Yoon S, Singer LT. Effects of prenatal cocaine exposure on early sexual behavior: Gender difference in externalizing behavior as a mediator. Drug and Alcohol Dependence. 2015;153:59–65. doi: 10.1016/j.drugalcdep.2015.06.009. [DOI] [PMC free article] [PubMed] [Google Scholar]
- Min MO, Minnes S, Yoon S, Short EJ, Singer LT. Self-reported adolescent behavioral adjustment: effects of prenatal cocaine exposure. Journal of Adolescent Health. 2014b;55(2):167–174. doi: 10.1016/j.jadohealth.2013.12.032. [DOI] [PMC free article] [PubMed] [Google Scholar]
- Minnes S, Min MO, Kim JY, Francis MW, Lang A, Wu M, Singer LT. The association of prenatal cocaine exposure, externalizing behavior and adolescent substance use. Drug and Alcohol Dependence. 2017;176:33–43. doi: 10.1016/j.drugalcdep.2017.01.027. [DOI] [PMC free article] [PubMed] [Google Scholar]
- Minnes S, Singer LT, Kirchner HL, Short E, Lewis B, Satayathum S, Queh D. The effects of prenatal cocaine exposure on problem behavior in children 4-10 years. Neurotoxicology and Teratology. 2010;32(4):443–451. doi: 10.1016/j.ntt.2010.03.005. [DOI] [PMC free article] [PubMed] [Google Scholar]
- Minnes S, Singer L, Min MO, Wu M, Lang A, Yoon S. Effects of prenatal cocaine/polydrug exposure on substance use by age 15. Drug and Alcohol Dependence. 2014;134:201–210. doi: 10.1016/j.drugalcdep.2013.09.031. [DOI] [PMC free article] [PubMed] [Google Scholar]
- Phelps E, Balsano AB, Fay K, Peltz JS, Zimmerman SM, Lerner RM, Lerner JV. Nuances in early adolescent developmental trajectories of positive and problematic/risk behaviors: Findings from the 4-H study of positive youth development. Child and Adolescent Psychiatric Clinics of North America. 2007;16(2):473–496. doi: 10.1016/j.chc.2006.11.006. [DOI] [PubMed] [Google Scholar]
- Racz SJ, Putnick DL, Suwalsky JT, Hendricks C, Bornstein MH. Cognitive abilities, social adaptation, and externalizing behavior problems in childhood and adolescence: Specific cascade effects across development. Journal of Youth and Adolescence. 2017;46(8):1688–1701. doi: 10.1007/s10964-016-0602-3. [DOI] [PMC free article] [PubMed] [Google Scholar]
- Richardson GA, Goldschmidt L, Larkby C, Day NL. Effects of prenatal cocaine exposure on adolescent development. Neurotoxicology and Teratology. 2015;49:41–48. doi: 10.1016/j.ntt.2015.03.002. [DOI] [PMC free article] [PubMed] [Google Scholar]
- Ridenour TA, Clark DB, Cottler LB. The illustration-based Assessment of Liability and EXposure to Substance use and Antisocial behavior© for children. The American Journal of Drug and Alcohol Abuse. 2009;35(4):242–252. doi: 10.1080/00952990902998715. [DOI] [PubMed] [Google Scholar]
- Rodkin PC, Farmer TW, Pearl R, Acker RV. They're cool: Social status and peer group supports for aggressive boys and girls. Social Development. 2006;15(2):175–204. doi: 10.1046/j.1467-9507.2006.00336.x. [DOI] [Google Scholar]
- Rodkin PC, Farmer TW, Pearl R, Van Acker R. Heterogeneity of popular boys: Antisocial and prosocial configurations. Developmental Psychology. 2000;36:14–24. doi: 10.1037//0012-1649.36.1.14. [DOI] [PubMed] [Google Scholar]
- Scales PC. Youth developmental assets in global perspective: results from international adaptions of the Developmental Assets Profile. Child Indicators Research. 2011;4:619–645. [Google Scholar]
- Scales PC, Benson PL, Leffert N, Blyth DA. Contribution of developmental assets to the prediction of thriving among adolescents. Applied Developmental Science. 2000;4(1):27–46. doi: 10.1207/S1532480XADS0401_3. [DOI] [Google Scholar]
- Scales PC, Leffert N. Developmental assets: A synthesis of the scientific research on adolescent development. 2nd. Minneapolis, MN: Search Institute; 2004. [Google Scholar]
- Schwartz SJ, Pantin H, Coatsworth JD, Szapocznik J. Addressing the challenges and opportunities for today's youth: Toward an integrative model and its implications for research and intervention. The Journal of Primary Prevention. 2007;28(2):117–144. doi: 10.1007/s10935-007-0084-x. [DOI] [PubMed] [Google Scholar]
- Schwartz SJ, Phelps E, Lerner JV, Huang S, Brown CH, Lewin-Bizan S, et al. Lerner RM. Promotion as prevention: Positive youth development as protective against tobacco, alcohol, illicit drug, and sex initiation. Applied Developmental Science. 2010;14(4):197–211. doi: 10.1080/10888691.2010.516186. [DOI] [Google Scholar]
- Search Institute. Developmental assets profile: User manual. Minneapolis, MN: Search Institute; 2005. [Google Scholar]
- Singer LT, Minnes S, Short E, Arendt R, Farkas K, Lewis B, et al. Kirchner HL. Cognitive outcomes of preschool children with prenatal cocaine exposure. JAMA. 2004;291(20):2448–2456. doi: 10.1001/jama.291.20.2448. [DOI] [PMC free article] [PubMed] [Google Scholar]
- Singer LT, Nelson S, Short E, Min MO, Lewis B, Russ S, Minnes S. Prenatal cocaine exposure: drug and environmental effects at 9 years. The Journal of Pediatrics. 2008;153(1):105–111. doi: 10.1016/j.jpeds.2008.01.001. [DOI] [PMC free article] [PubMed] [Google Scholar]
- Sørlie MA, Hagen KA, Ogden T. Social competence and antisocial behavior: Continuity and distinctiveness across early adolescence. Journal of Research on Adolescence. 2008;18(1):121–144. doi: 10.1111/j.1532-7795.2008.00553.x. [DOI] [Google Scholar]
- Steenkamp JE, Baumgartner H. Assessing measurement invariance in cross-national consumer research. Journal of Consumer Research. 1998;25:78–90. [Google Scholar]
- Stevenson HC., Jr Missed, Dissed, and Pissed“: Making Meaning of Neighborhood Risk, Fear and Anger Management in Urban Black Youth. Cultural Diversity and Mental Health. 1997;3(1):37–52. [PubMed] [Google Scholar]
- Warren MT, Wray-Lake L, Rote WM, Shubert J. Thriving while engaging in risk? Examining trajectories of adaptive functioning, delinquency, and substance use in a nationally representative sample of U.S. adolescents. Developmental Psychology. 2016;52(2):296–310. doi: 10.1037/a0039922. [DOI] [PubMed] [Google Scholar]
- Waasdorp TE, Baker CN, Paskewich BS, Leff SS. The association between forms of aggression, leadership, and social status among urban youth. Journal of youth and adolescence. 2013;42(2):263–274. doi: 10.1007/s10964-012-9837-9. [DOI] [PMC free article] [PubMed] [Google Scholar]
- Wechsler D. Wechsler Intelligence Scale for Children–Fourth Edition (WISC-IV) administration and scoring manual. San Antonio, TX: The Psychological Corporation; 2003. [Google Scholar]
- World Health Organization. Violence prevention: The evidence. 2010 Retrieved from http://apps.who.int/iris/bitstream/10665/77936/1/9789241500845_eng.pdf.
- Zarrett N, Fay K, Li Y, Carrano J, Phelps E, Lerner RM. More than child's play: Variable-and pattern-centered approaches for examining effects of sports participation on youth development. Developmental Psychology. 2009;45(2):368–382. doi: 10.1037/a0014577. [DOI] [PubMed] [Google Scholar]