

Abstract
An isomeric mixture of homogeranyl/homoneryl triazole bisphosphonates (VSW1198) has previously been shown to be a potent inhibitor of geranylgeranyl diphosphate (GGDP) synthase (GGDPS) and of therapeutic interest for the treatment of multiple myeloma. We have developed and validated a selective and sensitive liquid chromatography coupled with tandem mass spectrometry (LC-MS/MS) method for the simultaneous quantitation of both the E- and Z-isomers of VSW1198 in cell culture media, mouse plasma and tissues. VSW1198 and internal standard are extracted from the bio-matrices by solid-phase extraction, followed by derivatization using trimethylsilyldiazomethane. The chromatographic separation of analytes was achieved on a Phenomenex Gemini NX column (150mm*2.0mm, 5μ) with gradient elution using 0.1 % acetic acid and methanol/acetonitrile (1:1) as the mobile phase at a flow rate of 0.2 mL/min. Derivatized analytes were ionized with an electrospray ionization source in positive multiple reaction monitoring (MRM) mode and quantitated using MS/MS. The MS/MS response was linear over the concentration range from 0.38–1500 and 0.13 to 500 ng/mL for the E- and Z-isomers, respectively. The within- and between-day precision (relative standard deviation, % RSD) and accuracy were within the acceptable limits per FDA guidelines. The validated method was used for quantitative determination of the compounds in preclinical studies focused on the development of VSW1198 as a novel anti-cancer agent.
Keywords: Geranylgeranyl Diphosphate Synthase Inhibitor, GGDP, GGPP, LC, MS/MS
1. Introduction
Geranylgeranyl diphosphate synthase (GGDPS) is an important enzyme in the isoprenoid biosynthetic pathway as it catalyzes the synthesis of the 20-carbon isoprenoid GGDP that is used in protein prenylation reactions and as a precursor to longer chain isoprenoid species. There has been significant interest in the therapeutic potential of GGDPS inhibitors, particularly with respect to anti-cancer activity.[1, 2] Recently, our group reported on the synthesis and activity of VSW1198 (Figure 1), which is a 3:1 mixture of E- and Z-olefin isomers [3]. VSW1198 is the most potent GGDPS inhibitor reported to date, with an IC50 of 45 nM against GGDPS, cellular activity at concentrations as low as 30 nM, and high selectivity for GGDPS over the related enzyme farnesyl diphosphate synthase (FDPS).[3] Studies evaluating the activity of the individual isomers have revealed that the two isomers interact in a synergistic manner to inhibit GGDPS.[4] To support pharmacokinetic and metabolism studies of VSW1198, the development of an accurate, rapid and reproducible bioanalytical method was essential.
Figure 1. Chemical structure of (a) VSW1198 and (b) RAM1147.

Quantitative analysis of bisphosphonates in bio-matrices such as plasma or tissue homogenate can be challenging due to their high polarity, retention difficulties on reversed phase columns, and their metal-chelating properties[5, 6]. In addition, bisphosphonates can be difficult to measure directly using MS because of poor ionization and lack of fragmentation ions. Derivatization of bisphosphonate compounds can alter the physiochemical properties and confer more favorable chromatographic and mass spectral properties. For example, bisphosphonates can be derivatized using diazomethane or trimethylsilyldiazomethane (TMS-DAM) to methylate the phosphonic acid groups thus reducing the polarity as well as neutralizing the charge of the compound. LC–MS/MS is currently considered the method of choice for the bioanalysis of bisphosphonates in bio-matrices because derivatized bisphosphonates demonstrated improved chromatographic separation and increased detection sensitivity.[7-11]
In this manuscript, we report a sensitive and selective LC-MS/MS method for the simultaneous quantification of the E- and Z-isomers of VSW1198 from plasma and tissues using solid phase extraction followed by derivatization with TMS-DAM. The method was used for the quantitative determination of VSW1198 in preclinical studies focused on the development of this inhibitor as a novel anti-cancer agent. This approach should be applicable to other structurally similar bisphosphonates.
2. Materials and Methods
2.1. Chemicals and reagents
VSW1198 was prepared as previously described [3] and obtained from Dr. David Wiemer, University of Iowa. TMS-DAM, LCMS-grade methanol (MeOH), acetonitrile (MeCN), acetic acid (AA), and formic acid (FA), were obtained from Fisher Scientific (Fair Lawn, NJ). Centrifuge tube filters were purchases from Corning Co. (Corning, NY). Ultrapure water was obtained from a water purification system (Thermo Fisher Scientific). All other reagents used in the study were of analytical grade or higher and procured from standard chemical suppliers.
2.2. Synthesis of RAM1147: Sodium (E:Z)-3-(1-(3,7-dimethylocta-2,6-dien-1-yl)-1H-1,2,3-triazol-4-yl)-2-phosphonopropanoate
Compound 1 (300 mg, 0.66 mmol) (Figure 2) in EtOH (13 mL) was treated with 1M NaOH (2.57 mL) and the solution was allowed to stir at reflux for 3.5 hr. After it had cooled to room temperature, the solution was acidified to pH 1 by addition of 1N HCl and diluted with water (20 mL). The mixture was extracted with EtOAc (3 × 20 mL), and the combined extracts were dried with MgSO4, filtered, and the filtrate was concentrated in vacuo. The carboxylic acid intermediate was added to an oven dried flask containing CH2Cl2 (16 mL) at 0 °C. The resulting solution was treated with collidine (0.45 mL, 3.43 mmol) and TMSBr (0.44 mL, 3.43 mmol),[12] and the reaction was allowed to stir overnight while warming to room temperature. To the solution was added toluene (15 mL), the volatile components were removed by rotary evaporation, and the cycle was repeated three times. To the resulting solid was added 1M NaOH (3.00 mL) and the reaction mixture was allowed to stir for 17 days. The volatiles were removed in vacuo, and the initial product was placed on an HP-20 column. Elution with water afforded the sodium salt of the carboxy phosphonic acid 2 as a white solid (70 mg, 24%).
Figure 2.

Synthesis of RAM1147: Sodium (E:Z)-3-(1-(3,7-dimethylocta-2,6-dien-1-yl)-1H-1,2,3-triazol-4-yl)-2-phosphonopropanoate.
Physiochemical characterization
Reported is the mixture of E and Z (1:1) isomers for the 1H NMR spectrum and the E-isomer in the 13C NMR spectrum: 1H NMR (300 MHz, D2O) δ 7.56 (s, 1H), 5.36–5.33 (t, J = 3.0 Hz, 1H), 5.03 (m, 1H), 4.85 (d, J = 7.5 Hz, 2H), 3.09–2.71 (m, 3H), 2.15–2.00 (m, 4H), 1.68 (s, 3H), 1.54 (s, 3H), 1.48 (s, 3H); 13C NMR (75 MHz, D2O) δ 179.9 (d, JCP = 3.6 Hz), 148.1 (d, J = 9.0 Hz), 143.7, 133.8, 123.6, 122.4, 117.1, 51.8 (d, JCP = 113.2 Hz), 47.7, 38.5, 25.6, 25.4, 24.8 (d, JCP = 1.9 Hz), 22.5, 16.9; 31P NMR δ 15.7; HRMS (ES−) m/z calculated for C15H23N3O5P (M–H)− 356.1375, found 356.1384. 1H and 13C NMR spectra for RAM1147 can be found in the supplementary Figures 1 and 2. Based on the NMR spectra, it is estimated that the mixture is composed of a 1:1 mixture of E:Z isomers.
2.3. Derivatization of analytes in neat solvents
RAM1147 was utilized as the internal standard (IS) in the method development. Both VSW1198 and RAM1147 were derivatized using TMS-DAM to methylate the phosphonic acid groups (Figure 3). Derivatized analyte and IS solutions (1 μg/mL) were prepared for the optimization of mass spectrometer settings as follows: aliquots of stock solutions were placed in glass tubes containing 10 μg/mL in methanol, 100 μL TMS-DAM reagent was added, and the samples were incubated for 30 min with gentle agitation at room temperature. The samples were evaporated to dryness under nitrogen and reconstituted in 100 μl 66:35 of 0.1% acetic acid: MeOH/MeCN (1:1).
Figure 3.

Derivatization schemes for (a) VSW1198 and (b) RAM1147 (IS).
2.4. Liquid chromatographic and mass spectrometric conditions
A Shimadzu, Nexera UPLC system equipped with a binary pump system (LC-30 AD), column oven (CTO-30AS) and an auto-sampler (SIL-30AC) was used. Mass spectrometric detection was performed on an LC-MS/MS 8060 system (Shimadzu Scientific Instruments, Columbia, MD), equipped with a dual ion source (DUIS) in positive electrospray ionization mode. The MS/MS system was operated at unit resolution in the multiple reaction monitoring (MRM) mode. All chromatographic separations were performed with a Phenomenex Gemini NX column (150 mm × 2 mm, 5μ, Phenomenex, Torrance CA) column equipped with a C18 guard column.
The mobile phase consisted of 0.1% acetic acid in water (mobile phase A) and methanol/ acetonitrile (1:1) (mobile phase B), at total flow rate of 0.2 mL/min. The initial mobile phase composition was 35% B, and increased in a linear manner to 90% B over 4 min, then held constant at 100% B for 5.0 min, and finally brought back to initial condition of 35% B in 0.2 min followed by 4-min re-equilibration. The injection volume of all samples was 20 μl.
The compound-dependent mass spectrometer parameters, such as temperature, voltage, gas pressure, etc., were optimized by the auto optimization method as included in the software via product ion search for derivatized analyte and the internal standard (IS) using a 1 μg/mL solution in methanol. All analytes were more readily detected in positive ionization mode after derivatization with TMS-DAM. The following mass spectrometer source settings were utilized: nebulizer gas: 2.0 L/min; heating gas: 10 L/min; drying gas: 10 L/min; interface temperature: 350 °C desolvation line temperature: 250 °C; heat block temperature: 400 °C. The MS/MS system was operated at unit resolution in the multiple reaction monitoring (MRM) mode, using precursor ion → product ion combinations of 464.15 → 282.1 m/z for both isomers of VSW and 400.2 → 264.1 m/z for the IS. Compound dependent parameters, such as voltage potential Q1, Q3, and collision energy (CE), were -21, -20, -25 V and -19, -30, -36 V for analytes (both E- and Z-isomer) and IS, respectively. Data acquisition and quantitation were performed using LabSolutions LCMS Ver.5.6 (Shimadzu Scientific, Inc., Columbia, MD).
2.5. Preparation of stock solutions, calibration standards and quality control samples
Individual stock solutions (1 mg/mL) of VSW1198 and RAM1147 were initially dissolved in 100 μL water and further diluted in 900 μL methanol. The stock solutions were diluted with methanol to make working standard solutions, which were further diluted to prepare the calibration standards (CCs) and quality control samples (QCs). CCs were prepared for analysis by spiking 10 μL of mixed working standard solution into 100 μL of plasma or tissue homogenate to obtain a concentration range using the following concertation of isomeric mixture of VSW1198, 0.5, 1, 5, 10, 50, 200,1000, and 2000 ng/mL, which is a 3:1 mixture of E-and Z-olefin isomers.” We used same matrix volume for both QCs, CCs and samples, to which we added 10uL of methanol instead of stock solution. The concentration ranged from 0.38–1500 and 0.14 to 500 ng/mL for E- and Z-isomers, respectively. QCs at four different concentrations for the E- and Z-isomer, including the lower limit of quantification (LLOQ; 0.38 and 0.13 ng/mL), low quality control (LQC; 1.5 and 0.5 ng/mL), middle quality control (MQC; 375 and 125 ng/mL) and high quality control (HQC; 1125 and 375 ng/mL), were prepared separately in five replicates, independent of CCs. All the main stocks, intermediate stocks, spiking calibration, and QCs stock solutions were kept at −20 °C until analysis.
2.6. Sample preparation and derivatization
All samples were prepared by spiking 10 μL of appropriate calibration stock in 100 μL of blank plasma or tissue homogenate and 10 μL of IS solution (2000 ng/mL) were added. The resulting solution was diluted with 2% formic acid in water (900 μL), vortexed for 30 seconds, and then loaded onto SPE cartridges (Oasis® HLB 3cc 30mg, Waters, Milford, MA) preconditioned with 2% formic acid (2 mL). Loaded cartridges were washed with 2% formic acid (2 mL) and eluted with 2 mL, NH4OH:2-Propanol:n-Hexane (1:7:12,v/v/v). For all standards and samples, eluates were evaporated under nitrogen at room temperature and reconstituted with MeOH (200 μL). After the TMS-DAM reagent (100 μL) was added, the samples were incubated for 30 min under sonication in a fume hood at room temperature. The samples were evaporated to dryness under nitrogen and reconstituted in 100 μl 66:35 of 0.1% acetic acid: MeOH/MeCN (1:1), vortex mixed, and loaded into LC-MS/MS for analysis.
2.7. Assay Validation
The developed LC-MS/MS method was fully validated according to the Guidance for Industry: Bioanalytical Method Validation of USFDA (FDA, 2001).[13]
Assay selectivity and specificity was determined by comparison of the chromatogram of six different blank mouse blood or tissue homogenate samples with that of VSW1198- and IS-spiked plasma samples. The sensitivity of the method was determined from the signal-to-noise ratio (S/N) of the analyte response in the calibration standards. The S/N ratio was required to be greater than three for the lower limit of detection (LOD) and greater than ten for the LLOQ.
The calibration curves were established through plots of the peak area ratio (analyte/IS) versus VSW1198 concentration. The peak area of E- and Z- isomer of IS was used for the E-and Z- isomer of VSW1198, respectively. Each calibration curve consisted of a blank sample, a zero sample (blank + IS), and eight non-zero concentrations. The acceptance criteria for each back calculated standard concentration were ± 15% standard deviation (SD) from the nominal value except at LLOQ, which was set at ± 20%. Carry-over was checked by injecting two zero samples directly after injecting an HQC sample. The response of the first zero sample was required to be < 20% of the response of a processed LLOQ sample.
Accuracy and precision (intra- and inter-day) were determined by analysis of five replicates of QC samples at four different levels (LLOQ, LQC, MQC, and HQC) in mouse plasma or tissue homogenate for three consecutive days. The precision was calculated in terms of relative standard deviation (% RSD). The accuracy was expressed as % bias. The criteria for acceptability of the data included accuracy within ± 15% standard deviation (S.D.) from the nominal values and a precision of within ± 15% relative standard deviation (R.S.D.), except for LLOQ, where it was required to not exceed ± 20% of accuracy as well as precision. Percent bias was calculated according to the following formula:
2.8. Recovery and matrix effect
The extraction recoveries at three different QC levels (i.e. LQC, MQC and HQC) were determined by comparison of the peak area of both isomers of VSW1198 in extracted samples with those obtained by equivalent concentration of pure authentic standards in methanol. Recovery of IS was determined in the same way.
The matrix effect was evaluated at three QC levels for each matrix. Blank mouse plasma and tissues from six different animals were processed. After extraction, the dry extract was spiked with analyte prepared equivalent to QCs. Mean peak area of the analytes spiked in the blank matrix was compared with QCs prepared in the methanol.
2.9. Dilution integrity
Dilution integrity was performed using two- and five-fold dilutions of the QCs sample. Six replicates of each concentration of isomeric mixture of VSW1198 at 3000 ng/mL (2250 and 750 ng/mL, E- and Z- isomer, respectively) and 7500 ng/mL (5250 and 1750 ng/mL, E- and Z-isomer, respectively). Samples were prepared in the corresponding matrixes, diluted to two- and five-fold dilutions, and analyzed against the fresh calibration curve.
2.10. Stability
The stability of VSW1198 in plasma samples following three freeze-thaw cycles (room temperature to -80 °C to room temperature), long-term sample storage (−80 °C for 30 days) and bench-top storage (20 °C for 8h) was assessed by determining reproducibility and accuracy at LQC, MQC and HQC concentrations (n = 3). Auto-sampler stability of extracted samples was evaluated at 4 °C for 36 h.
Assay validation was also performed in cell culture suspension for three consecutive days. Briefly, cell culture suspension was taken in place of plasma, and studies (matrix effect and accuracy precision) were performed as explained above (data not shown).
2.11. Animals, drug administration, and sampling
The University of Nebraska Medical Center Institutional Animal Ethics Committee (protocol number 16-132-11-FC) approved all animal studies. Female CD-1 mice, weight ranging from 25–30 grams were obtained from the Charles River Laboratory. Animals were housed in the University of Nebraska Medical Center animal facility at a temperature of 23–25 °C, relative humidity of 50–70% and 12/12 hour light/dark cycles. VSW1198 was dissolved in sterile saline and filter-sterilized. Drug (0.5 mg/kg in 100 μL) was administered via intravenous (IV) lateral tail vein administration.
3. Results
3.1. LC/MS/MS method of bisphosphonates derivatized with diazomethane
Chemical derivatization of bisphosphonates has been broadly used to enhance analyte sensitivity, improve chromatography characteristics, and help quantitate this class of compounds in bio-matrices.[7-9, 11] Bisphosphonates are hydrophilic compounds that are poorly retained on reversed phase sorbents. Methylation prior to LC/MS analysis is a viable technique to reduce the polarity of the bisphosphonates before column chromatography. TMS-DAM, commercially available as a 2 M ether solution, was chosen for chemical derivatization of VSW1198 (Figure 3). The tetramethyl ester derivative of VSW1198 readily ionized in positive ESI mode, resulting in substantially increased sensitivity of mass spectrometric detection.
After derivatization the mass spectrometric conditions were optimized for detection of VSW1198 and IS in electrospray ionization mode (ESI). During method optimization, the mass spectra for VSW1198 and IS revealed peaks at m/z 464.15, and 400.2, respectively as protonated molecular ions, [M + H]+. The fragmentation of analytes and IS were auto-optimized via precursor ion search of stock solution (1 mcg/mL) for each analyte. The most abundant precursor > product ions with the highest sensitivity for VSW1198 and RAM1147 were found to be m/z 464.15>282.1, and 400.2>264.1, respectively (Figure 4). The proposed fragmentation pattern of derivatized VSW1198 is shown in Figure 5.
Figure 4.
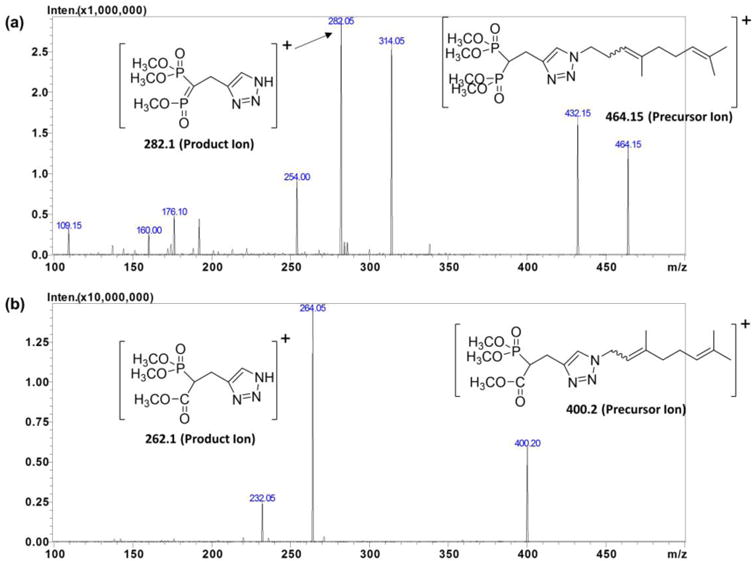
MS/MS product Ion spectra of derivatized (a) VSW1198 and (b) RAM1147 (IS).
Figure 5.

Proposed fragmentation pattern of derivatized VSW1198.
We found that the chemical derivatization led to an increase in hydrophobicity of the derivative, which provided greater flexibility in LC analysis allowing reversed-phase HPLC to be used for chromatographic separation (data not shown). Derivatization was also able to fix the carryover problem of analytes that was due to their metal-chelating properties. Therefore, reversed-phase chromatography conditions were selected and optimized for LC/MS/MS analyses. Chromatographic conditions, especially the composition of mobile phase and different analytical columns, were optimized to achieve good resolution and symmetric peak shapes of both isomers as well as a short run time. The versatility, suitability, and robustness of the method were checked with several C18, C8 and Cyano (CN) columns. Complete and rapid chromatographic resolution of analytes and IS was achieved on the Phenomenex Gemini NX column, 150 mm * 2.0 mm column, 5μ), with gradient elution using 0.1 % acetic acid and methanol/acetonitrile (1:1) as mobile phase at a flow rate of 0.2 mL/min. The addition of 0.1% formic acid in water could enhance the pH value of the mobile phase, which could improve the ionization efficiency and intensity of the signal response in positive modes during the ESI + process. The structural analogue of the analyte, RAM1147, was selected as the internal standard for this method. It has a similar derivatization and chromatographic behavior, did not prolong the analysis time, and had a similar ionization response in ESI mass spectrometry. In addition, the extraction recovery of this IS was satisfactory and it was stable during the entire analytical process.
VSW1198 was first isolated from the sample matrices by solid-phase extractions followed by methylation with TMS-DAM prior to LC-MS/MS. SPE extractions of the analyzed compounds from mice plasma and tissue samples were performed using silica-based C8 and C18 phase cartridges. The Oasis® HLB cartridge was found to have a high extraction efficiency for the analytes of interest and with a resulting clean baseline. The combination of NH4OH:2-Propanol:n-Hexane (1:7:12,v/v/v) as an elution solvent increased extraction efficiency (data not shown). It was found that low recoveries (∼35%) were obtained for both isomers of VSW1198 in plasma and tissue homogenates. Previous studies have found improved reproducibility and recovery with derivatization on the SPE absorbent for bisphosphonates in bio-matrices [7, 9, 14]. However, in our hands, solid phase extraction with post column derivatization provided more consisted, linear and reproducible results for VSW1198 (data not shown). In spite of relatively low recoveries, measurement of these analytes proved to be consistent, precise, reproducible and linear for both the E- and Z- isomer. Desorption conditions for both the desorbing solvent and its volume were investigated, to ensure effective elution of the analytes from the sorbent.
3.2. Assay validation
The specificity of the method was evaluated through analysis of blank blood or tissue homogenate samples from six different animals to investigate potential interferences at the retention time of all analytes and IS. No co-eluting peaks that were > 20% of the analytes area at LLOQ level and no co-eluting peaks > 5% of the area of IS were observed. Endogenous matrix interference was not found at retention times of VSW1198 (5.2 and 6.2 min E-and Z-, respectively) or IS (5.0 and 6.1 min E-and Z-, respectively) in plasma (Figure 6). Analytes and IS peak showed minimal variability in retention time with an RSD well within the acceptable limit of ± 5%.
Figure 6.
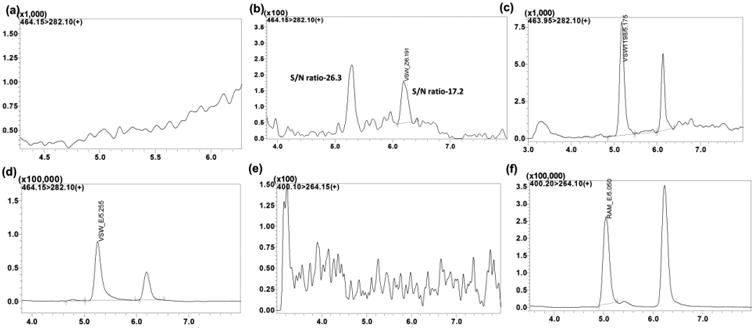
Representative MRM ion-chromatograms of (a) Blank mouse plasma using the conditions for VSW1198 detection, (b) Plasma spiked with VSW1198 showing the two isomers (E-isomer 5.2 min and Z-isomer 6.2 min, at LLOQ), (c) Plasma from treated mouse (24 hr time point) showing VSW1198 isomers, (d) Liver from treated mouse (24 hr time point) showing VSW 1198 isomers, (e) Blank plasma using the conditions for RAM1147 detection and (f) Plasma spiked with RAM1147 showing the two isomers (E-isomer 5.0 min and Z-isomer 6.1 min, 200 ng/mL).
The method exhibited a linear response over the concentration range from 0.38–1500 and 0.13 to 500 ng/mL for E- and Z- isomer, respectively, with a coefficient of determination of 0.998 or better. The standard curve was reproducible over the tested concentrations across the calibration range. The lowest concentration with a RSD <20% was taken as LLOQ and was found to be 0.38 and 0.13 ng/ml for the E- and Z- isomer respectively. The blank sample (Blank + IS) injected after HQC samples showed no significant interfering peak with all areas <5% of LLOQ demonstrating no carry over effect. The inter- and intra-day accuracy and precision results for the detection of VSW in plasma and tissue at four different concentrations are presented in Table 1. The RSD of precision values ranged from 4.1 to 11.5%, indicating acceptable assay precision. The accuracy of the quantitative analysis of the compounds was within the acceptance limits at all concentration levels.
Table 1.
The accuracy (% Bias) and precision (% RSD) of E- and Z-isomers of VSW1198 in mouse plasma.
| Concentration (ng/mL) | E-Isomer | Z-Isomer | ||||||
|---|---|---|---|---|---|---|---|---|
|
| ||||||||
| LLOQ | LQC | MQC | HQC | LLOQ | LQC | MQC | HQC | |
| Theoretical | 0.38 ng/mL | 1.50 ng/mL | 375 ng/mL | 1125 ng/mL | 0.13 ng/mL | 0.5 ng/mL | 125 ng/mL | 375 ng/mL |
|
| ||||||||
| %Biasintra-assay | 3.45 | -6.28 | 5.20 | -2.19 | 7.10 | 11.2 | 9.16 | 6.20 |
| %Biasinter-assay | 6.13 | 5.20 | -2.98 | 10.20 | 9.45 | -3.52 | -2.80 | 8.79 |
| %RSDintra-assay | 4.11 | 5.99 | 4.75 | 7.83 | 5.13 | 9.49 | 7.17 | 8.23 |
| %RSDinter-assay | 11.2 | 9.42 | 8.23 | 11.5 | 5.21 | 7.28 | 5.83 | 10.5 |
3.3. Recovery and matrix effect
The recovery of analytes was calculated from the spiked plasma at the LQC, MQC and HQC concentrations are shown in Table 2. The absolute mean recoveries of the E-and Z-isomers of VSW1198 at three QC level (LQC, MQC and HQC) in plasma was found to be 35.3 ± 6.1 and 38.4 ± 7.2 % respectively, while that of E-and Z-isomers of RAM1147 was found to be 62.2 ± 6.5 % and 67.5 ± 3.2 % respectively. The matrix effect for both analytes at LQC, MQC and HQC concentration levels in mouse plasma were < ±15% (104.24 - 90.12 %) (Table 2).
Table 2.
Mean recoveries and matrix effect of the E- and Z-isomers of VSW1198 in mouse plasma (each value represent Mean ± SD, n=3).
| Analyte | Mean recoveries (Mean ± SD) | ||
|---|---|---|---|
| LQC | MQC | HQC | |
| E-Isomer | 32.31 ± 6.20 | 35.45 ± 5.31 | 38.22 ± 7.12 |
| Z-Isomer | 36.91 ± 8.22 | 37.40 ± 7.63 | 40.84 ± 5.85 |
| Mean Matrix effect (Mean ± SD) | |||
| E-Isomer | 102. ± 5.23 | 90.12 ± 7.13 | 91.83 ± 3.45 |
| Z-Isomer | 98.93 ± 9.87 | 101.71 ± 8.23 | 104.24 ± 8.71 |
3.4. Dilution integrity
The dilution integrity was confirmed for samples that exceeded the upper limit of the standard calibration curve. Diluted samples were within ± 15% of the nominal values.
3.5. Stability
The data from the stability experiments are summarized in Table 3, where the mean concentration (expressed as percentage accuracy from nominal concentration) at each level is presented together with SD. In the different stability studies, analytes were found to be within ± 15% of the actual concentration at the LQC and HQC concentrations.
Table 3.
Mean stability recoveries of the E- and Z-isomers of VSW1198 in mouse plasma under different storage conditions (each value represents Mean ± SD, n=3).
| Analyte | % Stability recoveries (Mean ± SD) | |||
|---|---|---|---|---|
|
| ||||
| Freeze-thaw (−80 ± 5 °C after three cycle) | Long-term (−80 ± 5 °C, 30 days) | Auto-sampler (4 °C, 36 hr) | Bench-top (20 °C, 8 hr) | |
| E-Isomer | 107.25 ± 3.10 | 91.29 ± 5.25 | 93.84 ± 4.56 | 90.30 ± 6.60 |
| Z-Isomer | 96.97 ± 7.11 | 107.46 ± 9.20 | 103.78 ± 6.75 | 98.76 ± 9.57 |
3.6. Application of the assay
The newly developed assay was successfully applied to the quantitative analysis of VSW1198 in both plasma and tissue from mice treated with VSW1198. The 24 hour mean plasma and liver concentration following a single i.v. dose of VSW1198 were 9.13 ± 0.98 and 407.8 ± 62.6 for E- isomer, and 5.26 ± 1.91 and 255.6 ± 45.6 ng/mL for Z- isomer, respectively. Both isomers were detected in plasma and liver up to 168 hr after a single i.v. dose of the VSW1198 mixture, indicating sustained exposure to the drug.
4. Conclusion
We have developed a sensitive and reproducible LC-MS/MS method for quantitating the GGDPS inhibitor VSW1198 in plasma and tissue as well as demonstrated the applicability of a general chemical derivatization approach to the analysis of bisphosphonates. The approach was successfully applied to both in vitro and in vivo samples analysis. This LC-MS/MS method provides a valuable tool which will be integral to the ongoing efforts focused on the preclinical development of VSW1198 and related compounds as novel anti-cancer agents.
Supplementary Material
Highlight for review.
A LC-MS/MS for quantitation of VSW1198 in mouse plasma and tissues.
Highly sensitive and stable derivatized compounds were analyzed by LC-MS/MS.
This approach could be applied to other structurally similar bisphosphonates.
Acknowledgments
The work was supported by the National Institutes of Health (R01CA-172070 to SAH), the Roy J. Carver Charitable Trust (01-224 to DFW), the University of Nebraska Medical Center and by the Fred & Pamela Buffett Cancer Center Support Grant from the National Cancer Institute under award number P30 CA036727 (to DJM). The content is solely the responsibility of the authors and does not necessarily represent the official views of the National Institutes of Health. We also acknowledge the helpful discussions with Robert J. Classon at Shimadzu Scientific Instruments, Columbia, MD.
Footnotes
Conflict of interest: There is no conflict of interest to disclose.
Publisher's Disclaimer: This is a PDF file of an unedited manuscript that has been accepted for publication. As a service to our customers we are providing this early version of the manuscript. The manuscript will undergo copyediting, typesetting, and review of the resulting proof before it is published in its final citable form. Please note that during the production process errors may be discovered which could affect the content, and all legal disclaimers that apply to the journal pertain.
References
- 1.Haney S, Wills V, Wiemer D, Holstein S. Recent Advances in the Development of Mammalian Geranylgeranyl Diphosphate Synthase Inhibitors. Molecules. 2017;22(6):886. doi: 10.3390/molecules22060886. [DOI] [PMC free article] [PubMed] [Google Scholar]
- 2.Agabiti SS, Liang Y, Wiemer AJ. Molecular mechanisms linking geranylgeranyl diphosphate synthase to cell survival and proliferation. Molecular Membrane Biology. 2016;33(1-2):1–11. doi: 10.1080/09687688.2016.1213432. [DOI] [PMC free article] [PubMed] [Google Scholar]
- 3.Wills VS, Allen C, Holstein SA, Wiemer DF. Potent Triazole Bisphosphonate Inhibitor of Geranylgeranyl Diphosphate Synthase. ACS Medicinal Chemistry Letters. 2015;6(12):1195–1198. doi: 10.1021/acsmedchemlett.5b00334. [DOI] [PMC free article] [PubMed] [Google Scholar]
- 4.Allen C, Kortagere S, Tong H, Matthiesen RA, Metzger JI, Wiemer DF, Holstein SA. Olefin Isomers of a Triazole Bisphosphonate Synergistically Inhibit Geranylgeranyl Diphosphate Synthase. Molecular Pharmacology. 2017;91(3):229–236. doi: 10.1124/mol.116.107326. [DOI] [PMC free article] [PubMed] [Google Scholar]
- 5.Jia HJ, Li W, Zhao K. Determination of risedronate in rat plasma samples by ion-pair high-performance liquid chromatography with UV detector. Analytica Chimica Acta. 2006;562(2):171–175. [Google Scholar]
- 6.Veniamin NL, Patrick SM, Curtis ES, Ridha N, Chris JK. Quantitative analysis of bisphosphonates in biological samples. Bioanalysis. 2014;6(21):2931–2950. doi: 10.4155/bio.14.223. [DOI] [PubMed] [Google Scholar]
- 7.Ghassabian S, Wright LA, deJager AD, Smith MT. Development and validation of a sensitive solid-phase-extraction (SPE) method using high-performance liquid chromatography/tandem mass spectrometry (LC–MS/MS) for determination of risedronate concentrations in human plasma. Journal of Chromatography B. 2012;881(Supplement C):34–41. doi: 10.1016/j.jchromb.2011.11.031. [DOI] [PubMed] [Google Scholar]
- 8.Zhu LS, Lapko VN, Lee JW, Basir YJ, Kafonek C, Olsen R, Briscoe C. A general approach for the quantitative analysis of bisphosphonates in human serum and urine by high-performance liquid chromatography/tandem mass spectrometry. Rapid Communications in Mass Spectrometry. 2006;20(22):3421–3426. doi: 10.1002/rcm.2755. [DOI] [PubMed] [Google Scholar]
- 9.Anthony TP, Curtis S, Daryl G, Corey MO. Assay development for determination of tenofovir in human plasma by solid phase analytical derivatization and LC–MS/MS. Bioanalysis. 2015;7(24):3085–3095. doi: 10.4155/bio.15.220. [DOI] [PubMed] [Google Scholar]
- 10.Pan D, Yan Z, Xiaoyan C, Dafang Z. Derivatization methods for quantitative bioanalysis by LC– MS/MS. Bioanalysis. 2012;4(1):49–69. doi: 10.4155/bio.11.298. [DOI] [PubMed] [Google Scholar]
- 11.Wong ASY, Ho ENM, Wan TSM, Lam KKH, Stewart BD. Liquid chromatography–massspectrometry analysis of five bisphosphonates in equine urine and plasma. Journal of Chromatography. 2015;B998(Supplement C):1–7. doi: 10.1016/j.jchromb.2015.06.020. [DOI] [PubMed] [Google Scholar]
- 12.McKenna CE, Higa MT, Cheung NH, McKenna MC. The facile dealkylation of phosphonic acid dialkyl esters by bromotrimethylsilane. Tetrahedron Letters. 1977;18(2):155–158. [Google Scholar]
- 13.Bioanalytical Method Validation. U.S. Department of Health and Human Services Food and Drug Administration; 2013. Draft Guidance for Industry. [Google Scholar]
- 14.Yang Y, Liu C, Zhang Y, Zhou L, Zhong D, Chen X. On-cartridge derivatization coupled with solid-phase extraction for the ultra-sensitive determination of minodronic acid in human plasma by LC–MS/MS method. Journal of Pharmaceutical and Biomedical Analysis. 2015;114(Supplement C):408–415. doi: 10.1016/j.jpba.2015.05.038. [DOI] [PubMed] [Google Scholar]
Associated Data
This section collects any data citations, data availability statements, or supplementary materials included in this article.