Summary
Imaging human brain function with techniques such as magnetoencephalography1 (MEG) typically requires a subject to perform tasks whilst their head remains still within a restrictive scanner. This artificial environment makes the technique inaccessible to many people, and limits the experimental questions that can be addressed. For example, it has been difficult to apply neuroimaging to investigation of the neural substrates of cognitive development in babies and children, or in adult studies that require unconstrained head movement (e.g. spatial navigation). Here, we develop a new type of MEG system that can be worn like a helmet, allowing free and natural movement during scanning. This is possible due to the integration of new quantum sensors2,3 that do not rely on superconducting technology, with a novel system for nulling background magnetic fields. We demonstrate human electrophysiological measurement at millisecond resolution whilst subjects make natural movements, including head nodding, stretching, drinking and playing a ball game. Results compare well to the current state-of-the-art, even when subjects make large head movements. The system opens up new possibilities for scanning any subject or patient group, with myriad applications such as characterisation of the neurodevelopmental connectome, imaging subjects moving naturally in a virtual environment, and understanding the pathophysiology of movement disorders.
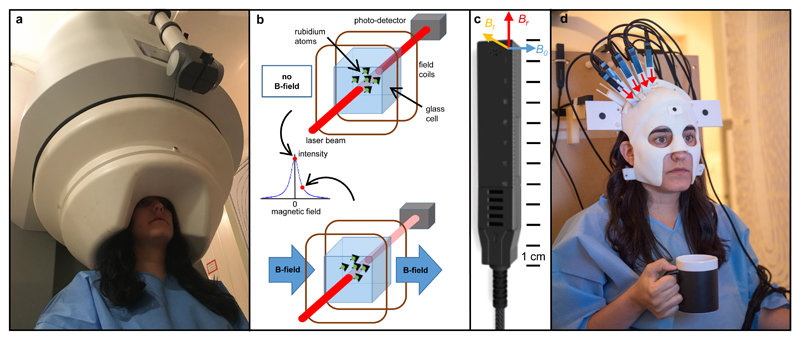
Magnetoencephalography1 (MEG) allows direct imaging of human brain electrophysiology, via measurement of magnetic fields generated at the scalp by neural currents. Mathematical analysis of those fields enables the generation of 3D images showing the formation and dissolution of brain networks in real time. MEG measurements of brain activity are currently made using an array of superconducting sensors placed around the head1,4. These cryogenically-cooled sensors have femtotesla (fT) sensitivity, which is needed to detect the weak magnetic fields produced by the brain. Unfortunately, the requirement for cooling means that sensors must be housed within a liquid helium dewar with a vacuum space separating sensors from the scalp. MEG systems are therefore cumbersome (Figure 1a) and sensor positions are fixed in a one-size-fits-all helmet. Any motion of the head relative to the sensors reduces data quality dramatically: even a 5 mm movement can be prohibitive5. Further, the brain-to-sensor distance, which is significant in adults (~3 cm), is increased markedly in subjects with small heads, reducing the available signal because the magnetic field decreases with the square of the source-sensor distance. These characteristics make participation in MEG studies challenging for many subject groups, including infants and many patients. They also make the MEG scanner environment unnatural, and limit the experimental paradigms that can be employed. Here, we describe a transformative MEG technology which can be worn on the head during movement. This opens up the possibility for non-invasive mapping of human electrophysiology across all ages and patient groups, with subjects who are free to move and interact with the real world.
Figure 1. A new generation of MEG system.
a) A conventional 275-channel cryogenic MEG system. Weighing ~450 kg the system is fixed and cumbersome and subjects must remain still relative to the fixed sensor array. b) Schematic illustration of zero-field resonance in an OPM sensor: the upper illustration shows operation in zero-field, the lower illustration depicts Larmor precession when an external field impinges on the cell and the transmitted light intensity is reduced. c) A commercial OPM sensor made by QuSpin. The geometry used is illustrated by the coloured axes where Br is the radial field component, Bt the tangential field component, and BO the direction along which the laser beam is orientated. d) Our prototype OPM-MEG system helmet. The helmet weighs 905 g and is customised such that the sensors (which in this prototype only cover right sensorimotor cortex) are directly adjacent to the scalp surface. The subject is free to move their head. The measured radial field direction for the sensors is illustrated by the red arrows.
At the core of our system is an array of optically pumped magnetometers (OPMs) – magnetic field sensors that rely on the atomic properties of alkali metals. These sensors have seen marked development in recent years2,3,6–9 and are well suited to MEG measurements10–16. In our system, each sensor contains a 3 x 3 x 3 mm3 glass cell containing 87Rb vapour which is heated to ~150°C. A 795 nm circularly polarised laser beam, tuned to the D1 transition of rubidium, is used to spin-polarise the atoms, and the intensity of laser light transmitted through the cell is detected using a photodiode. In zero magnetic field, the spin magnetic moments align with the beam, and transmission of laser light to the photo diode is maximised. However, a magnetic field perpendicular to the beam causes Larmor precession, rotating the magnetic moments away from alignment. This causes a measurable drop in light transmission. The resulting effect is a zero-field resonance (Figure 1b), which acts as a sensitive magnetic field indicator.
Each sensor is an integrated unit (Figure 1c) with a noise level comparable to that of a SQUID (~15 fT/√Hz) and a dynamic range of ±1.5 nT. Although the cell is heated, sensors can be mounted on the scalp because their external surfaces remain close to body temperature. Our prototype system (Figure 1d) comprised an array of sensors which were mounted in a 3D-printed ‘scanner-cast’. The scanner-cast12 was designed using an anatomical MRI scan, such that the internal surface snugly fits the subject’s head, whilst the external surface accommodates the OPMs, which were positioned over the right sensorimotor cortex. Four additional reference sensors, sited near the subject’s head, were used for background interference measurement.
As a first demonstration, we measured electrophysiological activity in the right sensorimotor cortex during visually-cued abduction of the left index finger. This task robustly elicits a reduction of endogenous beta band (13-30 Hz) oscillations during movement and a rebound (increase above baseline) following movement cessation17. Although simple, this task has been applied widely, with beta modulation being used as a marker of brain plasticity18,19, psychosis20,21 and white matter degradation22. A single experiment comprised 50 trials, each involving 1 s of finger abduction and 3 s rest. 50 ‘dummy’ trials (where the subject did nothing) were interleaved to allow an estimate of baseline activity. A subject undertook the experiment 12 times: 6 where they kept as still as possible, and 6 where they made natural head movements, including nodding and shaking, stretching and drinking. Head motion was measured using an Xbox Kinect camera, which tracked movement of three fiducial markers on the head. We also undertook the same experiments using a cryogenic MEG system.
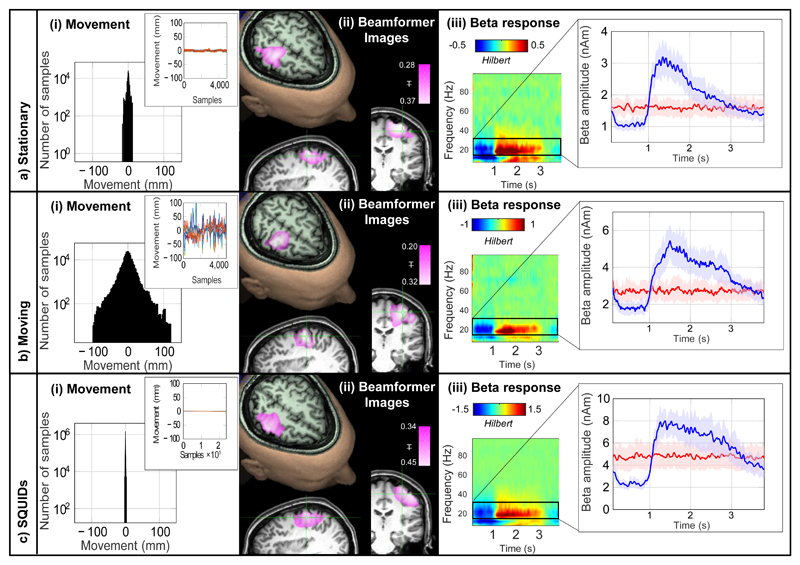
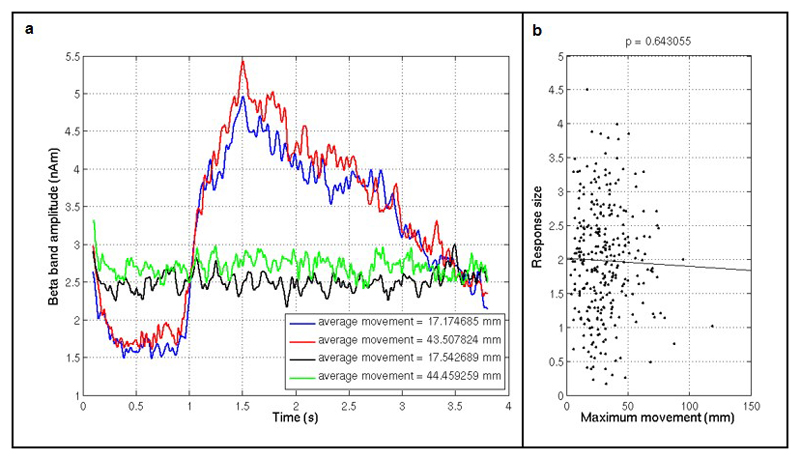
Figure 2 shows OPM-MEG data measured when the subject kept still (Figure 2a) and moved (Figure 2b). Subject motion is shown in panel (i). In the static case, motion was less than ±1 cm whereas in the moving case it exceeded ±10 cm. Panel (ii) shows an image23,24 of beta modulation (pink overlay) whilst panel (iii) shows a time-frequency spectrogram (TFS) of oscillatory change. In the TFS, blue indicates a loss in oscillatory amplitude relative to baseline whereas red indicates an increase. Line-plots of beta amplitude are shown inset. Equivalent data from the cryogenic system are shown in (c), where movement was (necessarily) constrained to <2 mm. OPM-MEG performed consistently across experiments with the characteristic beta decrease and post movement rebound delineated clearly, and localised to sensorimotor cortex. Despite an order of magnitude increase in head movement, there was no significant difference in signal-to-interference ratio (SIR) between the moving and static runs (p = 0.39; two-sided Wilcoxon sum-rank test) and no correlation between the degree of movement and response size (see Extended Data Figure 1 and Supplementary Information (SI) section 1). The spatial resolution of the OPM system was better than that of the cryogenic system, even with only 13 sensors (see Extended Data Figure 2 and SI section 2). These data, along with a similar analysis of evoked responses (see Extended Data Figure 3 and SI section 3), show clearly that the wearable system can be used to collect high fidelity data even in the presence of large head movements.
Figure 2. OPM-MEG results.
a) Shows the case when the subject was asked to remain still, b) shows the case when the subject was moving. c) Shows the case for data collected using a cryogenic MEG instrument for comparison. In (a), (b) and (c): i) A histogram showing movement of 3 fiducial markers on the subject’s head. The inset graph shows the change in marker positions over a typical experiment; different colours show movement in 3 Cartesian axes of the three markers. ii) The change in beta band power due to finger abduction (purple) overlaid onto on axial, sagittal and coronal slices of the anatomical MRI – the functionally active region overlays contra-lateral sensorimotor cortex. iii) A time-frequency spectrogram depicting changes in neural oscillations during finger abduction. The inset graph shows the characteristic beta band response for finger abduction (blue) and rest trials (red). In all cases the results are averaged over trials and experiments and the shaded region shows standard error over 6 experiments. SIR ranged from 4.3 to 8.2 for static OPM measures, 4.2 to 5.8 for moving OPMs, and 4.9-7.9 for the cryogenic system. Further analysis (see extended data Figure 2 and SI section 2) showed that the OPM system significantly outperformed the cryogenic system in terms of both spatial resolution, and robustness across experiments. Temporal resolution was quantified at 130 Hz.
Critical to the wearable MEG system is a means to null the background static magnetic field impinging on the OPMs. The system is housed inside a magnetically shielded room (MSR). However, the remnant earth’s field in the MSR is ~25 nT, and spatially inhomogeneous. Any sensor movement through this field during a MEG recording would result in a field change much larger than the fields of interest, and would exceed the OPM’s narrow (±1.5 nT) operational range, rendering them inoperable. In addition, such changes can modulate the sensor gain (see Extended Data Figure 4 and SI section 4). To ameliorate this problem, we constructed a set of bi-planar electromagnetic coils designed to generate fields equal and opposite to the remnant earth’s field, thereby cancelling it out.
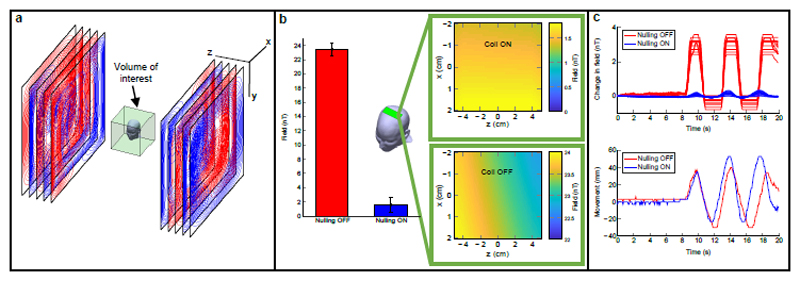
The coils were designed25,26 on two 1.6 x 1.6 m2 planes, placed either side of the subject with a 1.5 m separation (Figure 3a). Three coils generated spatially uniform fields (Bx, By and Bz) whilst two additional coils were used to remove the dominant field variations (). In this way, unlike standard field-nulling technologies (e.g. tri-axial Helmholtz coils), our system is able to account for spatial variation of the field over a 40 x 40 x 40 cm3 volume of interest enclosing the head. Further, we were able to cancel all components of the field vector using coils confined to just two planes, hence retaining easy access to the subject. Four reference OPM sensors were coupled to the coils in a feedback loop to null the residual static field in the volume of interest. We achieved a 50-fold reduction in the remnant earth’s field, and a 35-fold reduction in the dominant field gradient (Figure 3b). Figure 3c shows OPM measurements made during 7 cm head movements, with (blue) and without (red) field-nulling. The results show that without field-nulling the OPM sensors fail (evidenced by the saturation). With field nulling, however, the OPMs are able to capture MEG data even with the head moving (see also SI section 5).
Figure 3. Bi-planar fingerprint-coil system for removing remnant static magnetic fields.
a) Schematic of the coils, which are confined to two planes surrounding a 40 x 40 x 40 cm3 region of interest in which the head is allowed to move. The 5 separate layers represent wire paths that generate fields Bx, By, Bz, b) Bar chart showing field magnitude with and without the field-nulling. Inset images show spatial field variation of Bx. The static field was reduced from 22±1 nT to 440±150 pT. measured across a 10 cm region spanning the width of the head (see the green box in b) was reduced from 10 nT/m to 0.28 nT/m. c) The upper plot shows the output of one OPM over time whilst the subject nods their head (head movement shown in lower plot). Blue and red traces show the cases where the field-nulling system was on and off, respectively. Note that without field nulling the OPMs saturate during head-movement whereas with nulling the sensors continue to work, leaving an artifact which is comparable in magnitude to that due to an eye-blink.
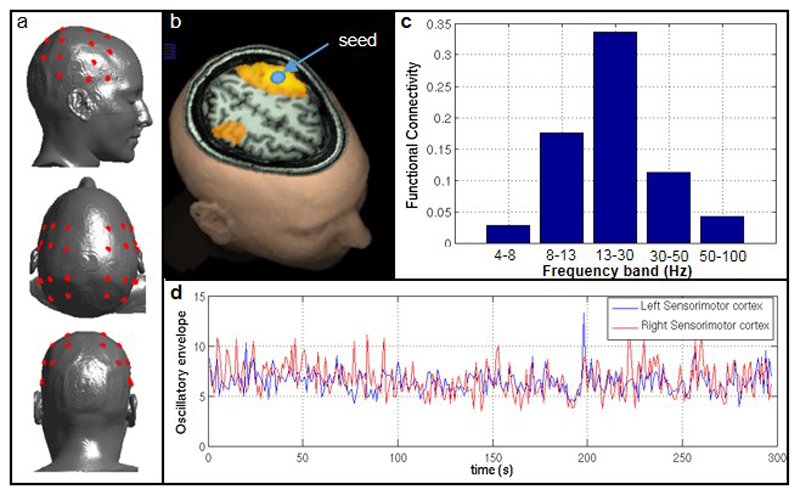
The ability to map human electrophysiology non-invasively, with whole brain coverage and high spatiotemporal resolution is unique to MEG27. Competitor techniques either lack spatial specificity (e.g. EEG – which is also more susceptible to muscle artifact, see Extended Data Figure 5 and SI Section 6) or only provide indirect access to brain function via metabolic processes (e.g. fMRI). However, current MEG systems exclude many subject cohorts and experimental paradigms. Our system represents a step change for functional imaging. A wearable instrument with scalp-mounted sensors means that subjects can be scanned across the lifespan, from babies to elderly patients, allowing imaging during key stages of cognitive development and decline. For example, it is well known that efficient communication between spatially separate cortical regions is key to healthy brain function, and that neural oscillations help mediate such connectivity28,29. However, little is known about how electrophysiological brain networks emerge in the early years of life. Our system can characterise those networks, and the spectro-temporal profile of the connectivities that underlie them (see Extended Data Figure 6 and SI section 7). This highlights the potential utility of OPM-MEG for characterising the developmental connectome. Our wearable system also opens doors to myriad neuroscientific investigations in which subjects can move naturally and interact with the real world. An example is given in Figure 4 which shows brain activity elicited when the subject played a ball game (Figure 4a). This naturalistic paradigm requires free, rapid and unpredictable head and arm movement; nevertheless we were able to localise changes in beta oscillations to the arm/wrist area of motor cortex (Figure 4b) and track the dynamics of oscillatory modulation (Figure 4c). This shows the unique potential of wearable MEG to assess visuomotor coordination, adding a new dimension to previous work30. In sum, this new technology has transformative potential across a range of neuroscientific and clinical applications, where knowledge of brain electrophysiology is informative.
Figure 4. An example ‘real world’ imaging paradigm.
a) Experimental setup: the seated subject continually bounced a table tennis ball off a bat for 10 s; this was followed by a 10 s baseline period, in which they did nothing. This was repeated 29 times. b) Spatial signature of beta band oscillatory change during periods of playing the ball game compared to rest. Note the difference in localisation compared to Fig. 2, with the beta modulation localised to the arm/wrist area of sensorimotor cortex (distinct from the hand area in Fig. 2). c) Trial averaged time-frequency spectrogram and (inset) amplitude of beta oscillations averaged over time. The maximum head movement during this paradigm, assessed by the Kinect camera, was 6cm. This simple example demonstrates the power of wearable neuroimaging to accurately assess brain function during a real world visuo-motor coordination task. This example could readily be extended to examine e.g. the neural correlates of motor coordination, their maturation during neurodevelopment and their breakdown in movement disorders. Such studies using naturalistic stimuli are inaccessible to conventional neuroimaging scanners due to the movement required to undertake the task. To show robustness of this measure, similar data were captured in 2 further subjects. Task induced beta modulation, relative to baseline, was measured at 61% 80% and 70% in the three participants.
Materials and Methods
1. OPM-MEG System Design and Fabrication
1.1. System overview
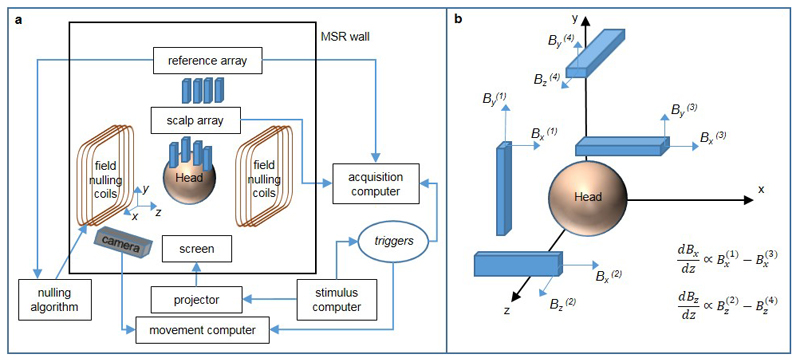
An overview of our OPM-MEG system is shown in Extended Data Figure 7a. The system comprised 13 OPM sensors (QuSpin, Louisville, CO), which were mounted on the scalp surface (the scalp array), and a further 4 sensors (placed close to the head, but not on the scalp surface) which were used to make reference measurements (the reference array). Each sensor produces an analogue voltage output which is proportional to the magnetic field perpendicular to the laser beam (scaling = 2.7 V/nT). The sensor outputs were digitised at a sample rate of 1000 Hz, using a 16-bit digital acquisition (DAQ) system (National Instruments, Austin, TX) controlled using custom-written software in LabVIEW. The sensor arrays were housed inside a magnetically shielded room (MSR) to reduce environmental magnetic interference; all control equipment was kept outside the room to minimise its effect on MEG measurements.
Prior to data acquisition, the reference array was used to identify the currents in the coils which best nulled the residual static magnetic field inside the MSR and its dominant first order spatial variation. Reference sensors were located and oriented such that the three Cartesian components of the magnetic field (Bx, By and Bz), and the two dominant field gradients () could be measured close to the head (see Extended Data Figure 7b). Reference array measurements were input to a proportional integral derivative (PID) algorithm, which was used to control the currents in the field-nulling coils. This allows the calculation of currents which generate fields that are equal and opposite to those measured by the reference array, thus attenuating the static field over the volume spanning the subject’s head. This step is key if the head is free to move during MEG data acquisition, since without field-nulling, even small changes in head position or orientation (e.g. a 4° rotation in a 25 nT field) would produce field variations large enough to render the OPMs inoperable (see Figure 3c).
During data acquisition, all 17 sensors (13 sensor scalp array and 4 sensor reference array) were operated simultaneously, with the reference sensors (which are sufficiently far from the scalp to be insensitive to the neuromagnetic field) used to characterise temporally varying background magnetic interference, which was later regressed from the signals recorded by the scalp-mounted sensors.
The visual cue for paradigm control was controlled by a separate stimulus computer. This was coupled to a data projector which projected the cue image through a waveguide onto a back-projection screen positioned ~40 cm in front of the subject. The stimulus computer also generated TTL trigger pulses of 1 s duration denoting the onset of the visual cues and the start of the rest periods. These trigger signals were input to the DAQ and sampled, simultaneously with the OPM data, at 1000 Hz. Throughout data acquisition, an Xbox Kinect camera (Microsoft, Redmond, WA) was used to measure head movement. Video data were captured using a third computer, which also recorded the trigger channels so that movement data could be later analysed on a trial-by-trial basis.
1.2. OPM sensors
The fundamental building block of our system is the OPM sensor. We employed compact commercially available sensors (see Figure 1c)3,11, allowing a large number to be located flexibly on the scalp surface. Each OPM sensor head contains a semiconductor laser for optical pumping, optics for laser beam conditioning, a 3 x 3 x 3 mm3 87Rb vapour cell and a silicon photodiode for beam detection. The sensor head connects to a small electronics controller via a 5 m cable which is passed through a waveguide in the MSR. The sensor includes three on-board coils which can be used to null static field components in the cell. Field changes (e.g. due to neural currents in the brain) can be detected via the change in transmitted light intensity which they produce (Figure 1b). The transmitted intensity shows a zero-field resonance, which is a Lorentzian function of the magnetic field components transverse to the laser beam, with a full width at half maximum of around 30 nT. For continuous field measurements, a sinusoidally-modulated magnetic field of 1 kHz frequency is applied perpendicular to the laser beam using the on-sensor coils. The depth of modulation of the transmitted light, which is monitored using a lock-in process, is sensitive to the magnitude of the field component along the modulation axis8,31. The amplitude of the two field components perpendicular to the beam can be measured simultaneously by applying oscillating currents to two coils in quadrature. However, here only the radial field component was measured.
1.3. Scanner-cast design and 3D printing
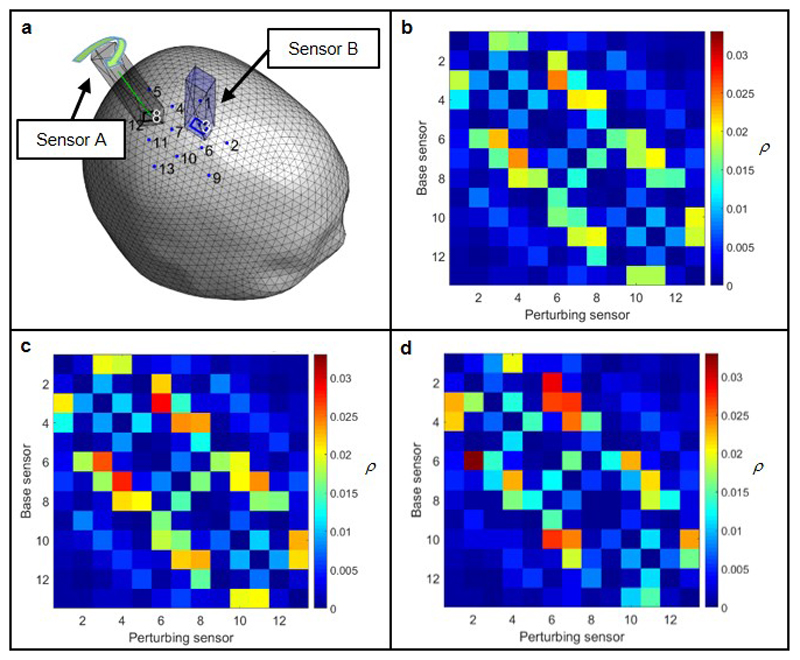
Pre-recorded MRI and (cryogenic) MEG data were used to inform the design and construction of the individualised scanner-cast. To ascertain the shape of the subject’s head, an anatomical MRI scan was acquired using a Philips (Best, NL) 3T Ingenia MR system running a T1-weighted gradient echo imaging sequence, with an isotropic resolution of 1 mm and a high bandwidth to limit field-inhomogeneity-related distortion. A 3D mesh, representing the outer surface of the head and face was extracted from this image and then used to define a custom-fitted helmet, in which the OPM sensors could be mounted12. In a complete system, a large number of sensors would be spaced equidistantly across the entire scalp surface, giving whole brain coverage, but in our prototype system (used for the finger abduction and ball game paradigms), only 13 sensors were available and these had to be positioned for optimal coverage of the sensorimotor region. To determine the optimal OPM sensor positions, we carried out the visually-cued finger abduction experiment on the same subject using a cryogenic MEG system, and localised the source position and orientation using a beamformer. Having computed the location and orientation of the dipolar source, we used a forward model to compute the radial magnetic fields at the scalp surface generated by this dipole. The positions of the scalp-array sensors were then chosen to sample these fields optimally12. We assessed the effect of crosstalk between sensors, which may occur due to constructive interference of fields from adjacent sensors. For the sensor array used here we found these effects to be less than 3% when taking into account the radial field (see Extended Data Figure 8 and SI section 8). See SI Section 7 for details of the scanner-cast that accommodated the 26 sensors which were used in a functional connectivity demonstration (see also Extended Data Figure 6).
1.4. Field Nulling Coils
The remnant earth’s field at the centre of our MSR is ~25 nT, and also shows significant spatial variation, with a gradient of ~10 nTm-1. This means that translation through the inhomogeneous remnant field, or rotation with respect to the field vector, produces field changes at the sensors that are much larger than the neuromagnetic fields of interest (as shown in Figure 3). Given the size of the remnant field and the narrow operational range of the OPMs (±1.5nT), such movement is likely to take the sensors outside their operational range. For example, a rotation of less than 4° in a field of 25 nT can produce a change of more than 1.5 nT in the amplitude of the magnetic field along an OPM sensor’s sensitive axis, thus rendering it inoperable. The use of the field nulling coils to reduce the remnant static (earth’s) field over a large central volume inside the MSR is therefore critical if the sensor array is to be operated without being rigidly fixed in position with respect to the MSR.
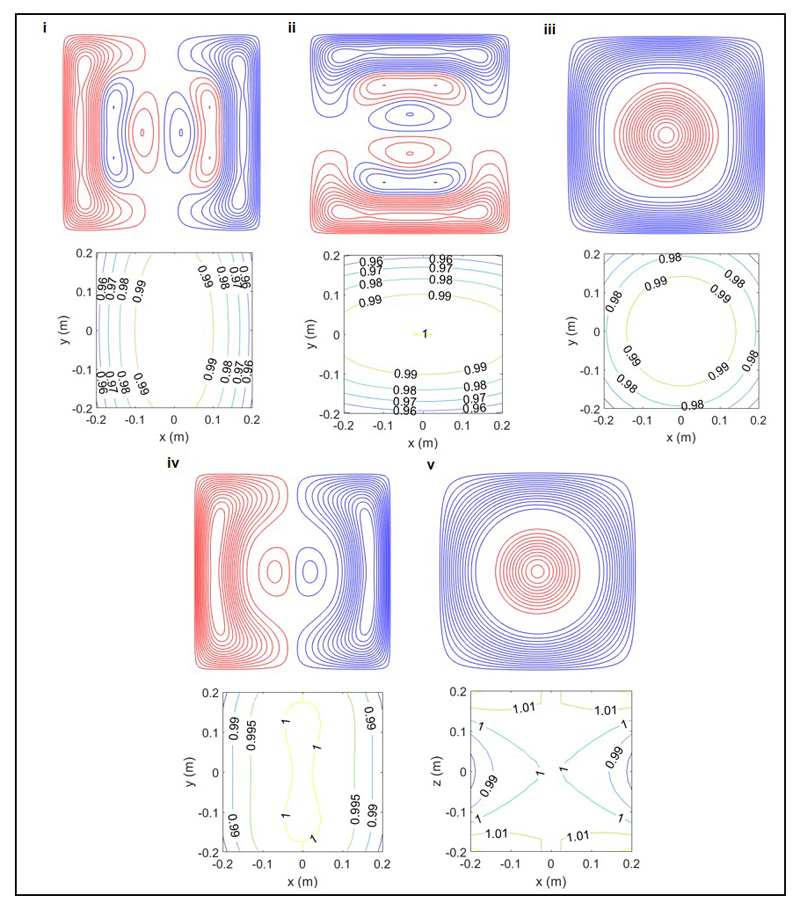
Here, the remnant field was nulled using a set of coils positioned on either side of the subject (see Figure 3a). Five different bi-planar coils were constructed independently to null Bx, By and Bz and the two dominant field gradients, dBx/dz and dBz/dz. In contrast to the tri-axial Helmholtz coil arrangement that is commonly used to null the remnant field inside an MSR, the bi-planar coil array allows cancellation of spatially varying fields and also does not significantly limit access to the subject, since the coil windings are confined to two vertical planes (rather than the three pairs of orthogonal planes that would enclose the subject when using three orthogonal Helmholtz coils). The bi-planar coil system therefore offers significant advantages by eliminating the spatially uniform remnant field and its first order spatial variation, whilst maintaining access to the subject.
Magnetic fields from bi-planar coils32 were optimised for homogeneity using a harmonic minimisation approach26. The current distribution J was confined to the two planes at z = ±a in the region |x|, |y| < L, and defined using the stream function, S as J = ∇S×ẑ. S is parameterised as a two-dimensional Fourier series so that
| [1] |
Optimal values of the Fourier coefficients (αn, βn, γm, δm) were identified by exploiting the symmetry of the field distribution and then minimising:
| [2] |
where rt characterise locations within the volume of interest at which a homogenous field or field gradient (described by Btarget) is required, and P represents the power dissipated in the coil. The coefficient, ω can be used to adjust the weighting of the power term. Increasing ω reduces the complexity of the wire paths to be fabricated. B(rt) was calculated using the relationship
| [3] |
where B̃ and S̃ are the two-dimensional Fourier transforms of the field and stream function with respect to x (kx) and y (ky), and The upper/lower sinh/cosh terms correspond to the case of the stream function having the same/opposite sign on the two planes. Coils were designed to produce a homogeneous (within ±5 %) field or field gradient over a 0.4 x 0.4 x 0.4 m3 central region, which is large enough to span the range of sensor positions during experiments in which head movement is allowed. The wire paths for each coil span an area of 1.6 x 1.6 m2 and are layered on two planes of medium-density fibreboard separated by 1.5 m. The coil wire paths and contours of the magnetic field or field gradient in a central plane between the two coils are shown in Extended Data Figure 9 for each coil. The field variation was calculated by applying the elemental Biot-Savart law to the digitised wirepaths (see SI section 5 for further discussion).
1.5. Motion detection and quantification
To quantify head movement, we used a simple optical tracking system based upon a Microsoft Kinect V1-2010 camera which was placed ~1 m in front of the subject. This camera provides a simultaneous 8-bit RGB video stream (640 x 480 pixel display, with 57° horizontal and 43° vertical field of view) and an 11-bit depth image, reconstructed from an infra-red projected field. Data from both streams were captured using the MATLAB image acquisition toolbox, at 12 frames per second.
A motion-tracking algorithm was used to track the positions of three black dots on the outer surface of the white scanner-cast. The algorithm was initiated via manual selection of the three dots in the first frame of the video. A threshold detect routine then identified the dots and their centre of mass in all subsequent frames. Pixel numbers were converted to absolute locations in three dimensions by integrating the video data with the depth field. In this way, we defined parameters describing the motion of the three markers throughout the experiment. To quantify motion, movement parameters for all three orientations and all three fiducial locations were concatenated. Figure 2 (panel i) shows these data as a histogram plotted on a logarithmic scale.
2. Experimental Method
2.1. Finger abduction paradigm
Experiments were carried out on a single subject (female, right-handed, age 27), who provided written informed consent (both to participation in the experiments and to release of photographs). The study was approved by the University of Nottingham Medical School ethics committee. The subject undertook multiple repeats of a visuo-motor task20. The paradigm comprised visual stimulation with a centrally-presented, maximum-contrast, vertical square-wave grating (3 cycles per degree). The grating subtended a visual angle of 8° and was displayed along with a fixation cross on a grey background. In a single trial, the grating was presented for 1 s followed by a 3 s baseline period during which only the fixation cross was shown. During presentation, the participant was instructed to make repeated abductions of their left (non-dominant) index finger. 50 of these trials were recorded in each experiment. Blocks of ten trials were interspersed with blocks of ten ‘rest’ trials. In these rest trials (also 4 s in duration) the fixation cross remained on the screen, but no finger abduction was made. Averaging across the 50 ‘real’ and 50 ‘rest’ trials independently allowed assessment of SIR (see below). This experiment was repeated six times with the subject stationary and six times with the subject making natural movements. It was also repeated six times using a cryogenic MEG system.
2.2. The ‘ball game’ paradigm
The subject was seated in the OPM-MEG system and asked to play a simple ball game in which they continually bounced a table tennis ball on a bat. 10 s bursts of ‘ping-pong’ were interspersed with 10 s of baseline activity (during which the subject was told to simply hold the bat and ball on their knee). This gave a total trial length of 20 s, and the subject repeated this 29 times. Due to the location of the OPM sensors in the scanner cast, the experiment was undertaken with the subject’s non-dominant hand. Trials were cued by a second experimenter who was positioned inside the MSR throughout the experiment and gave verbal instructions to cue the game (they shouted either ‘ping-pong’ or ‘rest’ to begin or stop the game). This experiment was undertaken once in the OPM-MEG system by three subjects.
2.3. Cryogenic MEG system data acquisition
To compare OPM-MEG to cryogenic-MEG recordings, we undertook the finger abduction experiment, in the same subject, using a 275-channel CTF MEG system (MISL, Coquitlam, Canada) operating in third-order synthetic gradiometer configuration33. Data were acquired at a sampling frequency of 600 Hz and the subject was seated. Three electromagnetic position indicator coils were placed on the head as fiducial markers (at the nasion, left preauricular and right preauricular points). The locations of these fiducials were tracked continuously during the recording by sequentially energising each coil and performing a magnetic dipole fit to these data. This allowed both continuous assessment of head movement throughout the measurement, and knowledge of the location of the head relative to the MEG sensors. Prior to the MEG recording, a 3-dimensional digitisation of the subject’s head-shape, relative to the fiducial markers, was acquired using a 3D digitiser (Polhemus Inc., Vermont). Co-registration of the MEG sensor geometry to the anatomical MR image was achieved by fitting the digitised head surface to the equivalent head surface extracted from the anatomical image. The subject undertook the experiment six times and a different head digitisation was acquired each time.
2.4. Data processing: interference rejection
Following data collection, OPM-MEG data were processed in order to remove magnetic interference. The reference array sensors were located close enough to the scalp array to capture similar environmental interference, but sufficiently far away to be insensitive to the neuromagnetic fields of interest. This meant that the scalp and reference arrays could be used to synthesise a ‘gradiometer’ measurement whereby the scalp array data are de-noised via regression of the reference array signals12. The reference array data from all four channels were combined in a single (design) matrix and a regression was used to remove any linear combination of reference array (interference) signals from the scalp array (neuromagnetic) signals. We applied this correction to the raw (i.e. unfiltered) data.
2.5. Data processing: beamforming
Following interference rejection, all MEG data (OPM and cryogenic) were processed in the same way. Data were initially inspected visually, and any trials with excessive interference were discarded. This resulted in the loss of only 1 trial (from a cryogenic recording). A beamformer adaptive spatial filtering approach was then employed.
Using a beamformer24,34, an estimate of electrical source strength Q̂θ(t), made at time t and a predetermined location in the brain is given by a weighted sum of sensor measurements such that
| [4] |
Here m(t) is a vector of magnetic field measurements made at time t across all sensors (i.e. 13 in our OPM system or 275 in the cryogenic system) and Wθ is a vector of weighting parameters tuned to a predefined location in source-space and current dipole orientation, represented by the vector θ. The superscript T indicates a matrix transpose.
The weighting parameters are derived based on power minimisation. The overall power in the output signal Q̂θ(t) is minimised with the linear constraint that power originating from the location/orientation of interest (θ) should remain. Mathematically the beamformer problem can be written as:
| [5] |
where represents the source power, given by C represents the channel level data covariance matrix calculated over a time-frequency window of interest, and Lθ is the lead field vector, which is a vector containing a model of the magnetic fields that would be measured at each of the sensors in response to a source of unit amplitude with location and orientation θ. The (regularised) solution to Eq. 5 is found analytically to be:
| [6] |
∑ is a diagonal matrix representing the white noise at each of the MEG channels (which we approximate as the identity matrix) and μ is a regularisation parameter35. Note that, in addition to source localisation, the power minimisation term has the desirable effect of reducing artifact from e.g. muscles (see Extended Data Figure 10 and SI section 9).
We sought to examine beta band effects, and so the beamformer weights were constructed, using Eq. 6, with covariance matrix C computed using beta band (13-30 Hz) data over a time window spanning the entire experiment23 (400s). In all cases (OPM and cryogenic MEG data) the regularisation parameter was optimised to give the best SIR (defined as the standard deviation of the finger abduction trials divided by the standard deviation of the rest trials). The lead field was calculated using the analytical formulation first described by Sarvas36. Two other covariance matrices were constructed: Ca was defined as the data covariance in an ‘active’ window. This spanned the 0 s < t < 1 s window (relative to trial onset) in the case of the finger abduction paradigm, and the 1 s < t < 9 s window (relative to trial onset) in the ball game paradigm. Cc represented data covariance in a ‘control’ window (1 s < t < 2 s for the finger abduction and 11 s < t < 19 s for the ball game). We then defined a pseudo-T-statistical contrast as
| [7] |
Pseudo-T-statistics were computed at the vertices of a regular 4 mm grid spanning the entire brain. For each voxel, the orientation of each source was based on a non-linear search for the orientation that gave the maximum signal to noise ratio34. This method allowed construction of 3D images showing the spatial signature of maximum change in beta power. These images, averaged across experiments, are shown in Figure 2 (panel ii) and in Figure 4b.
Finally, to investigate the spectro-temporal signature of electrophysiological activity at the location of peak change, a time-frequency spectrogram (TFS) was derived. Here, the peak location/orientation, θpeak, was extracted from the beamformer images, and a time course of electrophysiological activity for that location derived using Eq. 4 (the data covariance for the weights calculation was expanded to a broad (1-150 Hz) frequency range and covered the full 400s of data collection). The resulting data were frequency filtered into 31 overlapping frequency bands, and a Hilbert transform was used to generate the amplitude envelope of oscillations within each band. These envelope time courses were then averaged across trials, and experiments, and concatenated in the frequency dimension to generate a single TFS (shown in Figure 2, panel iii, and in Figure 4c). The same method was used (with beta band filtered covariance for weights calculation) to examine beta band fluctuations.
Extended Data
Extended Data Figure 1. Response magnitude as a function of subject movement.
a) Beta envelopes for finger abduction trials (blue/red) and resting trials (black/green) in the presence of large movement (red/green) and small movements (blue/black). b) The response size (i.e. the difference between the mean amplitude during the desynchronization and rebound periods) shown as a function of maximum movement during a trial. Note that no measurable relationship was found. A significant (p<0.05) baseline shift was observed in both the finger-abduction and rest trials; this is likely to be a consequence of artifacts in the data generated by electrical activity in muscles controlling the naturalistic movements.
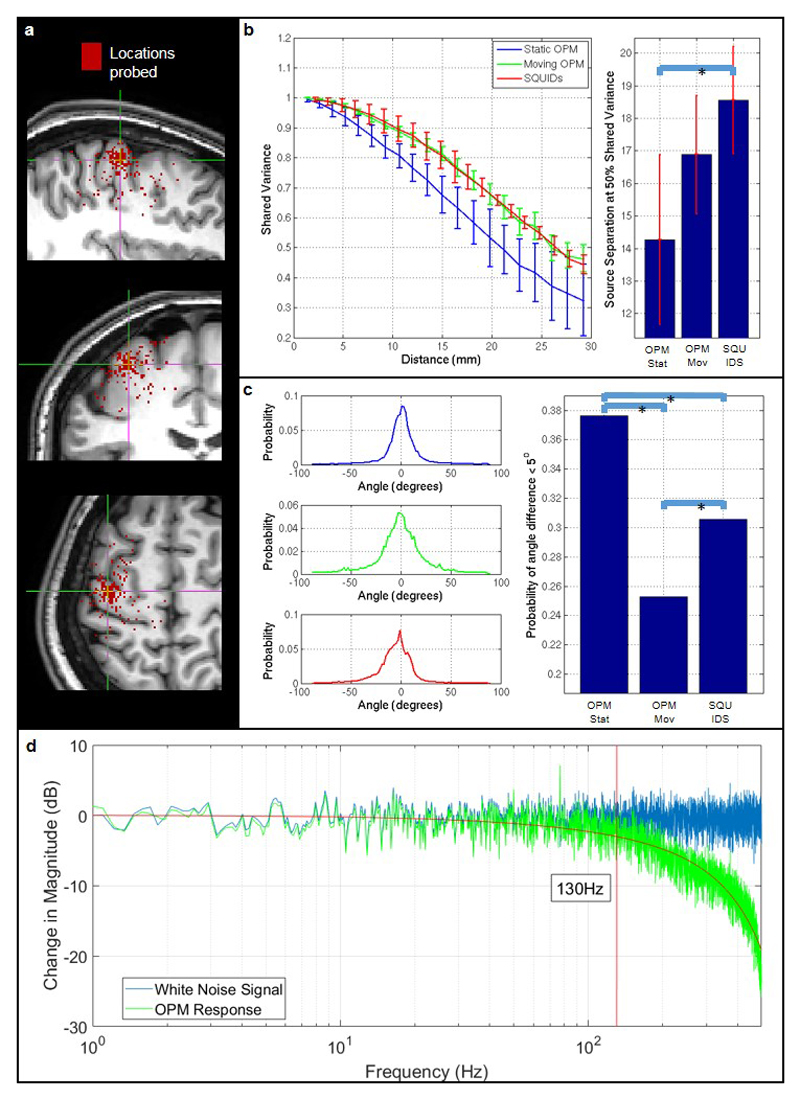
Extended Data Figure 2. Quantification of spatial and temporal resolution.
a) A ‘seed’ location was selected in sensorimotor cortex (at the cross-hairs). 4000 random ‘test’ locations, within 3 cm of the seed, were selected randomly and probed. Shared variance was measured between electrophysiological timecourses at the seed and test locations. b) The line graph shows correlation between the seed and test timecourses plotted as a function of spatial separation. The bar chart shows the source separation at which shared variance dropped to <50 %. In both cases the error bars show standard deviation over test locations. This serves as an absolute quantification of spatial resolution. Note that the OPM array, when static, significantly outperforms SQUIDs (p < 0.05). c) Quantification of the robustness of the source orientation estimation. Whilst source power can vary between experiments, source orientation relies only on the local orientation of the cortical sheet, and should therefore be the same across equivalent experiments. Here the histograms show the source orientation difference (as an angle) across runs for 4000 locations of interest. Note for all three experiments (static OPMs (top) moving OPMs (middle) and SQUIDs (bottom)) the probability distribution peaks at zero as would be expected. The bar chart shows the probability of observing an angular discrepancy < 5 degrees; note that the OPM array, when static, significantly (p < 0.05) outperformed the SQUID array in terms of orientation robustness. Moving OPMs demonstrated the lowest robustness, however this would be expected since the execution of natural movements differed across runs and therefore brain activity in the sensorimotor strip will also differ. The improvement in spatial specificity and robustness in our OPM-MEG system compared to a cryogenic (SQUID) system is likely a consequence of two things – first, the closer proximity of the OPM sensors to the scalp provides higher signal to noise ratio in OPMs compared to SQUIDs; second, the scanner cast ensures that, for each run, OPM sensors are in exactly the same location with respect to the brain. Cryogenic MEG, on the other hand, is subject to coregistration errors. d) Quantifies the OPM sensor’s frequency response which also defines its temporal resolution. An OPM sensor was placed in a Helmholtz coil and a white noise current source applied to the coil. The blue line shows the Fourier spectrum of the current source, the green line shows the spectrum of the measured field. Note that sensitivity falls by 3 dB at 130 Hz, giving a temporal resolution of 7.7 ms.
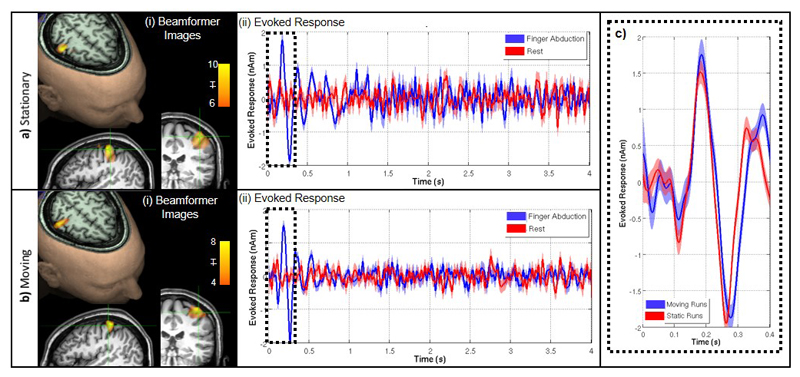
Extended Data Figure 3. Evoked response analysis.
a) Shows the case when the subject was asked to remain still, b) shows the case when the subject was moving. i) Functional image: the overlay shows the spatial signature of the 2-30 Hz component of the evoked response, overlaid onto axial, sagittal and coronal slices of the anatomical MRI. ii) The time course of the evoked response; finger abduction trials in blue, rest trials in red. The shaded area shows standard error across 6 experiments. c) Direct comparison of the evoked response in the case where the subject was asked to remain still (red) and was moving (blue). No significant SIR difference was found between static and moving runs.
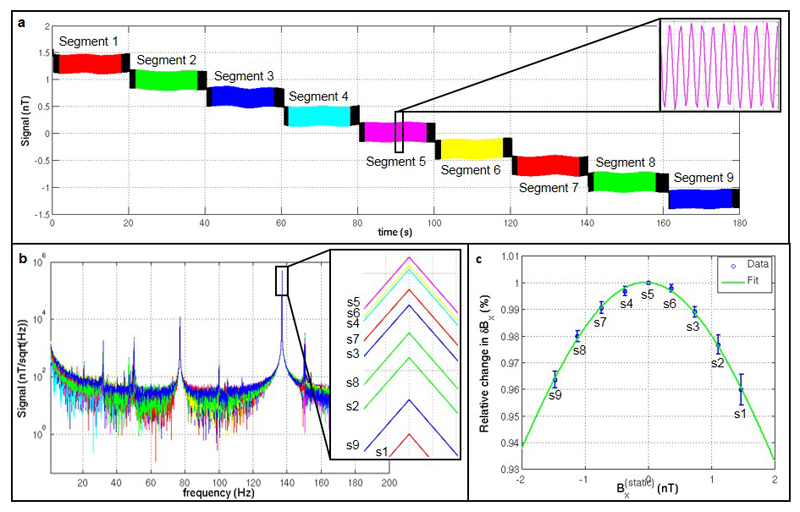
Extended Data Figure 4. Gain changes with static magnetic fields.
a) Raw OPM-MEG data recorded from a single channel during the gain experiment. Data were divided into 9 segments (colour-coded here) corresponding to 9 different static background magnetic fields ranging between -1.5 nT and 1.5 nT. The inset plot shows the small oscillating field (δBx), applied (in this sensor) at 137 Hz using the radially oriented on-sensor coil, that mimics neuromagnetic activity. b) Fourier transforms of each data segment. The inset figure shows the height of the 137 Hz peak for different segments. Note that the peak height changes as a function of static magnetic field. c) Fractional change in δBx as a function of background field The blue circles show the measured data with the standard deviation over the six sensors. The green line shows a fitted Lorentzian function.
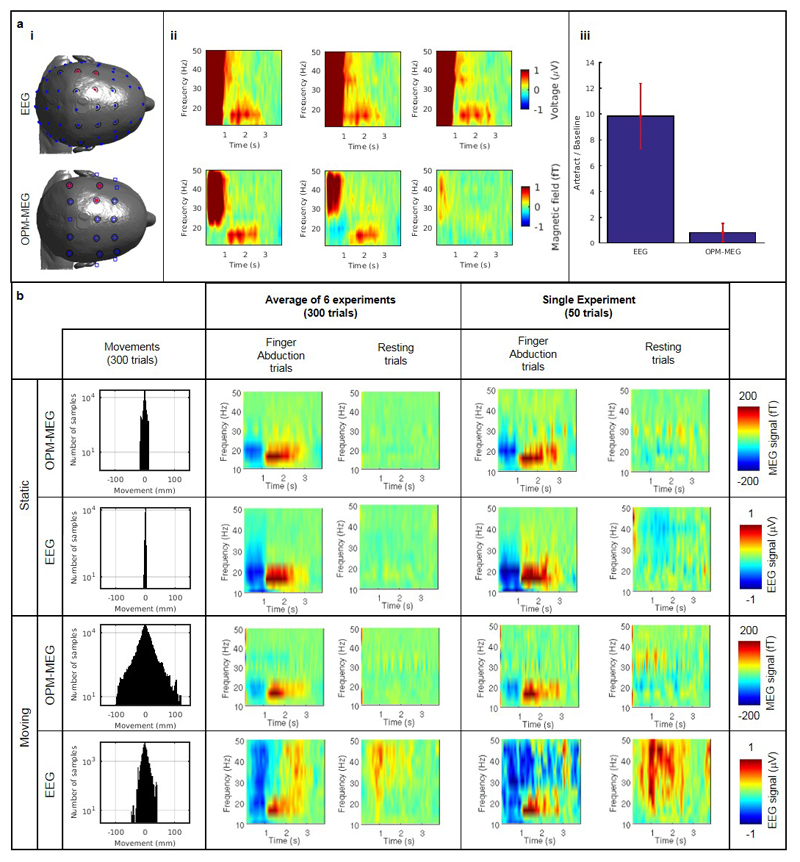
Extended Data Figure 5. A comparison of EEG and OPM-MEG.
a) Muscle tensing experiment. i) Channel montages for EEG (top) and OPM-MEG (bottom). Blue circles show EEG channels used; blue squares show MEG channels used; red stars denote channels used to create (ii); black circles indicate channels used for averages in (iii). ii) Time-frequency spectra showing fractional change in oscillatory amplitude, relative to baseline. The three plots show three separate channels, with the muscle artifact visible in the 0-1 s window, when jaw clenching took place. iii) Quantitative analysis of the magnitude of the artifact, which was measured to be ~10 times larger in EEG. Error bars show standard deviation across sensors. b) Finger abduction experiment. The 4 separate rows show OPM-MEG and EEG data with the subject stationary, followed by OPM-MEG and EEG data with the subject making natural movements. The left-hand column shows movement parameters. The left and left-centre time-frequency spectra show absolute difference from baseline of the MEG (in fT) and EEG (in μV) signals for individual channels, in the finger abduction and resting trials, respectively. These results have been averaged across all six experiments in both modalities. The right and right-centre time-frequency spectra show equivalent visualisations for a single representative experiment. Notice that, with the head static, MEG and EEG show similar results. However with the head moving, EEG data suffer from artifact generated by muscle activity, to which the MEG data are less susceptible.
Extended Data Figure 6. OPM-MEG derived functional connectivity.
A single subject took part in an experiment in which 5 minutes of OPM-MEG data were acquired in the resting state (subject was told to ‘think of nothing’). The experiment was repeated twice and the results averaged. a) A 26 channel OPM scalp array, with OPM sensors positioned (using a scanner cast) approximately to cover the left and right parietal lobes (red circles in a). MEG data were reconstructed in source space using a beamformer, on a 4 mm grid covering the entire brain. A seed location was selected in left sensorimotor cortex and functional connectivity between the seed and the rest of the brain computed using an amplitude envelope correlation measurement, with correction for signal leakage by regression. b) Regions exhibiting strongest functional connectivity to the seed location (in the beta frequency band). Note that, in addition to a region around the seed, functional connectivity is observed in the homologous regions of the opposite hemisphere. This reflects long range functional connectivity within the sensorimotor network. c) Functional connectivity strength between left and right primary sensorimotor cortex, plotted as a function of frequency. Note that, as expected, functional connectivity between these regions is greatest in the beta band (13-30 Hz). Finally, d) shows an example of beta band envelopes from the left (blue) and right (red) sensorimotor cortices, derived from resting state data.
Extended Data Figure 7. An overview of the OPM-MEG system.
a) Schematic diagram showing an overview of system hardware. b) Positioning of the reference sensors relative to the head to allow measurement of the three Cartesian components of the magnetic field, and the two dominant spatial gradients of the field. Each sensor provides measurements of two components of the magnetic field that are perpendicular to the beam axis. Both components were measured for field nulling, but during experimental measurements only the component of the field along the long-axis of the sensor was measured.
Extended Data Figure 8. Crosstalk characterisation across an OPM array.
a) Schematic 3D representation of the crosstalk simulation. The head surface is shown alongside two example sensors. The locations of all 13 sensors are also indicated. We sought to characterise crosstalk between all pairs of sensors in the array. b,c) Simulated crosstalk between sensors measured as the ratio of fields generated by the perturbing sensor and the base sensor at the position of the base sensor. This ratio is a periodic function of sensor rotation about the radial orientation, the minimum interaction is shown in b, the maximum is shown in c. d) Experimentally measured crosstalk matrix.
Extended Data Figure 9. Coil designs.
Wire paths and field plots are shown for the five coils: i) Bx ii) By iii) Bz iv) v) The upper portion of each sub-figure shows the wire paths for one (1.6 x 1.6 m2) plane of the bi-planar coil. Red and blue colours indicate clockwise and anti-clockwise circulation of the current. The lower portion shows contours of the field or field gradient strength over the 0.4 x 0.4 m2 x – y plane located at the centre of the volume of interest (z=0) (For (v) contours are shown in the x – z plane at y=0). The field or gradient values are normalised to the value at x=y=z=0. Variation from the ideal field distribution are less than 5 % over a 0.4 x 0.4 x 0.4 m3 central volume.
Extended Data Figure 10. Removal of muscle artifacts via beamforming.
a) The montage of OPM-MEG channels employed to measure muscle artifact data. b) A beamformer image, highlighting a location of interest in right sensorimotor cortex. c) The time frequency response for the best OPM-MEG sensor. d) Reconstructed responses from the over-regularised beamformer (which is analogous to dipole fitting) (left) and un-regularised beamformer (right). Note that for un-regularised beamforming the muscle artifact is supressed effectively.
Supplementary Material
Acknowledgements
This study was funded by a Wellcome Collaborative Award in Science (203257/Z/16/Z and 203257/B/16/Z) awarded to GRB, RB and MJB. We also acknowledge the UK Quantum Technology Hub for Sensors and Metrology, funded by the Engineering and Physical Sciences Research Council (EP/M013294/1). We acknowledge Medical Research Council Grants (MR/K005464/1 and MR/M006301/1). The Wellcome Centre for Human Neuroimaging is supported by core funding from Wellcome [203147/Z/16/Z]. OPM sensor development at QuSpin was supported by National Institutes of Health grants R44HD074495 and R44MH110288. The scanner casts were designed and manufactured by Mark Lim at Chalk Studios Ltd.
Footnotes
Data Availability:
The datasets generated during and/or analysed during the current study are available from the corresponding author on request.
Code Availability:
The Matlab code used to analyse the current study is available from the corresponding author on request.
Author Contributions:
EB*: System design and fabrication, Data collection, Data analysis, Data interpretation, Writing paper. NH*: System design and fabrication, Data collection, Data analysis, Data interpretation, Writing paper. JL*: System design and fabrication, Data collection, Data analysis, Data interpretation, Writing paper. GR*: System design and fabrication, Data collection, Data analysis, Data interpretation, Writing paper. VS: System design and fabrication. SM: Data interpretation, Writing paper. LDM: Data interpretation, Writing paper. KJM: Data collection, Data analysis, Data interpretation, Writing paper. TMT: Data interpretation, Writing paper. SB: Data collection, Data interpretation, Writing paper. GRB*: Conceptualisation, System design and fabrication, Data interpretation, Writing paper. RWB*: Conceptualisation, System design and fabrication, Data collection, Data analysis, Data interpretation, Writing paper. MJB*: Conceptualisation, System design and fabrication, Data collection, Data analysis, Data interpretation, Writing paper.
* denotes authors who contributed equally to this work
The authors declare competing financial interests: co-author Vishal Shah is founding director of QuSpin – the commercial entity selling OPM magnetometers. QuSpin built the sensors used here and advised on the system design and operation, but played no part in the subsequent measurements or data analysis. This work was funded by a Wellcome award which involves a collaboration agreement with QuSpin.
References
- 1.Cohen D. Magnetoencephalography: Detection of the brains electrical activity with a superconducting magnetometer. Science. 1972;5:664–666. doi: 10.1126/science.175.4022.664. [DOI] [PubMed] [Google Scholar]
- 2.Kominis IK, Kornack TW, Allred JC, Romalis MV. A subfemtotesla multichannel atomic magnetometer. Nature. 2003;422:596–599. doi: 10.1038/nature01484. [DOI] [PubMed] [Google Scholar]
- 3.Shah VK, Wakai RT. A compact, high performance atomic magnetometer for biomedical applications. Physics in Medicine and Biology. 2013;58:8153–8161. doi: 10.1088/0031-9155/58/22/8153. [DOI] [PMC free article] [PubMed] [Google Scholar]
- 4.Hamalainen MS, Hari R, Ilmoniemi RJ, Knuutila J, Lounasma OV. Magnetoencephalography: Theory, instrumentation, and applications to non-invasive studies of the working human brain. Reviews of Modern Physics. 1993;65:413–497. [Google Scholar]
- 5.Gross J, et al. Good practice for conducting and reporting MEG research. NeuroImage. 2013;65:349–363. doi: 10.1016/j.neuroimage.2012.10.001. [DOI] [PMC free article] [PubMed] [Google Scholar]
- 6.Allred J, Lyman R, Kornack T, Romalis MV. High-sensitivity atomic magnetometer unaffected by spin-exchange relaxation. Physical Review Letters. 2002;89 doi: 10.1103/PhysRevLett.89.130801. Article Number: 130801. [DOI] [PubMed] [Google Scholar]
- 7.Shah V, Knappe S, Schwindt PD, Kitching J. Subpicotesla atomic magnetometry with a microfabricated vapour cell. Nature Photonics. 2007;1:649–652. [Google Scholar]
- 8.Dupont-Roc J, Haroche S, Cohen-Tannoudji C. Detection of very weak magnetic fields (10-9 gauss) by 87Rb zero-field level crossing resonances. Physics Letters A. 1969;28:638–639. [Google Scholar]
- 9.Borna A, et al. A 20-Channel Magnetoencephalography System Based on Optically Pumped Magnetometers. 2017 doi: 10.1088/1361-6560/aa93d1. https://arxiv.org/ftp/arxiv/papers/1706/1706.06158.pdf. [DOI] [PMC free article] [PubMed]
- 10.Alem O, Benison AM, Barth DS, Kitching J, Knappe S. Magnetoencephalography of Epilepsy with a Microfabricated Atomic Magnetrode. Journal of Neuroscience. 2014;34:14324–14327. doi: 10.1523/JNEUROSCI.3495-14.2014. [DOI] [PMC free article] [PubMed] [Google Scholar]
- 11.Alem O, et al. Magnetic field imaging with microfabricated optically-pumped magnetometers. Optical Express. 2017;25:7849–7858. doi: 10.1364/OE.25.007849. [DOI] [PubMed] [Google Scholar]
- 12.Boto E, et al. A new generation of magnetoencephalography: Room temperature measurements using optically-pumped magnetometers. Neuroimage. 2017;149:404–414. doi: 10.1016/j.neuroimage.2017.01.034. [DOI] [PMC free article] [PubMed] [Google Scholar]
- 13.Johnson C, Schwindt PDD, Weisend M. Magnetoencephalography with a two-color pump-probe, fiber-coupled atomic magnetometer. Applied Physics Letters. 2010;97 [Google Scholar]
- 14.Johnson CN, Schwindt PD, Weisend M. Multi-sensor magnetoencephalography with atomic magnetometers. Physics in Medicine & Biology. 2013;58:6065–6077. doi: 10.1088/0031-9155/58/17/6065. [DOI] [PMC free article] [PubMed] [Google Scholar]
- 15.Kamada K, et al. Human magnetoencephalogram measurements using newly developed compact module of high-sensitivity atomic magnetometer. Japanese Journal of Applied Physics. 2015;54 Article number 026601. [Google Scholar]
- 16.Kiwoong K, et al. Multi-channel atomic magnetometer for magnetoencephalography: A configuration study. NeuroImage. 2014;89 doi: 10.1016/j.neuroimage.2013.10.040. [DOI] [PubMed] [Google Scholar]
- 17.Pfurtscheller G, Lopes da Silva F. Event-related EEG/MEG synchronization and desynchronization: Basic principles. Clin Neurophysio. 1999;110:1842–1857. doi: 10.1016/s1388-2457(99)00141-8. [DOI] [PubMed] [Google Scholar]
- 18.Gaetz W, Macdonald M, Cheyne D, Snead O. Neuromagnetic imaging of movement-related cortical oscillations in children and adults: Age predicts post-movement beta rebound. Neuroimage. 2010;51:792–807. doi: 10.1016/j.neuroimage.2010.01.077. [DOI] [PubMed] [Google Scholar]
- 19.Mary A, et al. Aging reduces experienceinduced sensorimotor plasticity. A magnetoencephalographic study. NeuroImage. 2015;104:59–68. doi: 10.1016/j.neuroimage.2014.10.010. [DOI] [PubMed] [Google Scholar]
- 20.Robson SE, et al. Abnormal visuomotor processing in schizophrenia. NeuroImage Clinical. 2016;12:869–878. doi: 10.1016/j.nicl.2015.08.005. [DOI] [PMC free article] [PubMed] [Google Scholar]
- 21.Uhlhaas PJ, Singer W. Abnormal neural oscillations and synchrony in schizophrenia. Nature Reviews Neuroscience. 2010;11:100–113. doi: 10.1038/nrn2774. [DOI] [PubMed] [Google Scholar]
- 22.Barratt EL, et al. Abnormal task driven neural oscillations in multiple sclerosis: A visuomotor MEG study. Human Brain Mapping. 2017;38:2441–2453. doi: 10.1002/hbm.23531. [DOI] [PMC free article] [PubMed] [Google Scholar]
- 23.Brookes MJ, et al. Optimising experimental design for MEG beamformer imaging. NeuroImage. 2008;39:1788–1802. doi: 10.1016/j.neuroimage.2007.09.050. [DOI] [PubMed] [Google Scholar]
- 24.Van Veen BD, Van Drongelen W, Yuchtman M, Suzuki A. Localisation of brain electrical activity via linearly constrained minimum variance spatial filtering. IEEE Transactions on biomedical engineering. 1997;44:867–880. doi: 10.1109/10.623056. [DOI] [PubMed] [Google Scholar]
- 25.Poole M, Bowtell R. Novel gradient coils designed using a boundary element method. Concepts in Magnetic Resonance Part B: Magnetic Resonance Engineering. 2007;31:162–175. [Google Scholar]
- 26.Carlson JW, Derby KA, Hawryszko KC, Weideman M. Design and evaluation of shielded gradient coils. Magnetic Resonance in Medicine. 1992;26:4349–4353. doi: 10.1002/mrm.1910260202. [DOI] [PubMed] [Google Scholar]
- 27.Baillet S. Magnetoencephalography for brain electrophysiology and imaging. Nature Neuroscience. 2017;20:327–339. doi: 10.1038/nn.4504. [DOI] [PubMed] [Google Scholar]
- 28.Brookes MJ, et al. Investigating the Electrophysiological Basis of Resting State Networks using Magnetoencephalography. Proceedings of the National Academy of Science USA. 2011;108:16783–16788. doi: 10.1073/pnas.1112685108. [DOI] [PMC free article] [PubMed] [Google Scholar]
- 29.Hipp JF, Hawellek DJ, Corbetta M, Siegel M, Engel AK. Large-scale cortical correlation structure of spontaneous oscillatory activity. Nature Neuroscience. 2012;15:884–890. doi: 10.1038/nn.3101. [DOI] [PMC free article] [PubMed] [Google Scholar]
- 30.Jerbi K, et al. Coherent neural representation of hand speed in humans revealed by MEG imaging. 2007;104:7676–7681. doi: 10.1073/pnas.0609632104. [DOI] [PMC free article] [PubMed] [Google Scholar]
- 31.Shah V, Knappe S, Schwindt PDD, Kitching J. Subpicotesla atomic magnetometry with a microfabricated vapour cell. Nature Photonics. 2007;1:649–652. [Google Scholar]
- 32.Yoda K. Analytical design method of shelf shielded planar coils. Journal of Applied Physics. 1990;67:191–206. [Google Scholar]
- 33.Vrba J, Robinson SE. Signal processing in magnetoencephalography. Methods. 2001;25 doi: 10.1006/meth.2001.1238. [DOI] [PubMed] [Google Scholar]
- 34.Robinson S, Vrba J. Functional Neuroimaging by synthetic Aperture Magnetometry. In: Yoshimoto T, Kotani M, Kuriki S, Karibe H, Nakasato N, editors. Recent Advances in Biomagnetism. Tohoku Univ. Press; Sendai, Japan: 1998. pp. 302–305. [Google Scholar]
- 35.Backus GE, Gilbert F. The Resolving power of Gross Earth Data. Geophysical Journal of the Royal Astronomical Society. 1968;16:169–205. [Google Scholar]
- 36.Sarvas J. Basic mathematical and electromagnetic concepts of the biomagnetic inverse problem. Physics in Medicine and Biology. 1987;32:11–22. doi: 10.1088/0031-9155/32/1/004. [DOI] [PubMed] [Google Scholar]
Associated Data
This section collects any data citations, data availability statements, or supplementary materials included in this article.


