

Abstract
Empirical assessments of human accelerated noncoding DNA frgaments have delineated presence of many cis-regulatory elements. Enhancers make up an important category of such accelerated cis-regulatory elements that efficiently control the spatiotemporal expression of many developmental genes. Establishing plausible reasons for accelerated enhancer sequence divergence in Homo sapiens has been termed significant in various previously published studies. This acceleration by including closely related primates and archaic human data has the potential to open up evolutionary avenues for deducing present-day brain structure. This study relied on empirically confirmed brain exclusive enhancers to avoid any misjudgments about their regulatory status and categorized among them a subset of enhancers with an exceptionally accelerated rate of lineage specific divergence in humans. In this assorted set, 13 distinct transcription factor binding sites were located that possessed unique existence in humans. Three of 13 such sites belonging to transcription factors SOX2, RUNX1/3, and FOS/JUND possessed single nucleotide variants that made them unique to H. sapiens upon comparisons with Neandertal and Denisovan orthologous sequences. These variants modifying the binding sites in modern human lineage were further substantiated as single nucleotide polymorphisms via exploiting 1000 Genomes Project Phase3 data. Long range haplotype based tests laid out evidence of positive selection to be governing in African population on two of the modern human motif modifying alleles with strongest results for SOX2 binding site. In sum, our study acknowledges acceleration in noncoding regulatory landscape of the genome and highlights functional parts within it to have undergone accelerated divergence in present-day human population.
Keywords: cis-regulatory elements, positive selection, transcription factor binding sites, population genetics, 1000 Genomes
Introduction
Gene regulation has long been playing a role in fine-tuning the brain circuits that distinguish the highly cognitive human brain from that of comparatively lesser adaptive nonhuman primate brain function (Cáceres et al. 2003). Primate brain evolution displays a disproportionate enlargement of neocortex, frontal lobe and an overall larger brain volume, properties that underpin its intelligent workings (Dunbar and Shultz 2007). Human brain is triple in size and more efficiently adapted to do highly complicated assessments through language and cognitive skills than that of great apes (Geschwind and Rakic 2013). Evidence also suggests that human neocortex possesses a greater volume and significant cell cycle differences that lead to increased corticogenesis (Boyd et al. 2015). At molecular level, little evidence has been uncovered to relate gene sequence change with the phenotypic traits that bifurcate humans and the closest relative chimpanzee into two different strata of intelligence. It is however established that in gene regulation, the spatiotemporal expression of genes plays a defining role in making up the current form of highly adaptive brain of present-day humans (Enard et al. 2002; Cáceres et al. 2003; Gu and Gu 2003). Previous study stated that the human-chimp cerebral cortex relies on a special patterning of gene expression. Out of a gene pool considered in the study, 169 genes were observed to have expressed differently between human and chimpanzee. Among them, 91 genes hinted at being differently expressed in the human lineage alone, with macaque as an outgroup (Cáceres et al. 2003). About 90% of the genes that were differentially expressed in human lineage belonged to brain, whereas in liver and heart, nearly an equal number of genes were upregulated and downregulated between human and chimpanzee (Cáceres et al. 2003). Another analysis sums up the number to 54 prefrontal cortex (PFC) genes having a lineage specific upregulation in human PFC after divergence from other hominoids (Geschwind and Rakic 2013).
Recent findings have highlighted that human specific mutations in enhancers can impart huge changes in gene regulatory mechanisms and eventually produce brain size differences (Boyd et al. 2015). Enhancers despite of their proximal existence to promoters of some genes are widely catalogued as also the distal category of cis-regulatory elements, residing many kilobases (kb) away from their target genes; and contribute to gene regulatory networks in terms of initiating cell specific gene expression together with transcription factor (TF) occupancy (Spitz and Furlong 2012; Choukrallah et al. 2015). In mammals, enhancers are either active or primed. Active enhancers possess biochemical signatures of H3K27ac and H3K4me1 and are associated with actively expressing genes whereas primed enhancers possess only the latter methylation mark and are most likely to get activated later on by a developmental or environmental stimulus once a cell has acquired its tissue specific identity (Choukrallah et al. 2015).
An enhancer sequence can recruit transcription factors in a variety of ways. TF cooperativity either by direct interaction among the adjacently binding TFs or through indirect cobinding with the cofactor largely determines the transcriptional outcome an enhancer will deliver (Spitz and Furlong 2012). Functional implications of TF binding could be debated as TF binding event does not always imply regulatory control of the nearby genes. Many binding events have been termed nonfunctional and could be due to easier access to chromatin that the TF has occupied or reconfiguration of the nucleosome induced by the binding event for facilitating another TF occupancy leading to gene expression (Spitz and Furlong 2012). Differences in the transcription factor binding sites (TFBSs) between the species within the regulatory sequences can impart huge impact on the regulation of the associated genes. Substitution in intron 8 of FOXP2 gene within the vertebrate conserved POU3F2 binding site in the present-day humans when compared with Neandertals portrayed potential candidacy for driving selective sweep in the entire FOXP2 gene (Maricic et al. 2013). Selective sweep in a population, therefore, confers a genomic region significant where an allele offering a fitness advantage increases in frequency along with other neighboring alleles (linkage disequilibrium). This phenomenon renders the entire locus less diverse (Cadzow et al. 2014).
Many of the accelerated portions of the genomes harbor developmental enhancers and genomic changes within them can impart huge alterations in brain function (Prabhakar et al. 2008; Burbano et al. 2012; Hubisz and Pollard 2014). Evolutionary studies have also endorsed acceleration in enhancer sequences compared with coding and noncoding/nonenhancer genomic blocks in vertebrates during land adaptation (Yousaf et al. 2015). A recent study has therefore consolidated this view where human specific changes in a neuro-developmental enhancer of FZD8 gene produced immense differences in the size of the brain (Franchini and Pollard 2015). Necessitating enhancers and their role in predominantly controlling the spatiotemporal expression of the genes, we uncovered sequential changes that rapidly accumulated in human brain enhancers (Maston et al. 2006). For that we devised a strong limiting criterion to include brain specific enhancers that are already functionally confirmed, bringing forth the safety of eliminating any genomic noncoding portions that failed to act as enhancers during functional verifications (Kvon 2015). This criterion is in line with recent studies that have rendered the use of biochemical signatures such as H3K4 monomethylation for enhancer function and prediction useless (Dorighi et al. 2017). Thus, out of our root data set of empirically confirmed, brain specific enhancers, we isolated those enhancers that showed significant signatures of acceleration upon comparison with closest nonhuman primates. By including archaic human data, we also pinpointed human unique TFBSs within these accelerated sequences that have been modified when compared with great apes and within them construed binding sites that are exclusive to H. sapiens. This study is commensurate with data that describes greater percentage of variants within noncoding regulatory genome than coding part of the genome. This work also brings forth patterns of accelerated divergence across present-day human population for SNPs residing in H. sapiens-specific TFBSs, ones which are not shared among the orthologous enhancer archaic and nonhuman primate sequences.
Materials and Methods
Determining Accelerated Cis-Elements within an In Vivo Catalog of Enhancers
We initiated our search for functionally confirmed enhancers by employing an in vivo repertoire of VISTA enhancer browser (Visel et al. 2007). In sum, from an available total of 1,393 elements in VISTA with enhancer activity confirmed in different kinds of tissues, we collected only 271 enhancers that showed endogenous expression profiles exclusively in brain regions (supplementary table 1, Supplementary Material online). Out of the total collected brain enhancers, exclusive subset in which enhancers expressing solely in the forebrain (104), midbrain (55), and hindbrain (38) tissues were placed, the other subset incorporated enhancers expressing in either two (62) or three (12) of the aforementioned brain domains. Orthologous nonhuman primate sequences were collected through UCSC genome browser via BLAT (Kent 2002; Karolchik et al. 2003). We used MAFFT to generate alignments for human and nonhuman primate orthologous enhancer sequences (Katoh et al. 2002). In order to see patterns of enhancer sequence acceleration, we undertook the approach defined by Haygood and coworkers (Haygood et al. 2007). Our analysis carried three-species alignment (human-chimp-macaque), the minimum number of sequences allowed. Initially in the first round, global proxy by employing intron 5 of FHL1 gene was used to first gather a set of “possibly” accelerated enhancers (supplementary table 1, Supplementary Material online). Test statistic of P value with 95% confidence level implies all enhancers to be under positive selection with a value <0.05. P values were corrected for false discovery rate (Q values) for this first round of analysis (Storey and Tibshirani 2003). However, enhancers greater in alignment length than the proxy region intron 5 of FHL1 gene also existed. To address the length parameters that state proxy and target region should at least be equal (Haygood et al. 2007), we applied a bigger 35.4 kb proxy region of intron 1 of FHL1 gene to all of the enhancers with possible selection signals from the first round (supplementary fig. 1 and table 2, Supplementary Material online). Local proxies employing introns of genes residing within a 100 kb distance from the enhancer of interest were then employed to cut down on the number of false positives (supplementary table 3, Supplementary Material online). Noncoding, nonrepetitive, loosely conserved sites (NCNRS) were used as proxies to determine signals of positive selection on enhancers that were bracketed by longer gene deserts.
Assigning Binding Motifs to Accelerated Enhancers
To determine binding motifs in the positively selected enhancers, TRANSFAC was made use of for motifs belonging to a list of 142 carefully inspected TFs. These TFs were confirmed via literature for their role in human brain development. The collected TFs were also in harmony with the enhancer sequences they were being searched in for their expressional search space, that is, all the collected TFs showed endogenous expression profiles in one of the brain domains (MGI: in situ RNA hybridization and Human Protein Atlas) (supplementary table 4, Supplementary Material online) (Uhlén et al. 2015; Blake et al. 2017). All those motifs were noted that showed a significant human unique presence in the enhancer sequences when compared with orthologous nonhuman primate sequences from chimp, gorilla, orangutan, and macaque. For determining H. sapiens-exclusive TF binding motifs, parallel sequences belonging to Neandertals and Denisovans were added to the alignments (Meyer et al. 2012; Prüfer et al. 2014). The H. sapiens-unique binding motifs resulted in single nucleotide variants (SNVs) that distinguished the ancestral binding site from that of the derived binding site in modern humans.
Establishing Selection Regime on SNVs within Unique Sites
To explore population dynamics over the allelic variants among the H. sapiens-unique TFBSs, 1000 Genomes Project Phase3 data was employed to see the trend of natural selection among the human population (Consortium 2015). Unphased VCF files from 1000 Genomes Project were converted to phased haplotype files through fastPHASE (Scheet and Stephens 2006). In order to generate analysis that highlights the segregating alleles to be under the influence of positive selection, extended haplotype homozygosity (EHH) plots and relative EHH (rEHH) score were generated through package “rehh” (version 2.0.0) and Sweep software, respectively (Sabeti et al. 2007; Gautier and Vitalis 2012). Weir and Cockerham Fst values were computed through VCFtools to estimate significantly differentiated SNPs between populations (Danecek et al. 2011). The haplotype range defined had 300 kb region at either ends of the enhancer making up an entire region under consideration to be of approximately 600 kb. Bearing in mind that human populations belonging to different ethnicities hone different adaptive mechanisms because of being exposed to variable climatic differences and changeable adaptive pressures (Tekola-Ayele et al. 2015), we catered to such vast yet delicate regional inconsistencies by dissecting our allelic deductions into regional and worldwide graphical representations. The schematic illustration of the workflow is shown in figure 1.
Fig. 1.
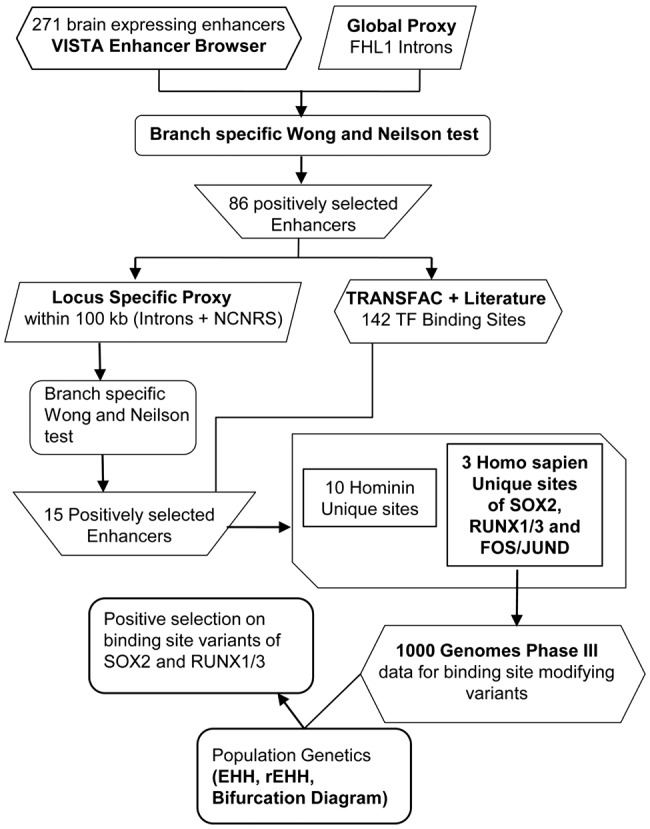
—Schematic display of the carried out steps in the work design.
Results and Discussion
Identifying Accelerated Enhancers and Binding Motifs within Them
Human accelerated DNA frgaments are those bits of the genome that have experienced frequent sequential changes after the human-chimp split despite being strongly conserved among mammals (Hubisz and Pollard 2014). In vivo analysis of such human accelerated noncoding regions attributed to the presence of cis-regulatory transcriptional enhancers controlling the expression of many developmental genes (Prabhakar et al. 2008; Burbano et al. 2012). As of recent findings, human specific mutations in enhancers have brought to light the massive implications gene regulation can have on brain size and eventually on highly developed brain function in humans (Boyd et al. 2015). We codified a strategy to find out the extent to which these human specific enhancer changes manifest in reshaping human brain circuits, and eventually characterizing H. sapiens as the most successfully thriving members of the genus Homo. To pursue the investigation, we incumbently relied on an empirically verified, in vivo catalog of human brain specific enhancers derived by Visel and colleagues for the root data set of this study (Visel et al. 2007). We conducted prioritized enhancer assortment obtained via transgenic mice assay to maintain reliabilty over ChIP-seq predicted putative enhancers that render a possibility of being eliminated as nonenhancers due to experimental artifacts or dubious nature of TF binding (Kvon 2015). We then set out to construe sequence mutations within these enhancers and the rate at which they have proliferated in the human lineage, upon comparison with the closest relative chimpanzee taking macaque as an outgroup. We employed the approach undertaken by Haygood and coworkers, originally used to expound signals of positive selection on promoter sequences (Haygood et al. 2007). The technique takes target-proxy asscoication based upon branch specific Wong and Neilson test, a phylogenetic, branch specific approach that takes intronic proxy as reference for estimating signals of positive selection in the target enhancer alignment on the foreground branch (Zhang et al. 2005).
Unlike contextual search for signals of positive selection in which it is advised to stay within a 100 kb range from the target enhancer sequence to make sure mutation rate does not vary among the intronic proxy and target enhancer regions, our preliminary search for accelerated rate in the candidate enhancer regions undertook “global” proxies (Haygood et al. 2007). Highly conserved among the three aforementioned species, introns 1 and 5 of chromosome X residing housekeeping FHL1 gene were the initial choices. This intronic proxy choice made the screening independent of considering any genomic mutational hot and cold spots and also the chromosomal context (Chuang and Li 2004). This enabled us to narrow down enhancers that possessed a supposedly higher chance of accelerated evolution in the human lineage than the considered nonhuman primate orthologs. Therefore, this approach resulted in 86/271 enhancers, predicted to be evolving at an accelerated rate (fig. 2a and supplementary tables 1 and 2, Supplementary Material online). To determine the extent of false positives, the 86 predicted fast evolving enhancers were subjected to a more rigorous, context based approach in which introns of within 100 kb residing nearby gene were selected to be the locus specific intronic proxies to compare with the enhancer of interest. For enhancers bracketed by longer gene deserts, random, loosely conserved, noncoding, and nonrepetitive sequences were preferred. This stringent criterion curtailed the set of brain exclusive human accelerated enhancers (BE-HAEs) to 15 (fig. 2b and supplementary table 3, Supplementary Material online).
Fig. 2.
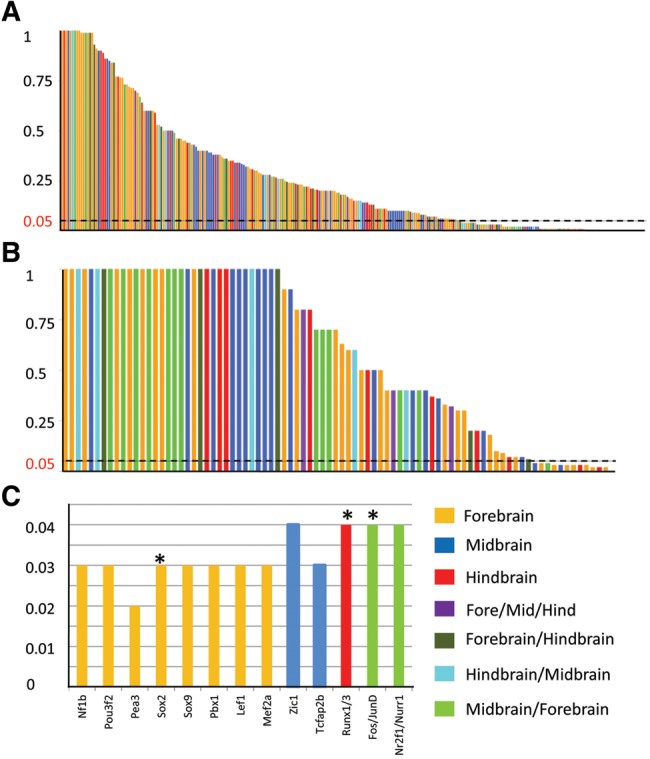
—271 Human brain specific VISTA enhancers: Test for positive selection using branch specific Wong and Nielson method with foreground branch human. (a) Y-axis contains P-values. X-axis contains a total of 271 Enhancers. Each enhancer was compared and analyzed with conserved intron 5 of human FHL1 gene. 86/271 enhancers significantly indicated signals of positive selection (enhancers under the bar = P value < 0.05). (b) Previously collected 86 enhancers in (a) were subjected to a robust analysis. Each enhancer was compared and analyzed with a locus specific intronic proxy from a nearby gene. This analysis contracted the previous findings to a number of 15 enhancers that were persistent in showing signals of positive selection (enhancers under the bar = P value < 0.05). (c) The resultant 15 enhancers were checked for human unique TFBSs on comparison with nonhuman primates (chimp, gorilla, macaque, and orangutan). Fifteen corresponding TFBSs were unique to human in nine of the enhancers with signals of positive selection. The asterisk mark on the bars indicates modern human specific variant in the TFBSs.
To establish in silico the human driven functional modules over the shortlisted 15 BE-HAEs, a list of such TFs were looked for via extensive literature survey that depict a functional role in one or more human brain domains. 142 TFs were obtained and cross checked for their categorized endogenous expression profiles (MGI: RNA in situ hybridization, Human Protein Atlas) to maintain expressional congruence with that of the selected set of brain enhancers (supplementary table 4, Supplementary Material online) (Blake et al. 2017). The corresponding binding profiles of the collected TFs were sought through TRANSFAC, a robust database for eukaryotic transcription factors (Matys et al. 2006). Through initial examination of the binding profiles in BE-HAEs alignments by taking chimpanzee, gorilla, orangutan, and macaque as orthologous comparisons, 13 human unique binding motifs corresponding to 16 transcription factors occurring within 9/15 BE-HAEs came to notice (fig. 2c and table 1). Previously it has been reported that 8% of the human derived mutations in the accelerated regions of the genome are recent, estimated to have arisen in a span of 550–765 Kyr since the divergence of H. sapiens from archaic hominins (Burbano et al. 2012; Prüfer et al. 2014). It is also speculated that coding region mutations shared with archaic humans were followed by substitutions in regulatory elements that were H. sapiens-unique and hence attributed to anatomically profound modern human traits (Prabhakar et al. 2008; Maricic et al. 2013). To determine whether the modified 13 binding motifs in modern H. sapiens diverged after the split from archaic humans, orthologous archaic human sequences (Neandertals and Denisovans) were introduced to the alignments (Meyer et al. 2012; Prüfer et al. 2014). Three such TFBSs were seen to have evolved solely in modern humans for TFs SOX2, RUNX1/3, FOS/JUND within BE-HAEs hs1210 inhabiting H. sapiens-autosome 2 (Hsa2: 66762515–66765088), hs563 (Hsa6: 98491829–98493238), and hs304 (Hsa9: 8095553–8096166), respectively (fig. 3). Remainder shared sites among the three Homo species can be viewed in supplementary figure 2, Supplementary Material online. All of these modified TFBSs had single nucleotide variants (SNVs) within them that differentiated them into human or hominin specific set of TF binding profiles.
Table 1.
Human Unique Transcription Factor Binding Sites in a Set of 15 Brain Exclusive Enhancers with Positive Selection Signals
| SN | ID | GRCh37/hg19 | Brain Domain | TF | TFBS |
|---|---|---|---|---|---|
| 1 | hs37 | chr16: 54650598–54651882 | Forebrain | PEA3 | ACWTCCK |
| 2 | hs1210 | chr2: 66762515–66765088 | Forebrain | SOX2a | NNNANAACAAWGRNN |
| 3 | hs526 | chr4: 1613479–1614106 | Forebrain | NF1B | CTGGCASGV |
| — | — | — | POU3F2 | NWAAYAAW | |
| 4 | hs563 | chr6: 98491829–98493238 | Hindbrain | RUNX1/3a | TGTGGT |
| 5 | hs1366 | chr6: 38358690–38360084 | Midbrain | TCFAP2B | CCCCAGGC |
| 6 | hs1632 | chr11: 116521882–116522627 | Midbrain | ZIC1 | VGGGGAGS |
| 7 | hs1726 | chr18: 49279374–49281480 | Hindbrain | — | — |
| 8 | hs1526 | chr2: 104353933–104357342 | Forebrain | SOX9 | RNACAAAGGVN |
| — | — | — | PBX1 | NYAYMCATCAAWNWNNN | |
| 9 | hs847 | chr4: 42150091–42151064 | Forebrain | LEF1 | NWTCAAAGNN |
| MEF2A | TATTTWWANM | ||||
| 10 | hs540 | chr13: 71358093–71359507 | Forebrain | — | — |
| 11 | hs1019 | chr7: 20838843–20840395 | Forebrain | — | — |
| 12 | hs192 | chr3: 180773639–180775802 | Forebrain | — | — |
| 13 | hs1301 | chr11: 16423269–16426037 | Forebrain | — | — |
| 14 | hs430 | chr19: 30840299–30843536 | Midbrain | — | — |
| 15 | hs304 | chr9: 8095553–8096166 | Mid/Fore | FOS/JUNDa | TGACTCA/TGACTCAN |
| — | — | — | NR2F1 | TGACCTY | |
| — | — | — | NURR1 | YRRCCTT |
Note.—TF, Transcription Factor; TFBS, Transcription factor binding site.
Modern human-specific TFBSs.
Fig. 3.

—Human accelerated enhancers with H. sapiens-unique transcription factor binding sites. (a) Human enhancer hs1210 (shown in brown) was shortlisted to be an enhancer under positive selection when compared with MEIS1 introns with a resultant P value of 0.03. In this figure, an aligned patch within human forebrain enhancer hs1210 has been shown with an existing transcription factor binding site of SOX2. The region also showed a novel substitution within the binding site of SOX2 (TAGACA*ACAATGGAT) in the modern human lineage, unlike the consistent nucleotide observed for archaic humans, primates and nonprimate mammals (TAGACT*ACAATGGAT). (b) Human enhancer hs563 (shown in brown) was shortlisted to be under positive selection when compared with a non-coding non repetitive sequence with a resultant P value of 0.03. In this figure, an aligned patch within human hindbrain enhancer hs563 has been shown with the existing transcription factor binding motif of RUNX1/RUNX3. The region also showed a novel substitution within the binding site of RUNX1/RUNX3 (TGTGGT*) in the modern human lineage, unlike the consistent nucleotide observed for archaic humans, primates and nonprimate mammals (TGTGGG*). (c) Human enhancer hs304 (shown in brown) was shortlisted to be under positive selection when compared with a noncoding non repetitive sequence with a resultant P value of 0.04. In this figure, an aligned patch has been shown with the existing transcription factor binding site of FOS/JUND. The region also showed a novel substitution within the binding site of FOS/JUND (T*GACTCA) in the modern human lineage, unlike the consistent nucleotide observed for archaic humans, primates, and nonprimate mammals (C*GACTCA).
Signatures of Recent Positive Selection on SNVs within Binding Motifs
The three identified H. sapiens-unique single nucleotide variants (SNVs) modifying the binding motifs of SOX2, RUNX1/3, and FOS/JUND were further substantianted as single nucleotide polymorphisms (SNPs), the difference lies in SNPs being at a >1% frequency in a population (Karki et al. 2015). These SNPs corresponding to BE-HAEs hs1210, hs563, and hs304 have dbSNP IDs as rs11897580, rs2498442, and rs6477258, respectively (Sherry et al. 2001). It is understood that a SNP inhabiting a functional domain such as a TFBS can modify the enhancer sequence. The two or more sites that are created as a result might offer variable binding properties to the TFs (original or new TF), eventually creating activity bias for the enhancer they are occupying. However, some plausible outcomes can be expected about TFBS sequence structures that two variants of a SNP are creating, such as 1) the two variable TFBSs can retain the original TF binding property, may be through possible differential affinity, 2) the modified TFBS is impaired enough not to bind the original TF, 3) the altered TFBS can bind both original and new TFs, 4) the altered TFBS can bind only the new TFs, or 5) the altered TFBS altogether loses the ability to bind any TF (Heckmann et al. 2010). As per conclusions, it is established that regulatory control over the genes has a major leverage in human evolution. Moreover, positive selection on such genomic regions that may influence a functional structure is another mainstream driving force to have revamped the current human status (Barreiro et al. 2008; Hussin et al. 2010). To establish selection regime on such SNPs, we referred to 1000 Genomes Project Phase3 data and found derived alleles (TFBS modifying variants in H. sapien lineage) of all three SNPs (rs11897580, rs2498442, and rs6477258) to be occurring near or below the intermediary frequency, that is, 0.5 and hence not fixed in the modern day human populations (table 2). Exploiting the frequency and length of the haplotype with the variant at hand is resourceful in knowing the ongoing selection pattern on that variant and consequently its role in functional adaptation (Sabeti et al. 2002; Nielsen 2005; Voight et al. 2006). In order to see whether the derived alleles of all three SNPs lie in a putatively selected haplotype, we investigated them based upon the work of Sabeti and coworkers (Sabeti et al. 2002, 2007).
Table 2.
Derived Allele Frequencies and Weir and Cockerham Fst Values of SNPs within Enhancers hs1210, hs304, and hs563
| Enhancer | SNP | TFBS | D/A | Derived Allele Frequency |
Weir and Cockerham Fsta |
||||||||
|---|---|---|---|---|---|---|---|---|---|---|---|---|---|
| — | — | — | afr | amr | eur | sa | ea | afr | amr | eur | sa | ea | |
| hs1210 | rs4452126 | — | T/C | 0.075 | 0.005 | 0.001 | 0 | 0 | 0.1 | 0.006 | — | — | — |
| — | rs550939004 | — | A/T | 0.09 | 0.0014 | 0 | 0 | 0 | 0.15 | 0.013 | — | — | — |
| — | rs11897580 | SOX2 | A/T | 0.13 | 0.006 | 0.001 | 0 | 0 | 0.2 | 0.01 | — | — | — |
| hs304 | rs6477258 | FOS/JUND | C/T | 0.28 | 0.25 | 0.29 | 0.34 | 0.32 | 0.0009 | 0.007 | −0.0003 | 0.006 | 0.001 |
| hs563 | rs2498442 | RUNX1/3 | G/T | 0.52 | 0.45 | 0.44 | 0.62 | 0.4 | 0.027 | 0.003 | 0.006 | 0.048 | 0.024 |
D, Derived; A, Ancestral allele; afr, Africa; amr, America; eur, Europe; sa, South Asia; ea, East Asia.
Weir and Cockerham Fst calculated between one population and rest.
Elucidating BE-HAE hs1210, we observed core haplotype 4 (CH4) to be selected with the highest upstream rEHH value carrying the derived allele of the SNP rs11897580 (T > A) for a 2.5 kb region in Africa (table 3). In the same positively selected haplotype we observed another derived allele of the SNP (dbSNP ID: rs4452126: C > T) inhabiting the same HAE to be cooccuring or hitchhiking with our derived allele of interest. Hitchhiking has a typical signature of linkage disequiblirum with it, that is, the nonrandom association between the beneficial allele under positive selection and the neighboring alleles increases, giving less time to recombination to break the association (Hussin et al. 2010). Hitchhiking effect has been limited to a region as low as 1 kb and less for regions where recombination is high and variation is more (Fay and Wu 2000). Noticeably, both derived alleles exist in >5% of Africans and absent/nearly absent elsewhere (table 2). This makes the speculation that the derived alleles of the SNPs rs11897580 and rs4452126 are hitchhiking in African haplotypes, or have been positiveley coselected for, implying sweep is underway in this region. Furthermore, EHH plots and bifurctaion diagrams constructed for both SNPs indicated that the derived alleles are segregating under the clear influence of positive selection than their respective ancestral counterparts for a region as long as 10.8 kb in Africans (fig. 4). To further confirm, Weir and Cockerham Fst test undertaken indicated that the two SNPs have statistically significant population differentiation between Africans and other samples implying that our allele of interest (SOX2 TFBS modifying allele) is segregating under the influence of positive selection in Africa (table 2).
Table 3.
Core Haplotypes with SNP rs11897580 within Enhancer hs1210 with Each Haplotype’s rEHH Score in African Population
| Core Haplotype (CH) | Hap Freq | rEHH (u, d) | rEHH P Value (u, d) | |
|---|---|---|---|---|
| CH1 | C C T T A G | 370 (0.56) | 0.04, 0.19 | 0.98, 0.56 |
| CH2 | T C T T A A | 106 (0.16) | 1.05, 1.12 | 0.59, 0.55 |
| CH3 | C C A T A A | 59 (0.09) | 10.17, 8.76 | 0.13, 0.16 |
| CH4 | C Ta T Aa A A | 53 (0.08) | 48.51, 11.95 | 0.006, 0.1 |
| CH5 | C C T T G A | 40 (0.06) | 1.62, 0.56 | 0.69, 0.92 |
| CH6 | C C T A A A | 33 (0.05) | 4.19, 2.39 | 0.2, 0.35 |
| — | Total = 661 | — | — | |
Note.—The table enlists SNPs rs5006732, rs4452126, rs550939004, rs11897580, rs11681729, and rs10865355 in core haplotypes in a region of 2.5 kb. Hap Freq, Haplotype Frequency; u, upstream; d, downstream.
Unique derived variants of SNPs rs4452126 (T) and rs11897580 (A) in CH4.
Bold represent significant results (rEHH-score and rEHH P-value) for the respective haplotype CH4.
Fig. 4.

—EHH plots and bifurcation diagrams of SNPs rs4452126 and rs11897580 belonging to forebrain expressing VISTA enhancer hs1210 in the African population. (a) EHH plot for SNP rs4452126 has a clear demarcation for derived allele T in terms of positive selection. EHH = 1 indicates all haplotypes carrying either ancestral or derived state of the allele are matching upto this point. Bifurcation diagram of the derived variant of the allele confirms the deduction with a clearly long haplotype and absolutely no branching at the nodes upto 10.8 kb region. (b) EHH plot for SOX2 TFBS modifying allele A of SNP rs11897580 also harbors evidence to be selected under positive selection compared with the ancestral allele T for a 10.8 kb region. Bifurcation diagram uncovers little branching at the nodes interpreting for lesser recombination events and hence longer haplotypes for the derived allele compared with the ancestral variant T, especially for a 2.5 kb region [chr2: 66762480–66764997] containing six SNPs (table 3).
To assess for SNP rs2498442 (G > T) lying in BE-HAE hs563, haplotype construction revealed significant downstream rEHH P value for core haplotype 1 (CH1) containing the derived state of the SNP again in Africans (table 4 and supplementary table 5, Supplementary Material online). EHH plots constructed in a region wise manner, also depict positive selection in Africa in terms of greater area coverage indicating longer haplotypes and strong linkage disequiblrium with the derived state when compared with the rest of the regional plots (fig. 5a and supplementary fig. 3a, Supplementary Material online). Global trend however indicates overall positive selection on downstream region for derived allele (supplementary fig. 3c, Supplementary Material online).
Table 4.
Core Haplotypes with RUNX1/RUNX3 Binding Site Modifying SNP rs2498442 within VISTA Enhancer hs563 with Each Haplotype’s rEHH Score
| Core Haplotypes (CH) | Haplotype Frequency |
rEHH (u, d) |
||||||||||
|---|---|---|---|---|---|---|---|---|---|---|---|---|
| Total | America | Europe | South Asia | Africa | East Asia | America | Europe | South Asia | Africa | East Asia | ||
| CH1 | C G G Ta T C T | 1232 | 0.45 (156) | 0.45 (227) | 0.62 (303) | 0.52 (344) | 0.4 (202) | 0.4, 0.5 | 0.76, 0.54 | 0.12, 0.32 | 0.3, 1.89 | 0.23, 0.63 |
| CH2 | C A G G A T C | 852 | 0.34 (118) | 0.44 (221) | 0.25 (122) | 0.27 (179) | 0.42 (212) | 1.63, 1.7 | 0.76, 1.05 | 5.5, 2.13 | 2.03, 0.28 | 2.07, 0.92 |
| CH3 | T G T G A C C | 344 | 0.2 (69) | 0.11 (55) | 0.13 (64) | 0.1 (66) | 0.18 (90) | 1.87, 1.31 | 5.98, 6.07 | 5.46, 4.44 | 3.02, 2.27 | 2.5, 2.8 |
| CH4 | C G G G T C C | 44 | 0.01 (4) | 0 | 0 | 0.06 (40) | 0 | — | — | — | 6.44, 0.64 | — |
| CH5 | C A T G A C C | 13 | 0 | 0 | 0 | 0.02 (13) | 0 | — | — | — | 5.57, 3.64 | — |
| Total | 2492 | 347 | 503 | 489 | 649 | 504 | — | — | — | — | — | |
Note.—The table enlists SNPs rs62420423, rs9388046, rs4499937, rs2498442, rs2498443, rs13194250, and rs2503789 in core haplotypes covering a 3.7 kb region. u, Upstream; d, downstream.
Derived allele T of SNP rs2498442 (T).
Bold represents significant rEHH score in African population for the respective haplotype CH1.
Fig. 5.

—EHH plots and bifurcation diagrams for African population depicting SNPs rs2498442 and rs6477258 within VISTA enhancers hs563 and hs304, respectively. (a) SNP rs2498442 within enhancer hs563 expressing in the hindbrain tissue. African Population shows a more pronounced EHH plot with the RUNX1/RUNX3 TFBS modifying derived allele T (shown in green) covering more area under the curve in the downstream region than the ancestral allele G (shown in red). Bifurcation diagram spanning a 10.25 kb region (shown in green) has lesser branching showing lesser recombination events and making of longer haplotypes with the derived allele whereas ancestral allele has relatively more branching and shorter haplotypes in the same region. (b) SNP rs6477258 within enhancer hs304 expressing in the midbrain/forebrain tissue. EHH plot for FOS/JUND TFBS modifying derived allele T (shown in green) indicates greater area coverage in Africa on both sides when compared with the ancestral allele C (shown in red). Corresponding bifurcation diagram for Africa also reveal longer haplotype with lesser recombination events shown as branching at the nodes for TFBS modifying allele T than the ancestral allele C for a 4 kb region.
For SNP rs6477258 (C > T) inhabiting BE-HAE hs304, no haplotype for any region was reported to have a significant rEHH with either the ancestral or derived state of the SNP. EHH plots created for American, East Asian, and South Asian populations with the SNP rs6477258 were in congruence with the global trend indicating downstream region with the derived state to have greater area under the curve except for European population (supplementary fig. 3b and c, Supplementary Material online). However, African population showed marked deviation in the EHH graph pattern from rest of the populations as well as the global trend, as prominent greater coverage under the curve on both sides of the graph and lesser branching with the derived allele in bifurcation diagram were observed than the counterpart ancestral allele upto a 4 mb region (fig. 5b).
In sum, our long range haplotype (LRH) based results narrate that derived alleles in BE-HAEs hs1210 and hs563, inhabiting modern human specific binding motifs of SOX2 and RUNX1/3, respectively, are under positive selection in Africa. Since, long range haplotypes persist for shorter time spans, that is, <30,000 years, we estimate these two modern human specific variations in binding motifs to have undergone recent positive selection in Africans (Barreiro et al. 2008). It is also interesting to note that the transcription factors occupying the H. sapiens-unique binding sites such as SOX2 and RUNX1/3, also maintain a vital role in gene expression especially in the context of neural development. SOX2 is a high mobility group (HMG) box TF characterized to be widely expressed in whole of neural tube, known to keep the progenitor chracateristic of the neural progenitor cells in both mature and developing CNS of humans (Hutton and Pevny 2011; Beccari et al. 2012). Runt related (RUNX) genes comprise of evolutionarliry conserved group of TFs that are mainly responsible for maintaining lineage unique expression of the genes (Stifani and Ma 2009). In mouse CNS, RUNX1 is produced in cholinergic branchial and visceral motor neurons of the hindbrain, whereas RUNX3 expression is confined to peripheral nervous system (Inoue et al. 2008). Therefore, this study concludes that human accelerated divergence among enhancers makes up a strong case for studying brain evolution in present-day humans. It also highlights the significance of regulatory underpinnings in the genome in comparison with other members of genus Homo. Hence, by keeping brain specific regulatory sequence divergence in mind, we can also build basis for enhanced brain function and also regulatory regions’ contribution towards neurodegenerative complications like Parkinson’s and Alzheimer’s disease.
Supplementary Material
Supplementary data are available at Genome Biology and Evolution online.
Supplementary Material
Acknowledgment
This work was supported by Indigenous Ph.D. fellowship awarded to R.Z. by Higher Education Commission (HEC), Pakistan.
Literature Cited
- Barreiro LB, Laval G, Quach H, Patin E, Quintana-Murci L.. 2008. Natural selection has driven population differentiation in modern humans. Nat Genet. 403:340–345. [DOI] [PubMed] [Google Scholar]
- Beccari L, Conte I, Cisneros E, Bovolenta P.. 2012. Sox2-mediated differential activation of Six3.2 contributes to forebrain patterning. Development 1391:151–164. [DOI] [PubMed] [Google Scholar]
- Blake JA, et al. , 2017. Mouse Genome Database (MGD)-2017: community knowledge resource for the laboratory mouse. Nucleic Acids Res. 45(D1):D723–D729. [DOI] [PMC free article] [PubMed] [Google Scholar]
- Boyd JL, et al. , 2015. Human-chimpanzee differences in a FZD8 enhancer alter cell-cycle dynamics in the developing neocortex. Curr Biol. 256:772–779. [DOI] [PMC free article] [PubMed] [Google Scholar]
- Burbano HA, et al. , 2012. Analysis of human accelerated DNA regions using archaic hominin genomes. PLoS One 73:e32877. [DOI] [PMC free article] [PubMed] [Google Scholar]
- Cáceres M, et al. , 2003. Elevated gene expression levels distinguish human from non-human primate brains. Proc Natl Acad Sci U S A. 100:13030–13035. [DOI] [PMC free article] [PubMed] [Google Scholar]
- Cadzow M, et al. , 2014. A bioinformatics workflow for detecting signatures of selection in genomic data. Front Genet. 5:293. [DOI] [PMC free article] [PubMed] [Google Scholar]
- Choukrallah M-A, Song S, Rolink AG, Burger L, Matthias P.. 2015. Enhancer repertoires are reshaped independently of early priming and heterochromatin dynamics during B cell differentiation. Nat Commun. 61:8324. doi: 10.1038/ncomms9324 [DOI] [PMC free article] [PubMed] [Google Scholar]
- Chuang JH, Li H.. 2004. Functional bias and spatial organization of genes in mutational hot and cold regions in the human genome. PLoS Biol. 22:e29.. [DOI] [PMC free article] [PubMed] [Google Scholar]
- Consortium GP 2015. A global reference for human genetic variation. Nature 526:68–74. [DOI] [PMC free article] [PubMed] [Google Scholar]
- Danecek P, et al. , 2011. The variant call format and VCFtools. Bioinformatics 2715:2156–2158. [DOI] [PMC free article] [PubMed] [Google Scholar]
- Dorighi KM, et al. , 2017. Mll3 and Mll4 facilitate enhancer RNA synthesis and transcription from promoters independently of H3K4 monomethylation. Mol Cell 664: 568–576. [DOI] [PMC free article] [PubMed] [Google Scholar]
- Dunbar RI, Shultz S.. 2007. Understanding primate brain evolution. Philos Trans R Soc Lond B Biol Sci. 3621480:649–658. [DOI] [PMC free article] [PubMed] [Google Scholar]
- Enard W, et al. , 2002. Intra-and interspecific variation in primate gene expression patterns. Science 2965566:340–343. [DOI] [PubMed] [Google Scholar]
- Fay JC, Wu C-I.. 2000. Hitchhiking under positive Darwinian selection. Genetics 1553:1405–1413. [DOI] [PMC free article] [PubMed] [Google Scholar]
- Franchini LF, Pollard KS.. 2015. Can a few non‐coding mutations make a human brain?. BioEssays 3710:1054–1061. [DOI] [PMC free article] [PubMed] [Google Scholar]
- Gautier M, Vitalis R.. 2012. rehh: an R package to detect footprints of selection in genome-wide SNP data from haplotype structure. Bioinformatics 288:1176–1177. [DOI] [PubMed] [Google Scholar]
- Geschwind DH, Rakic P.. 2013. Cortical evolution: judge the brain by its cover. Neuron 803:633–647. [DOI] [PMC free article] [PubMed] [Google Scholar]
- Gu J, Gu X.. 2003. Induced gene expression in human brain after the split from chimpanzee. Trends Genet. 192:63–65. [DOI] [PubMed] [Google Scholar]
- Haygood R, Fedrigo O, Hanson B, Yokoyama K-D, Wray GA.. 2007. Promoter regions of many neural- and nutrition-related genes have experienced positive selection during human evolution. Nat Genet. 399:1140–1144. [DOI] [PubMed] [Google Scholar]
- Heckmann J, et al. , 2010. A functional SNP in the regulatory region of the decay-accelerating factor gene associates with extraocular muscle pareses in myasthenia gravis. Genes Immun. 111:1–10. [DOI] [PMC free article] [PubMed] [Google Scholar]
- Hubisz MJ, Pollard KS.. 2014. Exploring the genesis and functions of human accelerated regions sheds light on their role in human evolution. Curr Opin Genet Dev. 29:15–21. [DOI] [PubMed] [Google Scholar]
- Hussin J, Nadeau P, Lefebvre J-F, Labuda D.. 2010. Haplotype allelic classes for detecting ongoing positive selection. BMC Bioinformatics 111:65.. [DOI] [PMC free article] [PubMed] [Google Scholar]
- Hutton SR, Pevny LH.. 2011. SOX2 expression levels distinguish between neural progenitor populations of the developing dorsal telencephalon. Dev. Biol. 3521:40–47. [DOI] [PubMed] [Google Scholar]
- Inoue K-i, Shiga T, Ito Y.. 2008. Runx transcription factors in neuronal development. Neural Dev. 31:20.. [DOI] [PMC free article] [PubMed] [Google Scholar]
- Karki R, Pandya D, Elston RC, Ferlini C.. 2015. Defining “mutation” and “polymorphism” in the era of personal genomics. BMC Med Genomics 8:37.. [DOI] [PMC free article] [PubMed] [Google Scholar]
- Karolchik D, et al. , 2003. The UCSC genome browser database. Nucleic Acids Res. 311:51–54. [DOI] [PMC free article] [PubMed] [Google Scholar]
- Katoh K, Misawa K, Kuma K, Miyata T.. 2002. MAFFT: a novel method for rapid multiple sequence alignment based on fast Fourier transform. Nucleic Acids Res. 3014:3059–3066. [DOI] [PMC free article] [PubMed] [Google Scholar]
- Kent WJ. 2002. BLAT—the BLAST-like alignment tool. Genome Res. 124:656–664. [DOI] [PMC free article] [PubMed] [Google Scholar]
- Kvon EZ. 2015. Using transgenic reporter assays to functionally characterize enhancers in animals. Genomics 1063:185–192. [DOI] [PubMed] [Google Scholar]
- Maricic T, et al. , 2013. A recent evolutionary change affects a regulatory element in the human FOXP2 gene. Mol Biol Evol. 304:844–852. [DOI] [PubMed] [Google Scholar]
- Maston GA, Evans SK, Green MR.. 2006. Transcriptional regulatory elements in the human genome. Annu Rev Genomics Hum Genet. 7:29–59. [DOI] [PubMed] [Google Scholar]
- Matys V, et al. , 2006. TRANSFAC and its module TRANSCompel: transcriptional gene regulation in eukaryotes. Nucleic Acids Res. 3490001:D108–D110. [DOI] [PMC free article] [PubMed] [Google Scholar]
- Meyer M, et al. , 2012. A high-coverage genome sequence from an archaic Denisovan individual. Science 3386104:222–226. [DOI] [PMC free article] [PubMed] [Google Scholar]
- Nielsen R. 2005. Molecular signatures of natural selection. Annu Rev Genet. 39:197–218. [DOI] [PubMed] [Google Scholar]
- Prabhakar S, et al. , 2008. Human-specific gain of function in a developmental enhancer. Science 3215894:1346–1350. [DOI] [PMC free article] [PubMed] [Google Scholar]
- Prüfer K, et al. , 2014. The complete genome sequence of a Neanderthal from the Altai Mountains. Nature 5057481:43–49. [DOI] [PMC free article] [PubMed] [Google Scholar]
- Sabeti PC, et al. , 2002. Detecting recent positive selection in the human genome from haplotype structure. Nature 4196909:832–837. [DOI] [PubMed] [Google Scholar]
- Sabeti PC, et al. , 2007. Genome-wide detection and characterization of positive selection in human populations. Nature 4497164:913–918. [DOI] [PMC free article] [PubMed] [Google Scholar]
- Scheet P, Stephens M.. 2006. A fast and flexible statistical model for large-scale population genotype data: applications to inferring missing genotypes and haplotypic phase. Am J Hum Genet. 784:629–644. [DOI] [PMC free article] [PubMed] [Google Scholar]
- Sherry ST, et al. , 2001. dbSNP: the NCBI database of genetic variation. Nucleic Acids Res. 291:308–311. [DOI] [PMC free article] [PubMed] [Google Scholar]
- Spitz F, Furlong EEM.. 2012. Transcription factors: from enhancer binding to developmental control. Nat Rev Genet. 139:613–626. [DOI] [PubMed] [Google Scholar]
- Stifani S, Ma Q.. 2009. ‘Runxs and regulations’ of sensory and motor neuron subtype differentiation: implications for hematopoietic development. Blood Cells Mol Dis. 431:20–26. [DOI] [PMC free article] [PubMed] [Google Scholar]
- Storey JD, Tibshirani R.. 2003. Statistical significance for genomewide studies. Proc Natl Acad Sci U S A. 10016:9440–9445. [DOI] [PMC free article] [PubMed] [Google Scholar]
- Tekola-Ayele F, et al. , 2015. Novel genomic signals of recent selection in an Ethiopian population. Eur J Hum Genet. 238:1085–1092. [DOI] [PMC free article] [PubMed] [Google Scholar]
- Uhlén M, et al. , 2015. Tissue-based map of the human proteome. Science 3476220:1260419. [DOI] [PubMed] [Google Scholar]
- Visel A, Minovitsky S, Dubchak I, Pennacchio LA.. 2007. VISTA enhancer browser—a database of tissue-specific human enhancers. Nucleic Acids Res. 35(Database):D88–D92. [DOI] [PMC free article] [PubMed] [Google Scholar]
- Voight BF, Kudaravalli S, Wen X, Pritchard JK.. 2006. A map of recent positive selection in the human genome. PLoS Biol. 43:e72.. [DOI] [PMC free article] [PubMed] [Google Scholar]
- Yousaf A, Raza MS, Abbasi AA.. 2015. The evolution of bony vertebrate enhancers at odds with their coding sequence landscape. Genome Biol. Evol. 78:2333–2343. [DOI] [PMC free article] [PubMed] [Google Scholar]
- Zhang J, Nielsen R, Yang Z.. 2005. Evaluation of an improved branch-site likelihood method for detecting positive selection at the molecular level. Mol Biol Evol. 2212:2472–2479. [DOI] [PubMed] [Google Scholar]
Associated Data
This section collects any data citations, data availability statements, or supplementary materials included in this article.