

Abstract
Background and Purpose
The mineralocorticoid receptor (MR) contributes to fibrosis in various tissues, and MR antagonists, like eplerenone, are used to prevent fibrosis. The role of MR antagonists in hepatic fibrosis and cirrhosis is unknown. Here, we investigated the role of MRs and eplerenone in cirrhosis development.
Experimental Approach
Liver fibrosis (5 weeks) and cirrhosis, without (8 weeks) and with ascites (12 weeks), were induced by CCl4 in rats and comprehensively analysed. The effect of eplerenone on the development of cirrhosis with ascites was assessed. MR expression, cellular and subcellular distribution and impact of hypoxia were investigated in vivo and ex vivo. Primary rat hepatocytes and cell lines were used to investigate MR trafficking and transcriptional activity mechanistically.
Key Results
In cirrhosis with ascites, MR mRNA and protein expressions were reduced in hepatocytes of hypoxic areas. While in normoxic areas MRs were mainly cytosolic, the remaining MRs in hypoxic areas were mainly localized in the nuclei, indicating activation followed by translocation and degradation. Accordingly, eplerenone treatment prevented nuclear MR translocation and the worsening of cirrhosis. Exposing hepatocytes ex vivo to hypoxia induced nuclear MR translocation and enhanced transcriptional MR activity at response elements of the NF‐κB pathway.
Conclusions and Implications
We showed for the first time that hypoxia leads to a pathogenetic ligand‐independent activation of hepatic MRs during cirrhosis resulting in their nuclear translocation and transcriptional activation of the NF‐κB pathway. Treatment with eplerenone prevented the worsening of cirrhosis by blocking this ligand‐independent activation of the MR.
Abbreviations
- AP‐1
activator protein 1
- CA9
carbonic anhydrase 9
- CCl4
carbon tetrachloride
- ddPCR
droplet digital PCR
- GRE
glucocorticoid response element
- HGM
hepatocyte growth medium
- HIF1α
hypoxia‐inducible factor 1α
- HSC
hepatic stellate cells
- LSEC
liver sinusoidal endothelial cells
- MR
mineralocorticoid receptor
- NFAT
nuclear factor of activated T‐cells
- RAAS
renin–angiotensin–aldosterone system
- SEAP
secretory alkaline phosphatase
Introduction
At the last Baveno conference (Baveno VI) it was recommended that anti‐fibrotic strategies should be further explored to prevent decompensation in cirrhosis (de Franchis and Baveno VI Faculty, 2015). Among others, the renin–angiotensin–aldosterone system (RAAS) was identified as an area for further investigations (de Franchis and Baveno VI Faculty, 2015). This statement was based on previous studies showing that attenuation of the RAAS, especially the production of http://www.guidetopharmacology.org/GRAC/LigandDisplayForward?ligandId=2504, induced anti‐fibrotic effects (Bataller et al., 2005). The RAAS hormone system includes the hormones renin, angiotensin and http://www.guidetopharmacology.org/GRAC/LigandDisplayForward?ligandId=2872 and regulates blood pressure and fluid balance (Gekle et al., 2014). Generation of angiotensin II induces the secretion of aldosterone from the adrenal glands (Gekle et al., 2014). http://www.guidetopharmacology.org/GRAC/LigandDisplayForward?ligandId=2872, a steroid hormone, binds to its canonical receptor the http://www.guidetopharmacology.org/GRAC/ObjectDisplayForward?objectId=626 (MR). The MR, upon physiological activation, increases renal and enteric sodium and water reabsorption, enhances potassium secretion and contributes to the maintenance of extracellular volume and BP (Grossmann and Gekle, 2009; Gekle et al., 2014; Meinel et al., 2014). The MR is also expressed in cells of non‐epithelial tissue, for example, vascular cells, where it contributes to pathophysiological changes initiated by inflammation followed by fibrosis, hypertrophy and remodelling (Nakano et al., 2005). Interestingly, the MR has been shown to lead to enhanced ROS formation itself, especially in collaboration with vasoactive mediators like angiotensin II (Gekle et al., 2014). Furthermore, many of its pathological effects require or are aggravated by oxidative stress (Gekle et al., 2014) and are at least partially independent of its classical ligand aldosterone (Grossmann and Gekle, 2012).
Until now, not much attention has been given to the possible role of MR in cirrhosis, although the MR is expressed in the liver (Pizarro et al., 2015; Paillard et al., 1980), and the RAAS in cirrhosis is dysregulated (Kuiper et al., 2008). In cirrhosis, portal hypertension leads to splanchnic and systemic vasodilatation and subsequent arterial hypotension inducing a compensatory activation of the RAAS with increased levels of renin, angiotensin II and aldosterone in blood plasma and ascites (Kuiper et al., 2008; Tandon et al., 2010). However, the hepatic expression of the MR and possible changes during liver fibrosis or cirrhosis have not been determined sufficiently. The blockade of the angiotensin receptor attenuates fibrosis development in experimental models of chronic liver injury (Jonsson et al., 2001; Croquet et al., 2002; Moreno et al., 2010). Based on these studies, it has been proposed that the blockade of the RAAS could be effective in preventing fibrosis progression in patients with chronic liver diseases. At present, RAAS inhibitors are widely used in patients with predisposing conditions to prevent the development of cardiac and renal fibrosis, but no treatment in liver fibrosis is established (Pitt, 2004). Data from small animal studies suggest that administration of MR blockers prevents the progression of fibrosis while administration of aldosterone supported the development of fibrosis (Matono et al., 2010; Queisser et al., 2014). At the moment, the impact of MR on decompensation is cirrhosis is unknown. Therefore, to get a better understanding of the underlying mechanism, an investigation of the receptor involved, that is, MR, is needed.
Consequently, the aims of this study were to investigate the distribution of the MR in the different liver cell types and to characterize the changes in MR expression at different time points during the development of cirrhosis. As aldosterone levels are mainly raised during the progression of cirrhosis, the MR antagonist http://www.guidetopharmacology.org/GRAC/LigandDisplayForward?ligandId=2876 was given to rats with established cirrhosis, and further progression of the disease was investigated. Furthermore, to clarify the underlying mechanism of the involvement of MRs in the development of cirrhosis, cells were investigated under hypoxic conditions, and the changes in MR expression were measured.
Methods
Induction of cirrhosis by CCl4
All animal experiments were conducted in accordance with the directive 2010/63/EU and the German law (Tierschutzgesetz) and were ethically and legally approved by the governmental, local animal committee (42502‐2‐1123 MLU, Landesverwaltungsamt Sachsen‐Anhalt). Animal studies are reported in compliance with the ARRIVE guidelines (Kilkenny et al., 2010; McGrath and Lilley, 2015). Male Wistar rats (75–100 g at the beginning of the experiments) underwent inhalation exposure to carbon tetrachloride (CCl4) three times a week. http://www.guidetopharmacology.org/GRAC/LigandDisplayForward?ligandId=2804 (0.35 g·L−1) was added to the drinking water as described previously (Zipprich et al., 2008). Treatment was given for 5 weeks (fibrosis), 8 weeks (cirrhosis without ascites) or 12 weeks (cirrhosis with ascites). Livers or primary liver cells were isolated 7–10 days after the last dose of CCl4. Rats were maintained on a 12 h light/12 h dark cycle at 23°C in a specific pathogen‐free environment (FELASA guidelines). Rats had ad libitum access to water and standard rodent diet. If applicable, the rats were housed in groups of three in separate cages. Animal well‐being was controlled daily. If animals suffered any disturbance due to the induction of cirrhosis, the animal was taken out of the experiment and killed. At the end of the experiments, the animals were deeply anaesthetized with http://www.guidetopharmacology.org/GRAC/LigandDisplayForward?ligandId=4233e/http://www.guidetopharmacology.org/GRAC/LigandDisplayForward?ligandId=523 (100 + 5 mg·kg−1 i.p.) and were killed, while in deep narcosis, by exsanguination, and cells or organs were harvested as described previously (Friedman and Roll, 1987; Graupera et al., 2005). Age‐matched rats were used as a control group. Animals were randomly assigned to the experimental groups. For histomorphological evaluation, the samples were blinded.
Administration of eplerenone during the progression of cirrhosis
Eplerenone (Inspra, Pfizer Pharma PFE GmbH, Berlin, Germany) was given p.o. (100 mg·kg−1 bw) once per day dissolved in 5 g hazelnut spread (Youcef et al., 2016; Fujihara et al., 2017; Yan et al., 2017). Control animals were treated similarly with 5 g hazelnut spread. Treatment was started for both groups after 8 weeks of CCl4 inhalation (established cirrhosis without ascites) and was continued until 12 weeks of CCl4 inhalation (cirrhosis with ascites). Tissue collection was performed 7–10 days after the last dose of CCl4. A visual evaluation of the liver surface, including shunts (0–3 points) and ascites (0–3 points), was performed, and liver weight, spleen weight and heart weight were measured.
Isolation of liver cells
Hepatocytes were isolated by in situ collagenase perfusion via the portal vein (Graupera et al., 2005). Briefly, livers were digested with 0.7 mg·mL−1 collagenase and 15 mM HEPES (Serva, Heidelberg, Germany). Parenchymal hepatocytes were collected in Krebs buffer, which included 20 mM HEPES, 0.4% BSA and 0.005% DNase, and then centrifuged (50× g, 5 min). The pellet, containing the hepatocytes, was resuspended in TRIzol (Qiagen, Hilden, Germany) for RNA isolation or protein lysis buffer (RIPA) for protein isolation.
Primary hepatic stellate cells (HSC) and liver sinusoidal endothelial cells (LSEC) were isolated by in situ collagenase perfusion of the liver including pronase and DNase (Roche, Mannheim, Germany) as described before (Friedman and Roll, 1987). Cells (HSC and LSEC) were collected in TRIzol for RNA isolation or protein lysis buffer (RIPA) for protein isolation.
Histology and immunohistochemistry
Rat livers were fixed in formalin (Histofix Roth, Karlsruhe, Germany) and processed routinely for haematoxylin–eosin or Sirius Red staining. Sections for immunohistochemistry of MR and carbonic anhydrase 9 (CA9) were incubated with primary monoclonal antibodies against MR (1:100 dilution) (Gomez‐Sanchez et al., 2011) and CA9 (1:50, NB 100‐417; Novus, Wiesbaden, Germany). The Sirius Red stained areas were calculated as percentage of total area by ImageJ software.
Western blot analysis
The following antibodies were used: anti‐MR (mouse monoclonal, rMR 1‐18 6G1) (Gomez‐Sanchez et al., 2011), anti‐http://www.guidetopharmacology.org/GRAC/ObjectDisplayForward?objectId=625 (GR) (H‐300, sc‐8992; Santa Cruz Biotechnology, Inc., Dallas, TX, USA), anti‐ß‐actin (mouse monoclonal AB, MAB1501; Millipore, Temecula, CA, USA), anti‐vinculin (monoclonal rabbit, EPR8185; Abcam, Cambridge, UK), anti‐mouse (IgG‐HRP, 7076P2, horse origin; Cell Signaling Technology, Boston, MA, USA), anti‐rabbit (IgG‐HRP, 7074P2, goat origin; Cell Signaling Technology). Proteins were detected using Western blot detection reagent (WesternBright ECL; Advansta, Menlo Park, CA, USA) in a Fusion‐Fx‐7 imager and quantified with the Bio1D‐software (Peqlab, Erlangen, Germany).
Cell culture and treatment
Rat hepatoma cells (MH1C1) were cultured in DMEM supplemented with 10% FCS at 37°C with 5% CO2. Hepatocytes were cultured in hepatocyte growth medium (HGM) and 1% P/S at 37°C with 5% CO2 (Aurich et al., 2005). Cells were incubated at 37°C with 5% CO2 under normoxic (10% O2) or hypoxic (cell line: 0.1% O2; primary cells: 1% O2) conditions for 24 h. Afterwards, cells were harvested with either TRIzol (Qiagen) or RIPA buffer.
Quantitative PCR
Total RNA was isolated from MH1C1 cells, liver, hepatocytes, HSC or LSEC using a standard protocol for TRIzol isolation. One microgram of RNA was subjected to reverse transcription with SuperScript II reverse transcriptase (Invitrogen, Carlsbad, CA, USA) and analysed by quantitative RT‐PCR using the Platinum SYBR Green qPCR Supermix (Invitrogen). To determine the different expression of genes, 1 μL cDNA was used in real‐time RT‐PCR (CFX96 Touch Real‐Time PCR Detection System; Bio‐Rad Laboratories GmbH, Munich, Germany, or 7900HT Fast Real‐time PCR system, Applied Biosystems, via Thermo Fisher Scientific, Karlsruhe, Germany). After initial denaturation at 95°C for 10 min, cDNA was amplified by 40 cycles of 95°C for 15 s, 60°C for 30 s, 72°C for 20 s, followed by 72°C for 5 min to allow complete extension. Gene expression was normalized to the expression levels of eukaryotic 18S rRNA or GAPDH and to the control group according to the −ddCt method in order to control for varying RNA or cell contents.
For analysing the MR with droplet digital PCR™ (ddPCR™; Bio‐Rad Laboratories GmbH), a commercial primer pair (Rn00565562_m1; Thermo Fisher, Waltham, CA, USA) was used. To determine the absolute amount of RNA, ddPCR was performed using the QX200 system of Bio‐Rad Laboratories GmbH. cDNA was prepared as described above and used in ddPCR under the following conditions: 95°C for 10 min followed by 40 cycles of 95°C for 30 s and 60°C for 1 min, with ramp rates of 2°C·s−1.
Determination of plasma aldosterone levels
Blood plasma samples were collected from the caudal vena cava. Aldosterone plasma concentration was determined, using an Aldosterone EIA Kit (Enzo Life Science, Lörrach, Germany), according to the manufacturer's instructions. Serum sodium and potassium concentrations were determined using a Fuji DRI‐CHEM system (scil animal care company, Viernheim, Germany).
Reporter gene assays
HEK‐293 cells, which do not express detectable MRs (Grossmann et al., 2005) or 11‐β hydroxysteroid dehydrogenase 2 (Odermatt et al., 2001), were acquired from American Type Culture Collection (Rockville, MD, USA) and cultivated in DMEM/Ham's F‐12 medium supplemented with 10% FCS at 37°C with 5% CO2 as described previously (Krug et al., 2003). Prior to the experiments, cells were made quiescent by incubation in medium without serum or supplements for at least 24 h. For the experiments presented here, cells were cultivated in 24‐well plates (Becton Dickinson GmbH, Heidelberg, Germany). Transfection of HEK‐293 cells was performed as described previously (Krug et al., 2003) with the Qiagen PolyFect reagent (Qiagen), according to the manufacturer's instructions. Transactivation of MRs was assessed by the Mercury Pathway Profiling reporter gene assay system from Clontech Inc. (Saint‐Germain‐en‐Laye, France) using secretory alkaline phosphatase (SEAP) as a reporter, essentially as described earlier (Pfau et al., 2007). In brief, HEK cells were cotransfected with positive glucocorticoid response element (pGRE)‐SEAP, positive nuclear factor of activated T‐cells (pNFAT)‐SEAP, positive activator protein 1 (pAP‐1)‐SEAP or positive NF‐κB (pNF‐κB)‐SEAP and a MR construct, or empty vectors as indicated. SEAP activity in the media was determined with the AttoPhos System from Promega (Mannheim, Germany) and normalized to the transfection control (pcDNA3.1‐LacZ; Invitrogen). Twenty‐four hours after transfection, cells were submitted to either normoxic (20%) or hypoxic (1%) conditions for 24 h with or without supplementation with 10 nM aldosterone.
Statistical analysis
Data are presented as mean ± SEM. Student's unpaired t‐test, chi‐squared test or one‐way ANOVA followed by post hoc Fisher test with Bonferroni correction were used to detect differences between the groups; P values <0.05 were considered significant. Post hoc tests were run only if P < 0.05 and no variance inhomogeneity was observed. Statistical analyses were performed using IBM SPSS Statistics V20 (IBM Deutschland GmbH, Ehningen, Germany) and Prism V6 (GraphPad Software, La Jolla, CA, USA).
The data and statistical analysis comply with the recommendations on experimental design and analysis in pharmacology (Curtis et al., 2015).
Materials
If not stated otherwise, all substances were purchased from Sigma‐Aldrich, Steinheim, Germany.
Nomenclature of targets and ligands
Key protein targets and ligands in this article are hyperlinked to corresponding entries in http://www.guidetopharmacology.org, the common portal for data from the IUPHAR/BPS Guide to PHARMACOLOGY(Harding et al., 2018), and are permanently archived in the Concise Guide to PHARMACOLOGY 2017/18 (Alexander et al., 2017)
Results
Degree of liver fibrosis and plasma aldosterone concentration
Treatment with CCl4 induced fibrosis (5 weeks) and cirrhosis with the absence (8 weeks) and the presence of ascites (12 weeks) with an increased amount of fibrotic tissue (Supporting Information Figure S1 and Table 1).
Table 1.
Liver Sirius Red (fibrosis) staining and blood plasma aldosterone and electrolyte levels in control rats and rats with fibrosis, cirrhosis without ascites and cirrhosis with ascites
| Parameter | Control | Fibrosis | Cirrhosis without ascites | Cirrhosis with ascites |
|---|---|---|---|---|
| Sirius Red staining (% total area) | 0.53 ± 0.2 | 5.08 ± 1.0* | 6.64 ± 1.4* | 29.52 ± 4.4* |
| Plasma aldosterone (pg·mL−1) | 483 ± 73 | 762 ± 88* | 756 ± 99* | 728 ± 110* |
| Plasma chloride (mM) | 96.3 ± 3.0 | 95.0 ± 1.4 | 99.8 ± 2.7 | 98.8 ± 1.7 |
| Plasma sodium (mM) | 143.5 ± 1.2 | 144.3 ± 0.3 | 146.4 ± 2.3 | 147.3 ± 2.5 |
| Plasma potassium (mM) | 6.9 ± 0.1 | 7.6 ± 0.8 | 8.9 ± 0.7 | 12.4 ± 1.7* |
| Sodium/potassium quotient | 21.0 ± 0.5 | 19.6 ± 1.8 | 16.9 ± 1.3 | 13.1 ± 1.8* |
P < 0.05 versus control, n = 11 animals per group (control, fibrosis and cirrhosis without ascites); n = 6 animals (cirrhosis with ascites).
Blood plasma aldosterone levels increased significantly already during the first 5 weeks and remained stable thereafter for 8 and 12 weeks of CCl4 treatment (Table 1). Serum sodium and potassium levels were unchanged despite the increased levels of aldosterone after 5 and 8 weeks of CCl4 treatment. After 12 weeks of treatment, retention of potassium was observed, suggesting that kidneys had become refractory to the action of aldosterone, resulting in reduced secretion of potassium in the collecting ducts.
MR mRNA and protein are mainly expressed in hepatocytes
In order to determine the absolute number of MR mRNA copies per total μg RNA, the ddPCR method was applied to liver, hepatocytes, HSC and LSEC from control animals. Hepatocytes express 10 times more MR mRNA compared with HSC and LSEC (Figure 1A). These data were confirmed at the protein level by Western blot analysis and immunohistochemistry (Figure 1B, C).
Figure 1.
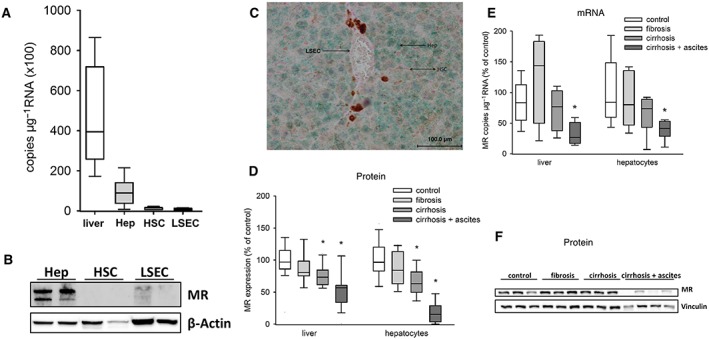
Expression of MRs in primary hepatocytes (Hep), primary HSC and primary sinusoidal endothelial cells and MR expression in cirrhosis. (A) In normal livers (n = 5) and liver cells of normal rats (n = 6 animals per group), the copy number of MR mRNA μg−1 RNA was determined by ddPCR. (B) Western blot analysis of the MR in normal livers and isolated liver cells of normal rats. (C) Immunohistochemistry of a normal liver showing the distribution of the MR (green). (D) Western blot analysis of whole liver lysates and isolated hepatocytes from control (liver/hepatocytes: n = 8), fibrotic (5 weeks; liver: n = 6; hepatocytes: n = 8), cirrhotic without ascites (8 weeks; liver/hepatocytes: n = 8) and cirrhotic with ascites (12 weeks; liver/hepatocytes: n = 8) rats. The amount of MR protein in livers and hepatocytes related to the housekeeping protein vinculin is shown. (E) Relative mRNA quantification of the MR in liver and primary hepatocytes (n = 8 animals per group) at different stages of liver cirrhosis. (F) A representative Western blot against MR of primary hepatocytes. * P < 0.05 versus control.
Protein and mRNA expressions of MRs and GRs during the development of cirrhosis
During the development of cirrhosis, MR protein amount in hepatocytes and whole liver homogenate was significantly decreased in stages with and without ascites (8 and 12 weeks of CCl4 treatment) compared with control (Figure 1D, F). Immunohistochemistry confirmed these results (Figure 2A, B). Analysis of MR mRNA expression revealed a significant reduction only in the advanced stage with ascites (Figure 1E). Furthermore, the degree of mRNA reduction (approximately −50%) was smaller as compared with the degree of protein reduction (approximately −80%). These differences indicate that transcriptional and posttranscriptional mechanisms contribute to MR loss in hepatocytes. A posttranscriptional reduction in MR protein is usually the result of MR activation, nuclear translocation and subsequent degradation. In order to gain further evidence for MR activation, we analysed its subcellular distribution in hepatocytes. In control animals, MR was detected in the nucleus of only 3.9 ± 1.2% (n = 9) of the non‐hypoxic hepatocytes. In animals suffering from cirrhosis with ascites, the MR was detected in the nucleus of 30.5 ± 8.9% (n = 5, P < 0.05 vs. control). Because nuclear translocation is the best surrogate marker for MR activation, these data confirm our hypothesis of MR activation in late‐stage cirrhosis, followed by its degradation.
Figure 2.
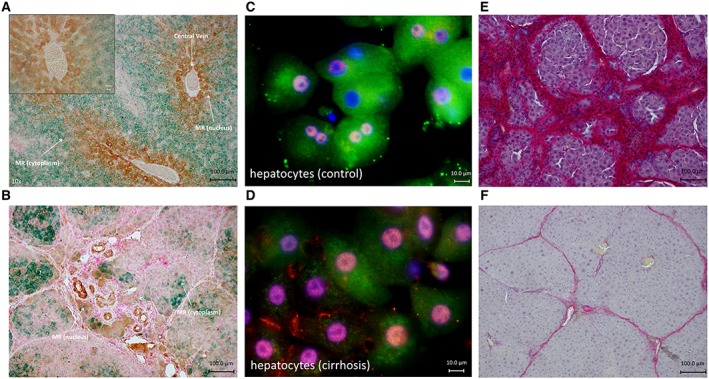
Immunohistochemistry against MR and markers for hypoxia either CA9 or HIF1α. Sirius Red staining in cirrhotic animals without and with eplerenone treatment. (A) Immunohistochemistry of livers of control animals showing increased amount of CA9‐positive cells (brown) around the central vein showing areas with less oxygen. Expression of MR (green) was higher, and MR was located in the cytoplasm in CA9‐negative cells. In CA9‐positive cells, the MR was located mainly in the nucleus. (B) Immunohistochemistry of cirrhotic livers with ascites (12 weeks of CCl4 administration) showing a reduced amount of MR (green) compared with control. MR (green) was located in the nucleus, or no MR was detected in CA9‐positive cells. In CA9‐negative cells, MR was located in the cytoplasm or the nucleus. (C) Immunofluorescence of primary control hepatocytes in vitro. MR (green) is mainly located in the cytoplasm. Note that there is almost no expression of HIF1α (red stain), a marker of hypoxia. (D) Immunofluorescence of primary cirrhotic hepatocytes in vitro. MR (green) is located in the cytoplasm and nucleus in cells with a low amount of red stain (HIF1α) (right side). In cells with a higher amount of HIF1α, MR is located in the nucleus (left side). Nuclei are stained in blue (DAPI). (E and F) Animals with cirrhosis (8 weeks of CCl4 inhalation) were treated with and without eplerenone, and inhalation with CCl4 was continued until week 12. (E) Sirius Red staining of a cirrhotic liver without eplerenone treatment. (F) Sirius Red staining of a cirrhotic liver with eplerenone treatment.
We also analysed the expression of the GR, the nearest relative to the MR. GR revealed no change in expression during cirrhosis with ascites (Supporting Information Figure S2). The decrease in MRs was detectable only in liver tissue. We did not observe any differences in MR mRNA or protein in renal or heart tissue from cirrhotic compared with control animals (data not shown).
Eplerenone attenuated the progression of cirrhosis
In order to test the relevance of MR activation during cirrhosis, we investigated the consequences of MR inhibition in animals with established cirrhosis. If the MR and its activation play a relevant pathogenetic role during the progression to cirrhosis with ascites, blocking of the MR by eplerenone should influence the course of the disease. Consequently, we started to feed the rats daily with eplerenone after the development of cirrhosis (8 weeks) and prolonged induction of cirrhosis to 12 weeks. We found a marked attenuation of fibrosis and progression of the disease. Visual evaluation of the liver surface showed significant less nodules, less shunts and less ascites in the eplerenone‐treated group compared with cirrhotic animals without eplerenone treatment (Table 2). Quantification of fibrosis using Sirius Red staining revealed significantly less fibrosis in animals treated with eplerenone (Table 2 and Figure 2E, F). Furthermore, in treated animals, the liver weight was significantly higher, and the spleen weight and the heart weight were significantly lower compared with the non‐treated group (Table 2).
Table 2.
Sirius Red (fibrosis) staining, liver weight, spleen weight, heart weight, visual evaluation of cirrhosis and amount of ascites from eplerenone‐treated and untreated cirrhotic rats
| Untreated cirrhosis | Eplerenone‐treated cirrhosis | P | |
|---|---|---|---|
| Sirius Red staining (% total area) | 26.7 ± 2.5 | 7.1 ± 1.5 | <0.05 |
| Liver weight (g) | 7.8 ± 1.34 | 12.2 ± 0.13 | <0.05 |
| Spleen weight (g) | 1.66 ± 0.24 | 0.77 ± 0.02 | <0.05 |
| Heart weight (g) | 1.28 ± 0.05 | 1.03 ± 0.07 | <0.05 |
| Visual evaluation of cirrhosis (points) | 3.0 ± 0.32 | 0.5 ± 0.39 | <0.05 |
| Ascites (grade) | 3.0 ± 0.0 | 1.2 ± 0.56 | <0.05 |
Treatment with eplerenone or treatment with solvent (untreated rats) was started in rats with established cirrhosis (after 8 weeks of CCl4 inhalation), and inhalation of CCl4 continued until 12 weeks. n = 5 per group.
Mechanisms involved in the decreased MR expression and nuclear distribution of the MR and the effect of eplerenone treatment
To further evaluate if our proposed mechanism of nuclear shuttling and increased transcriptional activity of the MR is a relevant mechanism in the pathological setting of cirrhosis, we evaluated the distribution of the MR in non‐hypoxic and hypoxic areas of the liver (Figure 2A, B). Having in mind the differences of oxygen partial pressure in the normal liver, our data show that indeed CA9 staining (hypoxic areas) is increased in the normal liver in close proximity of the central vein. In cells negative for CA9 (non‐hypoxic areas), the MR was located mainly in the cytoplasm, indicating its inactive state (Figures 2A and 3C). In cells stained positive for CA9, the MR is mainly located in the nucleus, indicating its activation (Figures 2A and 3C). Similar findings with higher nuclear localization of the MR in hypoxic areas were obtained when cirrhotic livers were investigated (Figures 2B and 3C). To confirm these results, we performed co‐staining using MR and HIF1α (another marker for hypoxia) in primary hepatocytes from rats with or without cirrhosis. This staining confirmed that MR expression is reduced in hepatocytes of cirrhotic rats when HIF1α was increased (Figure 2C, D). These findings lead to the hypothesis that the MR in hepatocytes is activated by hypoxia independently of changes in aldosterone concentration. Concentration of aldosterone was significantly increased in fibrosis (5 weeks CCl4; Table 1), while the changes in MR expression were significant in cirrhosis with ascites (12 weeks CCl4; Figure 1D–F). When cirrhotic animals were treated with eplerenone, the fraction of nuclear MR was decreased significantly (P < 0.05; Figure 3A–C), strongly supporting our hypothesis of MR activation during hepatic cirrhosis.
Figure 3.
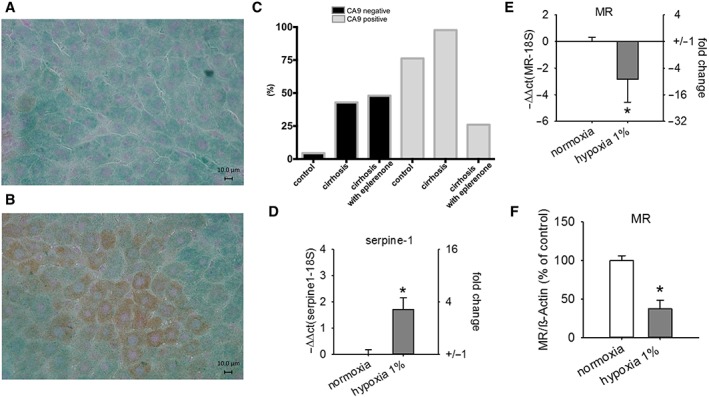
Distribution of the MR in non‐hypoxic and hypoxic areas of the liver in normal, untreated cirrhotic and eplerenone‐treated animals. MR expression in primary hepatocytes under hypoxic conditions. Animals with cirrhosis (8 weeks of CCl4 inhalation) were treated with and without eplerenone, and inhalation with CCl4 was continued until week 12. (A and B) Immunohistochemistry of cirrhotic livers with treatment of eplerenone illustrating the distribution of the MR (green) in non‐hypoxic (CA9‐negative staining; A) and hypoxic (CA9 staining, brown; B) areas. (C) Relative MR localization in the nucleus in CA9‐negative (non‐hypoxic) and CA9‐positive (hypoxic) areas of normal livers (control; n = 9; P < 0.05), cirrhotic livers without treatment with eplerenone (cirrhosis; n = 5; P < 0.05) and cirrhotic livers with treatment of eplerenone (n = 5; P < 0.05; chi‐squared test). (D–F) Primary hepatocytes were exposed to hypoxia (1% O2). (D) Relative mRNA quantification of serpine‐1 in normoxia and hypoxia. (E) Relative mRNA quantification of MR in normoxia and hypoxia. (F) Amount of MR protein in hepatocytes related to the housekeeping protein in normoxia and hypoxia. * P < 0.05 versus control normoxia; n = 8 per group.
Besides activation of the MR, hypoxia can also lead to reduced MR mRNA expression (Cuffe et al., 2014), which we observed in livers of animals with advanced cirrhosis (Figure 1E). To support this hypothesis, we performed additional analyses comparing the changes in CA9 expression in different disease stages with changes in MR mRNA expression. Cirrhotic livers show enhanced mRNA levels of CA9 (8 weeks CCl4: +40 ± 10%, P = 0.03; 12 weeks CCl4: +45 ± 20%, P = 0.058) that were associated with lower levels of MR mRNA (8 weeks CCl4: −68 ± 10%, P = 0.03; 12 weeks CCl4: −58 ± 15%, P = 0.07). By contrast, fibrotic livers (5 weeks CCl4) did not show an increase in mRNA levels of CA9 (+20 ± 10%, P = 0.17) or a decrease in MR mRNA levels (+5 ± 20%, P = 0.45). Additionally, we were able to demonstrate that in isolated rat hepatocytes, the expression of CA9 is increased in cirrhotic but not in fibrotic livers (5 weeks CCl4: +35 ± 10%; 8 weeks CCl4: +60 ± 10%; and 12 weeks CCl4: +95 ± 45%), indicating that indeed the increase in hypoxia and not increase in aldosterone concentration in hepatocytes precedes the decrease in MRs (Cuffe et al., 2014).
Investigation of the mechanisms involved in altered MR distribution and expression ex vivo
To test the hypothesis of hypoxia‐induced MR activation further, we incubated primary hepatocytes from healthy livers or a hepatoma cell line (MH1C1) under hypoxic conditions. All experiments were carried out in tissue culture media without the supplementation of serum, that is, without aldosterone. To confirm that our experimental conditions with hypoxia simulate the in vivo conditions, we measured the expression of the fibrotic marker serpine‐1 (increased in cirrhotic hepatocytes, data not shown). Expression of serpine‐1 was increased under hypoxia (Figure 3D and Supporting Information Figure S3A).
Under hypoxic conditions, mRNA and protein levels of MR decreased in primary hepatocytes (Figure 3E, F). In order to confirm the effect of hypoxia in a second model, we performed similar experiments also in MH1C1 cells. Hypoxia decreased MR expression at both the mRNA and protein levels (Supporting Information Figure S3B, C).
Next, we determined subcellular MR distribution under normoxic and hypoxic conditions. As shown in Table 3, hypoxia leads to nuclear MR trafficking also in cultured cells. Interestingly, this nuclear shuttling is, due to the hormone free conditions in our experiment, a ligand‐independent effect. Administration of aldosterone to the experimental setting revealed the expected shuttling from the MR in the nucleus in almost all cells (Table 3).
Table 3.
Cytoplasm to nucleus ratio of MR localization under normal and hypoxic conditions in the presence or absence of aldosterone in MH1C1 cells
| Normoxia | Hypoxia | |
|---|---|---|
| Absence of aldosterone* | ||
| Cytoplasm only (%) | 80 | 44 |
| Nucleus (%) | 20 | 56 |
| Sum (%) | 100 | 100 |
| Presence of aldosterone | ||
| Cytoplasm only (%) | 2 | 5 |
| Nucleus (%) | 98 | 95 |
| Sum (%) | 100 | 100 |
There is a higher amount of the MR in the nucleus under hypoxia in the absence of aldosterone. Six experiments per condition were performed (n = 6 per group), and the minimum number of cells counted per experiment was n = 67.
Chi‐squared test P < 0.05.
Investigation of the pathological MR activation ex vivo
To finally investigate whether hypoxia also affects transcriptional MR activity, we performed reporter gene assays for four transcriptional response elements supposed to be activated by the MR (Ruhs et al., 2012) and potentially relevant for hepatic cirrhosis. In order to investigate the transcriptional activity with minimal confounding factors, like receptor degradation, under controlled conditions, we employed HEK293 cells with transient expression of MR and the respective reporter. The data show a decrease of basal canonical GRE reporter gene activity under hypoxic conditions, whereas the basal activity of reporters for activator protein 1 (AP‐1), NF‐κB and NFAT was not altered significantly by hypoxia (Figure 4A). Thus, already under basal conditions, hypoxia induced a qualitative shift in the control of gene expression. To separate the effect of hypoxia on MR from GR, both being able to act on GRE elements, we applied aldosterone at concentration (10 nM) that activate only MR. Under hypoxic conditions, MR activity at the GRE element is significantly reduced, while the NF‐κB reporter gene activity is significantly enhanced. NFAT and AP‐1 reporters were not affected significantly by hypoxia (Figure 4B). Thus, hypoxia indeed induces a qualitative shift of transcriptional MR activity towards proinflammatory regulation of gene expression.
Figure 4.
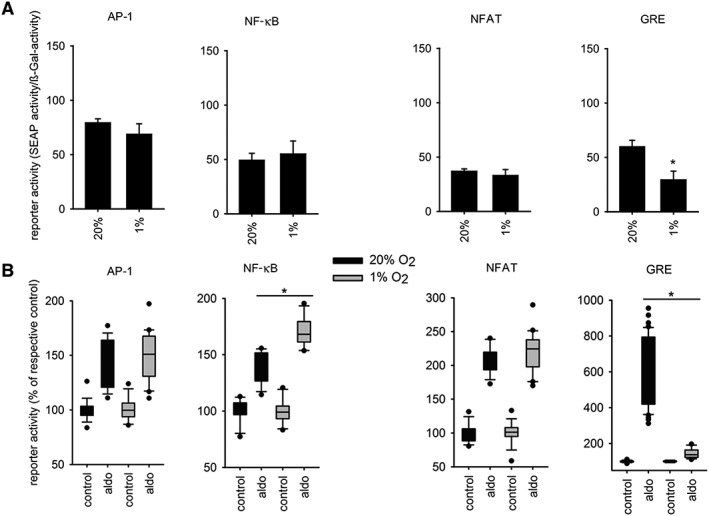
Hypoxia affects transcriptional MR activity. SEAP activity of HEK cells that were contransfected with positive GRE‐SEAP, positive NFAT‐SEAP, positive AP‐1‐SEAP or positive NF‐κB‐SEAP and MR construct, or empty vector. Twenty‐four hours after transfection, cells were submitted to normoxia (20% O2) or hypoxia (1% O2) (A) and normoxia (20% O2, dark) or hypoxia (1% O2) with or without supplementation with aldosterone (aldo) (B). AP‐1 (n = 13), NF‐κB (n = 12), NFAT (n = 8) and GRE (n = 6), * P < 0.05.
Discussion
Our main findings in this study are that (i) MR blockade by eplerenone prevents the progression from cirrhosis to decompensated cirrhosis (with ascites), (ii) its subcellular distribution and expression are decreased in advanced cirrhosis as a result of pathogenetic relevant MR activation and (iii) hypoxia enhanced transcriptional MR activity at response elements of the NF‐κB pathway.
We propose that hepatocyte MR suffers a hypoxia‐induced pathological activation, independent of alterations in ligand abundance, during cirrhosis when the degree to hypoxia increases. This activation leads to nuclear MR translocation and the activation of pathological gene expression programmes, most probably driven by NF‐κB‐responsive promoters. Since activation of MR results in its ubiquitylation and degradation, the protein amount is reduced in decompensated cirrhosis. The decrease in MR mRNA is most probably an additional transcriptional mechanism induced by hypoxia (Cuffe et al., 2014). We could confirm these mechanisms in livers, in primary hepatocytes and in a hepatocyte‐derived cell line.
In cirrhosis with ascites, we found a decrease of MR expression on mRNA and protein levels in hepatocytes compared with control. The loss of MR in hepatocytes during the development of cirrhosis also explains the reduction in the whole liver tissue. This altered abundance is specific for the MR, as neither the expression of the glucocorticoid receptor, the nearest relative of the MR (Baker et al., 2013), nor the expression of angiotensinogen, like the MR part of the RAAS and also produced in hepatocytes (Te Riet et al., 2015), is reduced in their abundance. To our knowledge, this is the first report on changes in MR expression during the development of cirrhosis. No difference in MR mRNA in hearts and kidneys between control and cirrhotic rats could be observed indicating that the decreased MR mRNA amount is specific for liver tissue.
To proof the pathogenetic relevance of MR activation for diseases progression, we treated animals at the stage of compensated cirrhosis with the clinically used MR antagonist eplerenone. This treatment almost completely prevented pathological MR activation together with the progression to decompensated cirrhosis, thereby documenting the importance of MR for cirrhosis progression per se, besides its role in extrahepatic symptoms.
Systemic levels of the MR ligand aldosterone are known to be increased in cirrhosis (Tandon et al., 2010). We could confirm these findings in our model. Additionally, we were able to demonstrate that the aldosterone levels already increase in earlier stages of the disease and stay elevated thereafter. This finding is in line with data from humans showing elevated aldosterone levels in earlier stages of the disease (early ascites) (Bernardi et al., 2015). Despite the maximum increase of plasma aldosterone at week 5, we observed the pathological MR activation only after week 8. These data support our conclusion that the pathological relevant MR activation is not induced by its canonical ligand but independent of alterations in aldosterone concentration.
The development of cirrhosis is a multifactorial process in which inflammation and hypoxia are two key events (Marrone et al., 2016). Taking into account our results with expression of fibrotic and inflammatory markers in hepatocytes and the high expression of MR in hepatocytes, we investigated these cells regarding the underlying mechanism for the decreased MR expression in cirrhosis. In order to carry this out, we performed two different experiments. First, we investigated the effect of hypoxia on primary hepatocytes. Since these cells are rather sensitive to hypoxic conditions, these experiments were performed with 1% of oxygen. In order to achieve lower oxygen content, resembling more closely the in vivo situation, we performed the same experiments in the MH1C1 cell line, which tolerate hypoxic conditions with 0.1% of oxygen. The results of both experiments were the same. Under hypoxia and in aldosterone‐free tissue culture medium, the expression of the MR is decreased. Therefore, our results revealed hypoxia as a key factor for the decreased expression of the MR in cirrhosis. We exclude that the reduced MR mRNA amount is due to a general reduction in gene transcription as neither 18S‐RNA nor vinculin and β‐actin protein were reduced under these conditions.
The MR exerts its effects classically as a transcription factor (Grossmann et al., 2012; Gekle et al., 2014). It dimerizes upon ligand binding and translocates into the nucleus binding to the DNA and thereby increasing gene transcription (Gekle et al., 2014). After activation, the MR becomes posttranscriptionally modified and is subsequently degraded (Galigniana et al., 2010; Grossmann et al., 2012). Therefore, we analysed the intracellular distribution of the MR in hepatocytes from rat livers with and without cirrhosis. We were able to demonstrate that the main amount of MR under hypoxic conditions was localized in the nucleus. In accordance with our findings in vitro, we could demonstrate ex vivo by immunohistochemistry that the nuclear localization of the MR is increased in hepatocytes under hypoxia. Furthermore, investigation of the transcriptional activity of the MR under hypoxic conditions revealed a decreased activity of the GRE but an increase of NF‐κB. Our data are in accordance with previous findings in a model of fatty liver disease and in hepatocellular carcinomas. In both studies, the expression of the MR was also decreased in hepatocytes and in HCC tumour tissue (Nie et al., 2015; Pizarro et al., 2015). We conclude that hypoxia induces activation of the MR, translocation into the nucleus, increased transcriptional activity and subsequent degradation. Regarding the hypoxia, we hypothesize that the reduced oxygen level in hepatocytes alters radical formation (shift to increased superoxide production), perhaps in addition with the altered inflammatory phenotype (Skott et al., 2006). The superoxide can react with nitrogen monoxide to peroxynitrite, a molecule known to cause ligand‐independent activation of the MR and increased transcriptional activity, presumably by posttranscriptional modifications of the MR (Ruhs et al., 2012).
Concomitant with our findings, anti‐fibrotic properties of MR antagonists in the liver were previously shown in small animal studies (Matono et al., 2010; Luo et al., 2012). However, the effect of the MR antagonist in these studies was investigated during the whole time of the development of cirrhosis, which is not the situation for treatment in humans. Therefore, we started the administration of the MR antagonist after the development of cirrhosis. The administration of the MR antagonist caused a marked attenuation of fibrosis, less ascites and less spleen weight. This attenuation of fibrosis was accompanied with decreased nuclear shuttling of the MR in hypoxic areas. In non‐hypoxic areas, this effect was not present indicating most likely an additional mechanism. Therefore, the contribution of the MR to the changes in gene expression observed in cirrhosis or liver fibrosis needs to be evaluated further. To date, we would hypothesize that the MR upon activation increases the transcription of proinflammatory genes (e.g. PAI‐1 or Serpina‐3; Gravez et al., 2013) and profibrotic genes (e.g. Col1a1 or Col3a1; Schreier et al., 2014).
To investigate the contribution of aldosterone–MR activation to cirrhosis, we analysed the distribution of MR in liver cells. ddPCR, Western blot and immunohistochemistry from normal livers revealed hepatocytes as the main MR expressing cells compared with hepatic stellate and sinusoidal endothelial cells. In fact, we found a 10 times higher expression of the MR in hepatocytes compared with HSC and LSEC. Interestingly, we did not find significant amounts of MR mRNA in HSC neither under normal conditions nor in cirrhotic livers. Recently, Pizarro et al. (2015) described an increase of MR expression in HSC in a model of fatty liver disease. This result seems to be contradictory to our findings. However, the two investigated models differ not only concerning the species used (mouse compared with rats). Pizarro et al. (2015) employed a non‐alcoholic steatohepatitis model that is mainly a model for liver inflammation. In our CCl4 model, the development of fibrosis and cirrhosis is based on hypoxia and oxidative stress (Moeller et al., 2015). This animal model is one of the best described animal models for cirrhosis. The model mimics cirrhosis due to toxic agents, that is, alcoholic cirrhosis, which is the main cause of cirrhosis worldwide. On the other hand, cirrhosis in our model develops in weeks that is not comparable with the time frame in humans, that is, years. However, other commonly used models, such as the bile duct ligation models, are not representative of the majority of causes of cirrhosis and develop cirrhosis even faster. Therefore, regarding animal models, the CCl4 model for liver cirrhosis is the most suitable model available in our opinion (Zipprich et al., 2008). Our finding that there were no significant amounts of MR in HSC are in accordance with previous results showing no expression of MR in primary HSC of rats (Rombouts et al., 2001).
In conclusion, administration of the MR antagonist eplerenone attenuates the further progression of cirrhosis by reducing the nuclear shuttling of the MR (Figure 5). These findings imply that the application of MR antagonists might have a beneficial effect in liver cirrhosis independent of the plasma aldosterone concentration and have especially benefit in compensated cirrhosis to avoid further progression of the disease. During the development of cirrhosis, the level of MRs in the liver is decreased. This decrease seems to be tissue‐specific and due to a ligand‐independent, hypoxia‐dependent activation of the MR, leading to their translocation to the nucleus, activation of the transcriptional factor NF‐κB and subsequent degradation.
Figure 5.
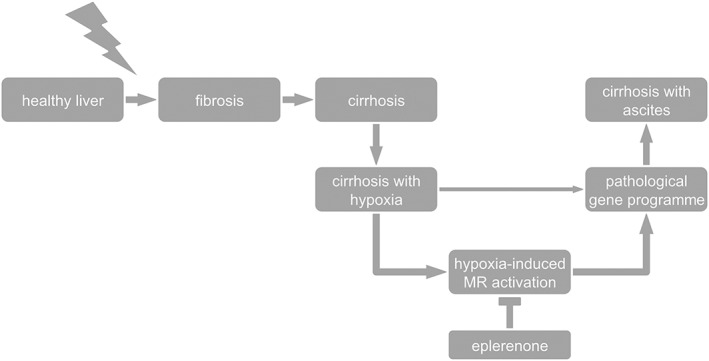
Proposed mechanism of the MR and effect of eplerenone on the development of cirrhosis from cirrhosis without ascites (cirrhosis) to cirrhosis with ascites. Hypoxia induces ligand‐independent MR activation with a shift in response element activation from mainly GRE to increased NF‐κB activation. Eplerenone blocks this hypoxia‐dependent activation and attenuates fibrosis and worsening to cirrhosis with ascites.
Author contributions
A.W. contributed in the acquisition of data, analysis and interpretation of data and drafting of the manuscript; S.H., S.P., S.M. and S.R. in the acquisition of data; M.G. in the study concept and design, critical revision of the manuscript for important intellectual content and obtained funding; and B.S. and A.Z. in the study concept and design, analysis and interpretation of data, drafting of the manuscript and obtained funding.
Conflict of interest
The authors declare no conflicts of interest.
Declaration of transparency and scientific rigour
This http://onlinelibrary.wiley.com/doi/10.1111/bph.13405/abstract acknowledges that this paper adheres to the principles for transparent reporting and scientific rigour of preclinical research recommended by funding agencies, publishers and other organisations engaged with supporting research.
Supporting information
Figure S1 Sirius Red stainings of livers from control, fibrotic, cirrhotic rats without ascites and cirrhotic rats with ascites. Sirius red stainings of livers from control, fibrotic (5 weeks of CCl4 administration), cirrhotic rats without ascites (8 weeks of CCl4 administration) and cirrhotic rats with ascites (12 weeks of CCl4 administration) showing the increase amount of fibrotic tissue from control to cirrhotic rats with ascites.
Figure S2 Protein expression of GR in liver and hepatocytes. Western blot analysis of the glucocorticoid receptor (GR) from livers and hepatocytes of controls and cirrhosis with ascitis (12 weeks of CCl4 administration). *P<0.05; n=6/group.
Figure S3 MR expression in hepatoma cells under hypoxic and inflammatory conditions. Hepatoma cells (MH1C1) exposed to hypoxia (0.1% O2). A: Relative mRNA quantification of serpine‐1. B: Relative mRNA quantification of mineralocorticoid receptor (MR). C: Amount of MR protein of hepatocytes related to the housekeeping protein ß‐actin. *P<0.05 vs. control normoxia; n=6/group.
Acknowledgement
This work was funded by the Wilhelm Roux Program of Medical Faculty of the Martin Luther University.
Schreier B., Wolf A., Hammer S., Pohl S., Mildenberger S., Rabe S., Gekle M., and Zipprich A. (2018) The selective mineralocorticoid receptor antagonist eplerenone prevents decompensation of the liver in cirrhosis, British Journal of Pharmacology, 175, 2956–2967, https://doi.org/10.1111/bph.14341.
Contributor Information
Barbara Schreier, Email: barbara.schreier@medizin.uni-halle.de.
Alexander Zipprich, Email: alexander.zipprich@medizin.uni-halle.de.
References
- Alexander SPH, Cidlowski JA, Kelly E, Marrion NV, Peters JA, Faccenda E et al (2017). The Concise Guide to PHARMACOLOGY 2017/18: Nuclear hormone receptors . Br J Pharmacol 174: S208–S224. [DOI] [PMC free article] [PubMed] [Google Scholar]
- Aurich H, Koenig S, Schneider C, Walldorf J, Krause P, Fleig WE et al (2005). Functional characterization of serum‐free cultured rat hepatocytes for downstream transplantation applications. Cell Transplant 14: 497–506. [DOI] [PubMed] [Google Scholar]
- Baker ME, Funder JW, Kattoula SR (2013). Evolution of hormone selectivity in glucocorticoid and mineralocorticoid receptors. J Steroid Biochem Mol Biol 137: 57–70. [DOI] [PubMed] [Google Scholar]
- Bataller R, Sancho‐bru P, Ginès P, Brenner DA (2005). Liver fibrogenesis: a new role for the renin–angiotensin system. Antioxid Redox Signal 7: 1346–1355. [DOI] [PubMed] [Google Scholar]
- Bernardi M, Moreau R, Angeli P, Schnabl B, Arroyo V (2015). Mechanisms of decompensation and organ failure in cirrhosis: from peripheral arterial vasodilation to systemic inflammation hypothesis. J Hepatol 63: 1272–1284. [DOI] [PubMed] [Google Scholar]
- Croquet V, Moal F, Veal N, Wang J, Oberti F, Roux J et al (2002). Hemodynamic and antifibrotic effects of losartan in rats with liver fibrosis and/or portal hypertension. J Hepatol 37: 773–780. [DOI] [PubMed] [Google Scholar]
- Cuffe JSM, Walton SL, Singh RR, Spiers JG, Bielefeldt‐Ohmann H, Wilkinson L et al (2014). Mid‐ to late term hypoxia in the mouse alters placental morphology, glucocorticoid regulatory pathways and nutrient transporters in a sex‐specific manner. J Physiol 592: 3127–3141. [DOI] [PMC free article] [PubMed] [Google Scholar]
- Curtis MJ, Bond RA, Spina D, Ahluwalia A, Alexander SPA, Giembycz MA et al (2015). Experimental design and analysis and their reporting: new guidance for publication in BJP. Br J Pharmacol 172: 3461–3471. [DOI] [PMC free article] [PubMed] [Google Scholar]
- de Franchis R, Baveno VI Faculty (2015). Expanding consensus in portal hypertension: report of the Baveno VI Consensus Workshop: stratifying risk and individualizing care for portal hypertension. J Hepatol 63: 743–752. [DOI] [PubMed] [Google Scholar]
- Friedman SL, Roll FJ (1987). Isolation and culture of hepatic lipocytes, Kupffer cells, and sinusoidal endothelial cells by density gradient centrifugation with Stractan. Anal Biochem 161: 207–218. [DOI] [PubMed] [Google Scholar]
- Fujihara CK, Kowala MC, Breyer MD, Sena CR, Rodrigues MV, Arias SCA et al (2017). A novel aldosterone antagonist limits renal injury in 5/6 nephrectomy. Sci Rep 7: 459. [DOI] [PMC free article] [PubMed] [Google Scholar]
- Galigniana MD, Erlejman AG, Monte M, Gomez‐Sanchez C, Piwien‐Pilipuk G (2010). The hsp90–FKBP52 complex links the mineralocorticoid receptor to motor proteins and persists bound to the receptor in early nuclear events. Mol Cell Biol 30: 1285–1298. [DOI] [PMC free article] [PubMed] [Google Scholar]
- Gekle M, Bretschneider M, Meinel S, Ruhs S, Grossmann C (2014). Rapid mineralocorticoid receptor trafficking. Steroids 81: 103–108. [DOI] [PubMed] [Google Scholar]
- Gomez‐Sanchez CE, Warden M, Gomez‐Sanchez MT, Hou X, Gomez‐Sanchez EP (2011). Diverse immunostaining patterns of mineralocorticoid receptor monoclonal antibodies. Steroids 76: 1541–1545. [DOI] [PMC free article] [PubMed] [Google Scholar]
- Graupera M, March S, Engel P, Rodés J, Bosch J, García-Pagán JC (2005). Sinusoidal endothelial COX‐1‐derived prostanoids modulate the hepatic vascular tone of cirrhotic rat livers. Am J Physiol Gastrointest Liver Physiol 288: G763–G770. [DOI] [PubMed] [Google Scholar]
- Gravez B, Tarjus A, Jimenez‐Canino R, El Moghrabi S, Messaoudi S, Alvarez de la Rosa D et al (2013). The diuretic torasemide does not prevent aldosterone‐mediated mineralocorticoid receptor activation in cardiomyocytes. PLoS ONE 8: e73737. [DOI] [PMC free article] [PubMed] [Google Scholar]
- Grossmann C, Gekle M (2009). New aspects of rapid aldosterone signaling. Mol Cell Endocrinol 308: 53–62. [DOI] [PubMed] [Google Scholar]
- Grossmann C, Gekle M (2012). Interaction between mineralocorticoid receptor and epidermal growth factor receptor signaling. Mol Cell Endocrinol 350: 235–241. [DOI] [PubMed] [Google Scholar]
- Grossmann C, Benesic A, Krug AW, Freudinger R, Mildenberger S, Gassner B et al (2005). Human mineralocorticoid receptor expression renders cells responsive for nongenotropic aldosterone actions. Mol Endocrinol 19: 1697–1710. [DOI] [PubMed] [Google Scholar]
- Grossmann C, Ruhs S, Langenbruch L, Mildenberger S, Strätz N, Schumann K et al (2012). Nuclear shuttling precedes dimerization in mineralocorticoid receptor signaling. Chem Biol 19: 742–751. [DOI] [PubMed] [Google Scholar]
- Harding SD, Sharman JL, Faccenda E, Southan C, Pawson AJ, Ireland S et al (2018). The IUPHAR/BPS Guide to PHARMACOLOGY in 2018: updates and expansion to encompass the new guide to IMMUNOPHARMACOLOGY . Nucleic Acids Res 46: D1091–d1106. [DOI] [PMC free article] [PubMed] [Google Scholar]
- Jonsson JR, Clouston AD, Ando Y, Kelemen LI, Horn MJ, Adamson MD et al (2001). Angiotensin‐converting enzyme inhibition attenuates the progression of rat hepatic fibrosis. Gastroenterology 121: 148–155. [DOI] [PubMed] [Google Scholar]
- Kilkenny C, Browne W, Cuthill I, Emerson M, Altman D (2010). Improving bioscience research reporting: the ARRIVE guidelines for reporting animal research. J Pharmacol Pharmacother 1: 94–99. [DOI] [PMC free article] [PubMed] [Google Scholar]
- Krug AW, Grossmann C, Schuster C, Freudinger R, Mildenberger S, Govindan MV et al (2003). Aldosterone stimulates epidermal growth factor receptor expression. J Biol Chem 278: 43060–43066. [DOI] [PubMed] [Google Scholar]
- Kuiper JJ, Boomsma F, van Buren H, de Man R, Danser AHJ, van den Meiracker AH (2008). Components of the renin–angiotensin–aldosterone system in plasma and ascites in hepatic cirrhosis. Eur J Clin Invest 38: 939–944. [DOI] [PubMed] [Google Scholar]
- Luo W, Meng Y, Ji H‐L, Pan C‐Q, Huang S, Yu C‐H et al (2012). Spironolactone lowers portal hypertension by inhibiting liver fibrosis, ROCK‐2 activity and activating NO/PKG pathway in the bile‐duct‐ligated rat. PLoS ONE 7: e34230. [DOI] [PMC free article] [PubMed] [Google Scholar]
- Marrone G, Shah VH, Gracia‐Sancho J (2016). Sinusoidal communication in liver fibrosis and regeneration. J Hepatol 65: 608–617. [DOI] [PMC free article] [PubMed] [Google Scholar]
- Matono T, Koda M, Tokunaga S, Sugihara T, Ueki M, Murawaki Y (2010). The effects of the selective mineralocorticoid receptor antagonist eplerenone on hepatic fibrosis induced by bile duct ligation in rat. Int J Mol Med 25: 875–882. [DOI] [PubMed] [Google Scholar]
- McGrath JC, Lilley E (2015). Implementing guidelines on reporting research using animals (ARRIVE etc.): new requirements for publication in BJP. Br J Pharmacol 172: 3189–3193. [DOI] [PMC free article] [PubMed] [Google Scholar]
- Meinel S, Gekle M, Grossmann C (2014). Mineralocorticoid receptor signaling: crosstalk with membrane receptors and other modulators. Steroids 91: 3–10. [DOI] [PubMed] [Google Scholar]
- Moeller M, Thonig A, Pohl S, Ripoll C, Zipprich A (2015). Hepatic arterial vasodilation is independent of portal hypertension in early stages of cirrhosis. PLoS ONE 10: e0121229. [DOI] [PMC free article] [PubMed] [Google Scholar]
- Moreno M, Gonzalo T, Kok RJ, Sancho‐bru P, van Beuge M, Swart J et al (2010). Reduction of advanced liver fibrosis by short‐term targeted delivery of an angiotensin receptor blocker to hepatic stellate cells in rats. Hepatology 51: 942–952. [DOI] [PubMed] [Google Scholar]
- Nakano S, Kobayashi N, Yoshida K, Ohno T, Matsuoka H (2005). Cardioprotective mechanisms of spironolactone associated with the angiotensin‐converting enzyme/epidermal growth factor receptor/extracellular signal‐regulated kinases, NAD(P)H oxidase/lectin‐like oxidized low‐density lipoprotein receptor‐1, and Rho‐kinase pathways in aldosterone/salt‐induced hypertensive rats. Hypertens Res 28: 925–936. [DOI] [PubMed] [Google Scholar]
- Nie H, Li J, Yang X‐M, Cao Q‐Z, Feng M‐X, Xue F et al (2015). Mineralocorticoid receptor suppresses cancer progression and the Warburg effect by modulating the miR‐338‐3p‐PKLR axis in hepatocellular carcinoma. Hepatology 62: 1145–1159. [DOI] [PMC free article] [PubMed] [Google Scholar]
- Odermatt A, Arnold P, Frey FJ (2001). The intracellular localization of the mineralocorticoid receptor is regulated by 11β‐hydroxysteroid dehydrogenase type 2. J Biol Chem 276: 28484–28492. [DOI] [PubMed] [Google Scholar]
- Paillard J, Baviera E, Agarwal MK (1980). Gluco‐ and mineralocorticoid receptors in human liver and kidney. Biochem Med 24: 201–209. [DOI] [PubMed] [Google Scholar]
- Pfau A, Grossmann C, Freudinger R, Mildenberger S, Benesic A, Gekle M (2007). Ca2+ but not H2O2 modulates GRE‐element activation by the human mineralocorticoid receptor in HEK cells. Mol Cell Endocrinol 264: 35–43. [DOI] [PubMed] [Google Scholar]
- Pitt B (2004). Effect of aldosterone blockade in patients with systolic left ventricular dysfunction: implications of the RALES and EPHESUS studies. Mol Cell Endocrinol 217: 53–58. [DOI] [PubMed] [Google Scholar]
- Pizarro M, Solís N, Quintero P, Barrera F, Cabrera D, Rojas‐de Santiago P et al (2015). Beneficial effects of mineralocorticoid receptor blockade in experimental non‐alcoholic steatohepatitis. Liver Int 35: 2129–2138. [DOI] [PMC free article] [PubMed] [Google Scholar]
- Queisser N, Happ K, Link S, Jahn D, Zimnol A, Geier A et al (2014). Aldosterone induces fibrosis, oxidative stress and DNA damage in livers of male rats independent of BP changes. Toxicol Appl Pharmacol 280: 399–407. [DOI] [PubMed] [Google Scholar]
- Te Riet L, van Esch JHM, Roks AJM, van den Meiracker AH, Danser AHJ (2015). Hypertension: renin–angiotensin–aldosterone system alterations. Circ Res 116: 960–975. [DOI] [PubMed] [Google Scholar]
- Rombouts K, Niki T, Wielant A, Hellemans K, Schuppan D, Kormoss N et al (2001). Effect of aldosterone on collagen steady state levels in primary and subcultured rat hepatic stellate cells. J Hepatol 34: 230–238. [DOI] [PubMed] [Google Scholar]
- Ruhs S, Strätz N, Schlör K, Meinel S, Mildenberger S, Rabe S et al (2012). Modulation of transcriptional mineralocorticoid receptor activity by nitrosative stress. Free Radic Biol Med 53: 1088–1100. [DOI] [PubMed] [Google Scholar]
- Schreier B, Rabe S, Winter S, Ruhs S, Mildenberger S, Schneider B et al (2014). Moderate inappropriately high aldosterone/NaCl constellation in mice: cardiovascular effects and the role of cardiovascular epidermal growth factor receptor. Sci Rep 4: 7430. [DOI] [PMC free article] [PubMed] [Google Scholar]
- Skott O, Uhrenholt TR, Schjerning J, Hansen PBL, Rasmussen LE, Jensen BL (2006). Rapid actions of aldosterone in vascular health and disease – friend or foe? Pharmacol Ther 111: 495–507. [DOI] [PubMed] [Google Scholar]
- Tandon P, Abraldes JG, Berzigotti A, Garcia‐Pagan JC, Bosch J (2010). Renin–angiotensin–aldosterone inhibitors in the reduction of portal pressure: a systematic review and meta‐analysis. J Hepatol 53: 273–282. [DOI] [PubMed] [Google Scholar]
- Yan Y, Wang C, Lu Y, Gong H, Wu Z, Ma X et al (2017). Mineralocorticoid receptor antagonism protects the aorta from vascular smooth muscle cell proliferation and collagen deposition in a rat model of adrenal aldosterone‐producing adenoma. J Physiol Biochem 26: 2399. [DOI] [PubMed] [Google Scholar]
- Youcef G, Olivier A, Nicot N, Müller A, Deng C, Labat C et al (2016). Preventive and chronic mineralocorticoid receptor antagonism is highly beneficial in obese SHHF rats. Br J Pharmacol 173: 1805–1819. [DOI] [PMC free article] [PubMed] [Google Scholar]
- Zipprich A, Loureiro‐Silva MR, Jain D, D'Silva I, Groszmann RJ (2008). Nitric oxide and vascular remodeling modulate hepatic arterial vascular resistance in the isolated perfused cirrhotic rat liver. J Hepatol 49: 739–745. [DOI] [PubMed] [Google Scholar]
Associated Data
This section collects any data citations, data availability statements, or supplementary materials included in this article.
Supplementary Materials
Figure S1 Sirius Red stainings of livers from control, fibrotic, cirrhotic rats without ascites and cirrhotic rats with ascites. Sirius red stainings of livers from control, fibrotic (5 weeks of CCl4 administration), cirrhotic rats without ascites (8 weeks of CCl4 administration) and cirrhotic rats with ascites (12 weeks of CCl4 administration) showing the increase amount of fibrotic tissue from control to cirrhotic rats with ascites.
Figure S2 Protein expression of GR in liver and hepatocytes. Western blot analysis of the glucocorticoid receptor (GR) from livers and hepatocytes of controls and cirrhosis with ascitis (12 weeks of CCl4 administration). *P<0.05; n=6/group.
Figure S3 MR expression in hepatoma cells under hypoxic and inflammatory conditions. Hepatoma cells (MH1C1) exposed to hypoxia (0.1% O2). A: Relative mRNA quantification of serpine‐1. B: Relative mRNA quantification of mineralocorticoid receptor (MR). C: Amount of MR protein of hepatocytes related to the housekeeping protein ß‐actin. *P<0.05 vs. control normoxia; n=6/group.