

Abstract
Background:
Older adults constitute a rapidly expanding proportion of the U.S. population. Contemporary studies note the increasing prevalence of alcohol consumption in this group. Thus, understanding alcohol effects, consumption patterns, and associated risks in aging populations constitute critical areas of study with increasing public health relevance.
Methods:
Participants (n = 643; 292 women; ages 21–70) were community residing adult volunteers. Primary measures of interest included four patterns of alcohol consumption (average [oz./day]; typical quantity [oz./ occasion]; frequency [% drinking days]; and maximal quantity [oz.]). Regression analyses explored associations between these measures, age, and relevant covariates. Subsequent between-group analyses investigated differences between two groups of older adults and a comparator group of younger adults, their adherance to “low-risk” guidelines, and whether alcohol-associated risks differed by age and adherence pattern.
Results:
Average consumption did not vary by age or differ between age groups. In contrast, markedly higher frequencies and lower quantities of consumption were observed with increasing age. These differences persisted across adherence categories and were evident even in the oldest age group. Exceeding “low-risk” guidelines was associated with greater risk for alcohol-related problems among the older groups.
Conclusions:
These results emphasize the utility of considering underlying constituent patterns of consumption in older drinkers. Findings highlight difficulties in identifying problem drinking among older adults and contribute to the few characterizations of “risky” drinking patterns in this group. Taken together, our data contribute to literatures of import for the design and enhancement of screening, prevention, and education initiatives directed toward aging adults.
Keywords: Aging, Alcohol, Drinking patterns, Quantity, Frequency
1. Introduction
Older adults constitute a rapidly expanding proportion of the U.S. population. Current estimates predict that over the next two decades the proportion of the United States population aged 65+ will increase substantially, growing from less than 15% in 2015 to over 20% in 2030 (Ortman et al., 2014). Nearly half of persons 65+ report current alcohol use, and recent work suggests both drinking prevalence and incidence of heavy drinking are increasing among older adults (Dawson et al., 2015; Breslow et al., 2017). These trends contribute to growing public health concerns regarding alcohol use in older individuals, reflected in the current Strategic Plan of the National Institute on Alcohol Abuse and Alcoholism (NIAAA, 2017). Thus, understanding alcohol effects, consumption patterns, and associated risks in aging populations constitute critical areas of study. Despite their importance, research directed toward such investigation is largely lacking (but see Moos et al., 2009; Blow and Barry, 2000).
Epidemiological investigations provide substantial evidence regarding general age-related trends in drinking behaviors. Following early adulthood, rates of heavy drinking decrease (e.g., Naimi et al., 2003; Greenfıeld and Rogers, 1999; Shaw et al., 2011). Reductions in typically consumed quantities are common during middle age; however, ambiguity remains regarding consumption in older adulthood. For instance, Chan et al. (2007) report consumption per typical drinking occasion of 0.7 standard drinks among adults 65+. In contrast, Balsa et al. (2008) observed typical consumption of approximately 1.5 drinks. Both studies analyzed data from the first wave of the National Epidemiological Survey on Alcohol and Related Conditions (NESARC), which highlights the ambiguity in this relatively small literature.
NIAAA provides evidence-based guidelines for low-risk drinking, including sex-and age-specific limits for average and single day consumption (NIAAA, 2016; described in methods). Examinations among older drinkers indicate that substantial proportions (50%+) adhere to these guidelines, but variations in method and samples challenge more precise determinations. In a large survey of Medicare beneficiaries, Merrick et al. (2008) observed adherence rates of approximately 80% among adults 65–70. However, in a similarly aged group (65–75), Moos et al. (2004) observed adherence rates of 55%–70%. Exceeding guidelines is predictive of higher incidence of alcohol use problems among older drinkers (e.g., Moos et al., 2004; Holahan et al., 2017). However, numerous studies have suggested some health benefits of alcohol consumption, even at levels exceeding low-risk guidelines. For instance, an investigation using NESARC data observed improved cardiovascular health and reduced rates of hospitalization among women aged 65+ (Balsa et al., 2008), even at levels exceeding 1 drink/day.
With growing attention to the import of understanding alcohol’s affects and patterns of consumption in older drinkers, empirical investigations directed to this population are increasing. Whether community samples volunteering for participation in alcohol studies display drinking topographies and age-related differences consistent with those observed in population-based epidemiological investigations remains poorly characterized. Failure to appreciate these differences in the design, conduct, and interpretation of experimental work constrains scientific and clinical relevance and potentially results in unrecognized bias and inaccurate conclusions. Thus, there exists a current need to explore age-related differences in alcohol use within community samples serving as research participants.
The current study leverages data collected from an ongoing program of clinical research investigating alcohol effects and consequences. Observations reported here provide insight into drinking behaviors among community-residing older drinkers as well as considerations critical to improving generalizability of future empirical research utilizing similar samples. We characterized age effects in a sample of current drinkers volunteering to take part in alcohol studies using regression and between-group analyses. Regression analyses explored relationships between drinking behaviors and age across the entire sample (aged 21–70) with attention to relevant covariates. Based on the current literature, we hypothesized overall levels of alcohol consumption would evince a negative relationship with age; of greater interest was exploring the extent to which component drinking behaviors, including frequency of drinking occasions, quantity consumed during typical occasions, and maximal consumption levels, varied with age.
Subsequent between-group analyses examined differences in drinking behaviors among three age groups: 1) older adults with potential age-related vulnerabilities to alcohol-associated consequences (age 65+), 2) older adults below this age-related threshold (ages 55–64), and 3) a comparator group of younger participants (25–35). These analyses sought to (a) describe age differences in patterns of adherence to NIAAA guidelines for low-risk consumption, (b) describe differences in drinking behavior as a function of guideline adherence across age groups, and (c) investigate age differences in the degree to which adherence patterns were predictive of alcohol-associated problems.
2. Methods
Institutional Review Boards at the University of Florida and University of Kentucky approved all procedures. Data were gathered in the context of screening procedures for ongoing research studies (e.g., Lewis et al., 2016; Boissoneault et al., 2014; Sklar et al., 2014; Gilbertson et al., 2010). Participants were adult, community-residing drinkers, recruited through a variety of local print and radio advertisements, who provided written informed consent and were compensated for their time. Eligibility for participation included endorsement of current drinking (at least one drink in the last 6 months), being in good physical health, and having no history of treatment for alcohol or other substance abuse.
2.1. Affective and demographic measures
Participants provided demographic information and completed inventories of depressive symptoms (Beck Depression Inventory [BDI-II] for individuals aged 21–54 (Beck et al., 1996); Geriatric Depression Scale [GDS] for individuals ≥55 (Yesavage et al., 1982)), and state anxiety (Anxiety Inventory [AI]; Spielberger, 1983).
2.2. Alcohol consumption measures
Recent (6-month) alcohol consumption was collected using four measures. Average daily consumption (oz. absolute alcohol/day) was quantified using a quantity-frequency index (QFI; Cahalan et al., 1969). Maximal quantity reflected the largest volume (oz. absolute alcohol) of single day consumption. These measures were recorded for all participants. Frequency was calculated as the proportion of drinking to non-drinking days in a typical week. Quantity was calculated as ounces of absolute alcohol consumed during typical drinking occasions. Alcohol use histories, including ages at several drinking “milestones”, were collected. Age at first alcohol intoxication was incorporated as a covariate in regression models.
2.3. NIAAA guidelines
Recent drinking patterns were characterized according to NIAAA guidelines for “low-risk” drinking, which define a standard drink as containing 14 g or 0.6 fluid ounces of absolute alcohol (NIAAA, 2016). Low-risk drinking patterns were defined according to average and single day limits. Guidelines for average consumption limit men aged 21–64 to ≤14 standard drinks/week (≤2 drinks/day). Men over 65 and women over 21 are limited to ≤7 drinks/week (≤1 drink/day). Single day guidelines further stipulate no more than 4 drinks in any single day for men 21–64 and no more than 3 for women over 21 or men over 65. Weekly guideline adherence was determined using QFI; single day guideline adherence was determined using Maximal Quantity. Adherence patterns were categorized as follows: 1) neither guideline exceeded (“low-risk drinkers”), 2) only one guideline exceeded, or 3) both guidelines exceeded.
2.4. Michigan Alcoholism Screening Test (MAST/MAST-G)
Participants completed structured screening instruments to characterize alcohol use problems. Participants aged ≤54 completed the MAST (Selzer, 1971); participants ≥55 completed the MAST-G (Blow, 1991), a version validated for use among older adults. Consistent with standard scoring guidelines, participant scores of ≥5 in these instruments were considered indicative of potential drinking problems (Selzer, 1971; Blow et al., 1992).
2.5. Analysis
All analyses were conducted with SAS (9.4). Data were gathered across several studies; variation between protocols resulted in incomplete data for two relevant measures: MAST/MAST-G (n = 408 available) and drinking quantity/frequency (n = 481 available).
Regression analyses examined age as a continuous measure in models of average consumption and component behaviors (i.e., typical quantity, frequency, maximal quantity). Given literature describing relationships between drinking behaviors and sex, education, and age of first intoxication, these measures were included as covariates. No interactions between age and either education or intoxication age were detected in preliminary analyses; thus, these interaction terms were omitted from final models. Age by sex interactions were included in all models; this is consistent with the extant epidemiological literature.
Between-group analyses examined adults aged 55–64 (n = 178; 50% women), older adults aged 65–70 (“65+”; n = 81; 49% women), and a comparator group of younger adults aged 25–35 (n = 277; 43% women). Individuals were further categorized according to their adherence to NIAAA guidelines. Patterns of adherence were analyzed with chi-square analyses. Guideline adherence and drinking behaviors were not independent, and therefore potential age differences in low-risk drinkers and individuals exceeding guidelines were analyzed in separate GLMs. Relationships between patterns of guideline adherence and drinking problems were characterized with t-tests and chi-square analyses conducted within each age group.
3. Results
3.1. Sample characteristics
Participants (N = 643; 45.4% women) were primarily Caucasian (76%), African American (10%), or Hispanic (6%). Descriptive statistics for sample characteristics are reported in Table 1, including the total sample and each of the three age groups examined. Participants were generally well educated, with approximately 10% completing high school, 26% completing some college, 29% completing college, and 33% completing at least one year of post-graduate study. AI, BDI-II, and GDS measures indicated minimal affective symptomatology. Descriptive statistics for drinking measures, including the total sample and each age group, are reported in Table 2.
Table 1.
Sample Characteristics.
| Measures | Total M (SD)/% | Younger (25–35) M (SD)/% | Older (55–64)M (SD)/% | Older (65+) M (SD)/% |
|---|---|---|---|---|
| Sex (% Women) | 45.4% | 43.4% | 50.0% | 49.4% |
| Age | 43.9 (16.1) | 28.2 (3.1) | 59.1 (2.7) | 67.5 (1.7) |
| Education | 15.7 (2.3) | 16.2 (2.1) | 15.6 (2.3) | 15.6 (2.2) |
| Depressive Symptoms (BDI/GDS) a,b | N/Ad | 4.3 (5.4)a | 2.8 (3.3)b | 2.1 (2.4)b |
| Anxiety Symptoms (AI)c | 43.0 (8.5) | 42.1 (7.1) | 44.5 (7.9) | 43.6 (8.0) |
| Initial Intoxication Age | 18.1 (3.5) | 17.8 (3.2) | 18.1 (4.0) | 19.3 (3.7) |
Beck Depression Inventory, 2nd ed. (Beck et al., 1996).
Geriatric Depression Scale (Yesavage et al., 1982).
State Anxiety Index (Spielberger, 1983).
Use of multiple measures precluded presentation of averaged scores.
Table 2.
Drinking Patterns by Age Group.
| Drinking Pattern | Total M (SD) | Younger (25–35) M(SD) | Older(55–64) M(SD) | Older (65+) M(SD) |
|---|---|---|---|---|
| Average (QFI)a | 0.48 (0.48) | 0.44 (0.39) | 0.42 (0.44) | 0.52 (0.56) |
| Quantityb | 1.76 (2.17) | 2.02 (2.39) | 1.41 (1.69) | 1.18 (0.59) |
| Frequencyc | 0.26 (0.26) | 0.18 (0.15) | 0.29 (0.28) | 0.35 (0.33) |
| Maximal Quantity (oz.)d | 3.67 (3.23) | 4.41 (3.33) | 2.72 (2.14) | 2.27 (1.37) |
Quantity Frequency Index [oz./day; ∼0.6 fluid ounces absolute alcohol = 1 standard drink] (after Cahalan et al., 1969).
Typical quantity [oz./per drinking day].
Frequency [% drinking days/week].
Maximal Quantity [Maximum oz. consumed/24 h].
3.2. Component drinking behaviors across age (regression analyses)
3.2.1. Age effects
No effect of age was detected for average daily consumption. However, substantial associations were detected between age and component drinking behaviors. Quantity of alcohol consumed during both typical drinking occasions and maximal drinking episodes decreased with age [F(1,447) = 11.91, p < .01; F (1,592) = 51.26, p < .01; respectively]. In contrast, the frequency of drinking occasions increased with age [F(1,447) = 55.40, p < .01; ].
3.2.2. Covariate effects
As anticipated, several covariates were associated with drinking behaviors. Earlier intoxication was associated with greater average consumption (oz./day), higher maximal quantity, and higher frequency (ps < 0.01). Education was inversely associated with average, typical (oz./occasion), and maximal consumption levels (ps ≤ 0.05). Maximal consumption was greater among men (p = 0.02).
3.3. Drinking by age group and guideline adherence (between-group analyses)
3.3.1. Low-risk guideline adherence
Distribution across adherence categories was disproportionate by age group [χ2 = 44.47, p < .01]. Data are reported in Table 3. Adherence to both guidelines was more common among older adults, whereas exceeding one guideline was more common among the younger group. Although exceeding both guidelines was the least common pattern for all groups, adults 65+ appeared to display this pattern more commonly (22% of older 65+ vs. 11–12% in other groups).
Table 3.
Guideline Adherence and MAST Scores by Age Group.
| Age Group | Adherence Category | % Age Group | MAST Score1 M (SD) [Cohen’s d] | % > 5 MAST2 [Cramer’s φ] |
|---|---|---|---|---|
| Younger (25–35) | Low-Risk | 31.0% | 0.9 (1.3) | 2.4% |
| Exceeding One Guideline | 56.9% | 2.0 (2.0) [0.64] | 10.2% [ns] | |
| Exceeding Both Guidelines | 12.1% | 3.6 (3.1) [1.10] | 19.1% [0.29] | |
| Older (55–64) | Low-Risk | 55.6% | 2.9 (2.2) | 21.6% |
| Exceeding One Guideline | 33.7% | 4.4 (3.0) [0.56] | 37.5% [0.17] | |
| Exceeding Both Guidelines | 10.7% | 6.1 (3.1) [0.85] | 50.0% [0.25] | |
| Older (65+) | Low-Risk | 46.9% | 2.0 (1.8) | 13.2% |
| Exceeding One Guideline | 30.9% | 1.9 (1.6) [ns]... | 8.0% [ns] | |
| Exceeding Both Guidelines | 22.2% | 4.7 (2.7) [1.14] | 50.0% [0.39] |
T-test
Chi-square analyses compared low-risk drinkers to those exceeding guidelines within each age group. T-tests were conducted on MAST scores, with Cohen’s d describing effect sizes for significant results. Chi-squared analyses compared group proportions reaching MAST criterion for problem drinking (≥5), with Cramer’s φ describing effect sizes for significant results.
Although sex was not a specific focus of the current analyses, differences in drinking guidelines between men and women suggested the utility of interrogating potential sex differences in adherence. Chi-square analyses revealed no significant difference in proportions of men and women across the three adherence categories.
3.3.2. Age differences among low-risk drinkers
Relationships between age groups and adherence categories for all drinking measures are depicted in Fig. 1. Despite more conservative guidelines among 65+ adults, no age differences in average consumption were noted between low-risk groups. Significant age effects were noted for frequency, typical quantity, and maximal quantity [F (2,188) = 4.26, p = .02; F(2,188) = 3.79, p = .02; F(2,188) = 3.07, p = .05; respectively]. In all cases, younger adults differed from at least one of the older groups (ps < 0.03), reflecting their lower frequency and higher quantities of consumption. Older adults were equivalent on these measures (ps > 0.45).
Fig. 1.
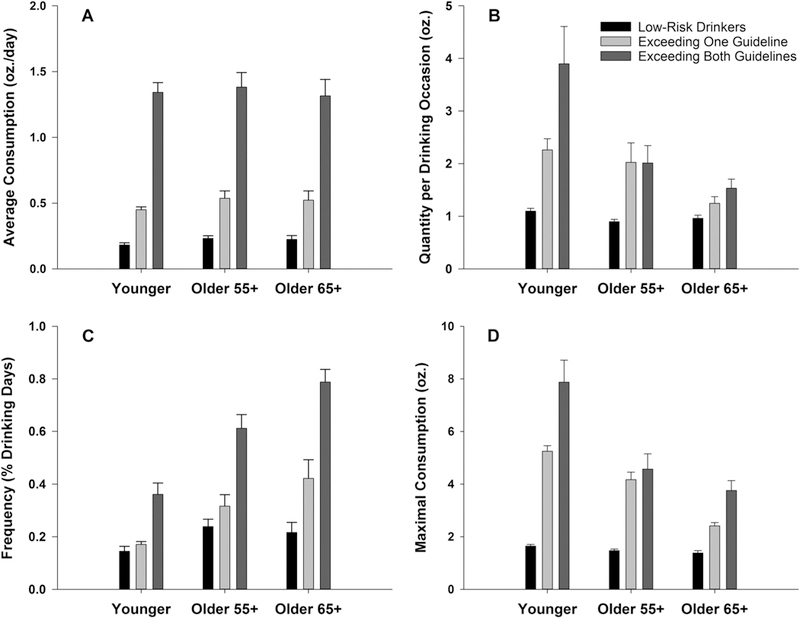
Drinking Behaviors by Age and NIAAA Guideline Adherence. Data reflect means and standard errors for all consumption measures. Fig. 1A. No age effects or age interactions were noted for average consumption levels. Fig. 1B. Quantity analyses revealed age effects, with younger individuals consuming greater amounts than older groups. Fig. 1C. Frequency analyses revealed age effects, with younger individuals reporting fewer drinking days. An age by adherence interaction was detected, which appeared driven by disproportionally higher drinking frequency among drinkers 65+ who exceeded both guidelines. Fig. 1D. Younger adults consumed larger maximal quantities relative to older adults. An age by adherence interaction was observed, characterized by substantially larger maximal consumption amounts among younger, relative to older, drinkers exceeding both guidelines.
Note: Although analyses were conducted between low-risk drinkers and those exceeding guidelines separately, these data are presented together to enhance interpretation and comparison of drinking patterns across adherence categories.
3.3.3. Age differences among individuals exceeding guidelines
Factorial GLM analyses interrogated drinking behaviors by age group and guideline adherence (exceeding one vs. exceeding both).
3.3.3.1. Average consumption.
Consistent with previous analyses, no age difference was noted for average consumption. An adherence effect was detected [F(1,372) = 230.08, p < .01; ] which showed markedly higher average consumption among individuals exceeding both guidelines.
3.3.3.2. Typical quantity.
Quantity analyses revealed only an age group effect [F(2,283) = 6.92, p < .01; ], with higher consumption among younger individuals (ps < 0.02)
3.3.3.3. Frequency.
Main effects of both age [F(2,283) = 40.23, p < .01; ] and adherence [F(1,283) = 71.88, p < .01; ] were detected. Age effects were consistent with regression analyses, reflecting increases in frequency across age (all age groups differed; ps < 0.01). Individuals exceeding both guidelines drank at higher frequencies regardless of age group (all ps < 0.01). A trend-level interaction was detected [F(1,283) = 2.72, p = .06; ], reflecting differential adherence-associated increases between age groups. Older 65+ adults exceeding both guidelines drank approximately 40% more frequently than those exceeding only one, and this was relative to a 30% increase among older 55–64 adults and a 20% increase in the younger group.
3.3.3.4. Maximal quantity.
Main effects of both age [F(2,283) = 40.23, p < .01; ] and adherence [F(1,283) = 71.88, p < .01; ] were detected, which reflects decreases across age (all groups differed; ps ≤ 0.05) and greater maximal consumption among individuals exceeding both guidelines. A trend-level interaction was detected [F(1,283) = 2.72, p = .06; ], which again reflects differential adherence-associated increases. Younger individuals exceeding both guidelines reported consuming markedly higher levels of alcohol during maximal drinking occasions relative to those exceeding only one guideline (approximately 4.5 more standard drinks; p < 0.01). Older individuals failed to display significant increases by adherence (ps > 0.18). These data are depicted in Fig. 1.
3.3.4. Alcohol problems (Michigan Alcoholism Screening Test)
Employment of the MAST-G among older individuals precluded direct comparison of MAST scores across age; thus, analyses were conducted for each age separately. T-tests compared MAST scores between low-risk drinkers and each group exceeding guidelines. Chi-square analyses compared proportions reaching problem drinking criterion scores (≥5) among low risk drinkers and each group exceeding guidelines. Among younger individuals, MAST scores were higher for both groups exceeding guidelines (ps < 0.01); however, group proportions reaching criterion differed relative to low-risk drinkers only among drinkers exceeding both guidelines (p = 0.02). Among adults aged 55–64, both groups exceeding guidelines had higher MAST scores (ps < 0.01) and higher proportions reaching problem criterion (ps < 0.02). Older adults 65+ exceeding both guidelines had significantly higher MAST scores (p < 0.01) and a greater proportion reaching criterion (p < 0.01). However, no differences were observed between low risk drinkers and individuals exceeding only one guideline. Mean MAST scores and effect size estimates are presented in Table 3.
4. Discussion
Contrary to our hypothesis, average alcohol consumption did not vary with drinker age, despite the 50-year age span of the sample. Consistent with these findings, no age differences in average consumption were noted between discrete groups of older and younger drinkers. When age differences were interrogated with respect to low-risk guideline adherence, average consumption levels remained equivalent between age groups within each adherence category. Although we did not observe hypothesized reductions in average consumption levels, our findings remain consistent in many ways with larger population-based studies. Several such works (e.g., Shaw et al., 2011) observe age-based reductions in consumption based on rates of abstinence and heavy drinking. Although our use of current drinkers precluded estimation of abstinence rates, our results are consistent with age-associated reductions in heavy drinking. Further, reductions in average consumption with increasing age are not uniformly noted; in a longitudinal design, Molander et al. (2010) observed increases in average consumption among men over a ∼10-year period (ages 53–64).
In contrast to average consumption measures, component behaviors, including drinking frequency and quantities consumed during typical and maximal drinking events, evinced substantial age differences. Across analyses, age-related increases in drinking frequency and decreases in quantity were observed. These findings are largely consistent with related works (e.g., Molander et al., 2010) and highlight that composite measures of consumption may be inadequate for describing temporal changes in drinking patterns. Although the current study is cross-sectional, our results suggest that these behaviors may shift across the lifespan without necessarily altering average levels of consumption.
Understanding patterns of adherence to low-risk drinking guidelines across the lifespan, and the degree to which guideline adherence may predict particular age-contingent drinking repertoires, is critical to healthcare and prevention efforts. Although organizational drinking guidelines now commonly differentiate by sex (e.g., US Department of Health and Human Services, 2015), age-based adjustments remain rare (but see American Geriatric Society, 2006). We selected NIAAA guidelines based on their adjustment for both. Adults aged 65+ display greater alcohol-associated vulnerabilities (Vestal et al., 1977; NIAAA, 1998); accordingly, NIAAA guidelines for this population are more conservative. The proportion of older adults exceeding guidelines in the current sample (44% of adults 55–64; 53% of adults 65+) was provocative. Whether this lack of adherence reflects unawareness of the guidelines (noted by Green et al., 2007), lack of willingness to follow them, or disbelief that age-contingent reductions in drinking are necessary remains unknown and warrants further study.
Of particular interest was whether consumption in adults 65+ would differ from older adults below this age threshold (aged 55–64). Despite differential guidelines, individuals adhering to those guidelines reported equivalent drinking behaviors across these age groups. Among those exceeding guidelines, adults 65+ drank more often (approximately one more day/week) but consumed less per occasion (approximately one standard drink less) than those aged 55–64. These observations suggest age-associated shifts in frequency and quantity continue beyond middle age. While of significant import, replication with longitudinal designs and/or epidemiological investigations powered to decompose cohort effects is critical. Whether the reported trends in drinking behaviors or adherence patterns persist past age 70 (the limit in the current work) remains largely uninvestigated with few exceptions. For instance, McEvoy et al. (2013) report that approximately 35% of drinkers past this limit (age 82 ± 5) continue to exceed guidelines.
Early recognition of risky drinking constitutes a significant challenge to prevention and intervention efforts in drinkers of all ages. Our findings highlight age-related difficulties in recognizing these behaviors. Among younger individuals exceeding both guidelines, consumption levels (average of ∼7 drinks/occasion) were consistent with binge drinking to intoxication (NIAAA, 2004) during typical drinking occasions. These levels are associated with a variety of immediate risks, are likely to produce behavioral disruptions, and frequently constitute violations of legal limits and/or social norms, affording opportunities for intervention. In contrast, among adults 65+ exceeding both guidelines, typical consumption was markedly lower (average ∼2.5 drinks/occasion). These levels are generally consistent with social drinking and are likely to result in only subtle behavior impairments which may be easily misattributed to age (e.g., loss of balance). Given the current sample characteristics, suggestions for modifying prevention efforts or clinical strategies based on these results remains premature. However, this work adds to a growing literature of import to such endeavors (e.g., Molander et al., 2010) which highlight that consideration of single drinking measures (e.g., average consumption) may be inadequate, particularly in aging populations.
The aforementioned typical drinking behaviors among individuals exceeding both guidelines would seem to imply greater risk for alcohol-related problems among younger adults, but this speculation was not supported by our data. Risks for alcohol problems were markedly increased among older adults exceeding both guidelines. Within this adherence category, fewer than 20% of younger adults met MAST criterion for alcohol problems. In contrast, 50% of older individuals (in both 55–64 and 65+ groups) reached criterion. Risks associated with exceeding guidelines are well substantiated (e.g., Dawson and Grant, 2011) but have not been sufficiently explored among older adults. The work of Moos and colleagues provide a notable exception; in a longitudinal study of older adults (55–65 at baseline), they examined both “conservative” (≤2 drinks in any single day or ≤7 drinks/week) and “liberal” (≤3/single day or ≤14/week) guidelines (Moos et al., 2009). They noted the utility of the conservative guidelines, as 21% of older women and 34% of older men exceeding these guidelines also met criteria for problem drinking. Our results suggest similar utility for NIAAA guidelines in older drinkers and support their more conservative limits at age 65. The current findings emphasize the importance of considering both typical (i.e., frequency; quantity) and atypical (maximal) consumption behaviors and are consistent with recent work asserting the inadequacy of risk assessments in older adults based solely on average consumption (Holahan et al., 2017). Taken together, these conclusions highlight the value of employing low-risk guidelines as a screening tool but stress the importance of considering patterns of adherence rather than binary (adhering vs. exceeding) outcomes.
4.1. Limitations and future directions
By design, participants in the current report did not constitute a fully representative community sample. Study eligibility was limited to current drinkers and excluded drinkers with histories of treatment for alcohol or other substance abuse; participants were clinical research volunteers and were thus non-randomly selected. While they do not preclude the importance of our findings, these characteristics suggest that replication with randomly-sampled individuals without exclusion for substance use treatment would strengthen interpretation and improve generalizability. Conversely, the sample characteristics substantially enhance the importance of our findings to clinical research that includes older drinkers. Attention to the complex relationships between alcohol use and age continues to grow both in fields focused on alcohol/substance use (e.g., Breslow et al., 2017; Woods et al., 2016) and on aging (e.g., McEvoy et al., 2013; Wardzala et al., 2017). Among the former, and including the work of our group (e.g., Lewis et al., 2016; Sklar et al., 2014; Boissoneault et al., 2014), empirical investigations of age and alcohol effects commonly control for participants’ average alcohol consumption by employing selection criteria (e.g., adherence to NIAAA guidelines) or covariate analyses. However, measures of frequency and quantity are rarely considered. Relationships between these behaviors and factors important to data interpretation (e.g., behavioral tolerance, placebo effectiveness, expectation effects) remain largely uncharacterized. Our findings suggest the utility of considering these behaviors in covariate analyses and eligibility criteria. Attention to these issues is likely to improve statistical power and clarify interpretation of results in work including, or directed toward, older drinkers.
Additional caveats warrant considering: (1) As mentioned previously, the cross-sectional design precludes examination of longitudinal changes in drinking behavior which would facilitate dissociation of age and cohort effects (Levenson et al., 1998). (2) The sample was predominantly white. Although preliminary analyses detected no differences by race, larger minority representation would increase generalizability. (3) Some self-report measures (e.g., age of intoxication) depended on recall and may have been vulnerable to age-associated differences in recall. (4) Due to age-related differences in distribution, individuals exceeding only average or only daily limits were combined into a single adherence category. Age differences in adherence patterns among individuals exceeding only one guideline are of potential importance and bear consideration in future work. (5) Only a single measure of alcohol-associated negative consequences and/or potential problems was utilized. MAST and MAST-G demonstrate favorable validity measures (see Storgaard et al., 1994 for review); however, some discrepancies with other assessments (e.g., Moore et al., 2002; Luttrell et al., 1997) suggest future examination should leverage multiple indices. Further, while employment of an age-specific measure (MAST-G) constituted a strength of the current work, it precluded direct comparison of scores between age groups.
5. Conclusions
Although average alcohol consumption did not vary by age, marked age-dependent differences in patterns of quantity and frequency were noted. Substantive proportions of older adults exceeded NIAAA guidelines for low-risk drinking despite a variety of measures indicating these individuals were generally healthy and high functioning. Analyses of guideline adherence suggested older adults who exceeded both average and single-day guidelines engaged in unique age-specific consumption patterns characterized by marked increases in drinking frequency. MAST-G scores suggested these individuals were at substantially increased risk for alcohol-associated problems. The current report highlights the utility of NIAAA guidelines and contributes to a literature suggesting consideration of multiple drinking patterns may improve risk prediction, particularly among older adults. These data emphasize the importance of healthcare providers and community members understanding the specific nature of long-term alcohol-associated risks (e.g., future drinking problems), many of which may not be easily or immediately observable, and highlight the importance of rigorous screening, prevention, and education initiatives specifically directed toward older drinkers.
Acknowledgements
The authors thank Robert Prather, Jeff Boissoneault, Ph.D., Alfredo Sklar, M.D., Ph.D., Lauren Hoffman, Ph.D., and Layla Lincoln for assistance with data collection.
Funding
This work was supported in part by the National Institute on Alcohol Abuse and Alcoholism (AA019802; AA14039; SJN, PI) and the National Institute of Drug Abuse (DA13677; SJN, PI).
The funding sources had no role in the design of the manuscript.
Footnotes
Conflicts of interest
No conflict declared.
References
- American Geriatric Society, 2006. Position paper: alcohol use disorders in older adults. Ann. Longterm Care 14, 23–26. [Google Scholar]
- Balsa AI, Homer JF, Fleming MF, French MT, 2008. Alcohol consumption and health among elders. Gerontologist 48, 622–636. [DOI] [PubMed] [Google Scholar]
- Beck AT, Steer RA, Brown GK, 1996. Beck Depression Inventory, 2nd ed. The Psychological Corporation, San Antonio, TX. [Google Scholar]
- Blow FC, Barry KL, 2000. Older patients with at-risk and problem drinking patterns: new developments in brief interventions. J. Geriatr. Psychiatry Neurol 13, 115–123. [DOI] [PubMed] [Google Scholar]
- Blow FC, Brower KJ, Schulenberg JE, Demo-Dananberg LM, Young JP, Beresford TP, 1992. The Michigan Alcoholism Screening Test −Geriatric version (MAST-G): a new elderly-specific screening instrument. Alcohol Clin. Exp. Res 16, 372. [Google Scholar]
- Blow FC, 1991. Michigan Alcoholism Screening Test – Geriatric Version University of Michigan, Ann Arbor, MI. [Google Scholar]
- Boissoneault J, Sklar A, Prather R, Nixon SJ, 2014. Acute effects of moderate alcohol on psychomotor, set shifting, and working memory function in older and younger social drinkers. J. Stud. Alcohol Drugs 75, 870–879. [DOI] [PMC free article] [PubMed] [Google Scholar]
- Breslow RA, Castle IJP, Chen CM, Graubard BI, 2017. Trends in alcohol consumption among older Americans: National Health Interview Surveys, 1997–2014. Alcohol Clin. Exp. Res 41, 976–986. [DOI] [PMC free article] [PubMed] [Google Scholar]
- Cahalan D, Cisin IH, Crossley HM, 1969. American Drinking Practices: A National Study of Drinking Behavior and Attitudes. Monographs of the Rutgers Center of Alcohol Studies College and University Press, New Haven, CT. [Google Scholar]
- Chan KK, Neighbors C, Gilson M, Larimer ME, Marlatt GA, 2007. Epidemiological trends in drinking by age and gender: providing normative feedback to adults. Addict. Behav 32, 967–976. [DOI] [PubMed] [Google Scholar]
- Dawson DA, Grant BF, 2011. The gray area of consumption between moderate and risk drinking. J. Stud. Alcohol Drugs 72, 453–458. [DOI] [PMC free article] [PubMed] [Google Scholar]
- Dawson DA, Goldstein RB, Saha TD, Grant BF, 2015. Changes in alcohol consumption: United States, 2001–2002 to 2012–2013. Drug Alcohol Depend 148, 56–61. [DOI] [PMC free article] [PubMed] [Google Scholar]
- Gilbertson R, Prather R, Nixon SJ, 2010. Acute alcohol administration and placebo effectiveness in older moderate drinkers: influences on cognitive performance. J. Stud. Alcohol Drugs 71, 345–350. [DOI] [PMC free article] [PubMed] [Google Scholar]
- Green CA, Polen MR, Janoff SL, Castleton DK, Perrin NA, 2007. Not getting tanked: definitions of moderate drinking and their health implications. Drug Alcohol Depend 86, 265–273. [DOI] [PMC free article] [PubMed] [Google Scholar]
- Greenfıeld TK, Rogers JD, 1999. Who drinks most of the alcohol in the US? The policy implications. J. Stud. Alcohol Drugs 60, 78–89. [DOI] [PubMed] [Google Scholar]
- Holahan CJ, Brennan PL, Schutte KK, Holahan CK, Hixon JG, Moos RH, 2017. Late-life drinking problems: the predictive roles of drinking level vs. drinking pattern. J. Stud. Alcohol Drugs 78, 435–441. [DOI] [PMC free article] [PubMed] [Google Scholar]
- Levenson MR, Aldwin CM, Spiro A 3rd, 1998. Age, cohort and period effects on alcohol consumption and problem drinking: findings from the Normative Aging Study. J. Stud. Alcohol Drugs 59, 712–722. [DOI] [PubMed] [Google Scholar]
- Lewis B, Boissoneault J, Frazier I, Nixon SJ, 2016. Effects of age and acute moderate alcohol administration on neurophysiology during simulated driving. Alcohol Clin. Exp. Res 40, 2519–2527. [DOI] [PMC free article] [PubMed] [Google Scholar]
- Luttrell S, Watkin V, Livingston G, Walker Z, D’Ath P, Patel P, Shergill S, Dain A, Bielawska C, Katona C, 1997. Screening for alcohol misuse in older people. Int. J. Geriatr. Psychiatry 12, 1151–1154. [PubMed] [Google Scholar]
- McEvoy LK, Kritz-Silverstein D, Barrett-Connor E, Bergstrom J, Laughlin GA, 2013. Changes in alcohol intake and their relationship with health status over a 24-year follow-up period in community-dwelling older adults. J. Am. Geriatr. Soc 61, 1303–1308. [DOI] [PMC free article] [PubMed] [Google Scholar]
- Merrick EL, Horgan CM, Hodgkin D, Garnick DW, Houghton SF, Panas L, Saitz R, Blow FC, 2008. Unhealthy drinking patterns in older adults: prevalence and associated characteristics. J. Am. Geriatr. Soc 56, 214–223. [DOI] [PubMed] [Google Scholar]
- Molander RC, Yonker JA, Krahn DD, 2010. Age-related changes in drinking patterns from mid-to older age: results from the Wisconsin Longitudinal Study. Alcohol Clin. Exp. Res 34, 1182–1192. [DOI] [PMC free article] [PubMed] [Google Scholar]
- Moore AA, Seeman T, Morgenstern H, Beck JC, Reuben DB, 2002. Are there differences between older persons who screen positive on the CAGE questionnaire and the Short Michigan Alcoholism Screening Test − Geriatric Version? J. Am. Geriatr. Soc 50, 858–862. [DOI] [PubMed] [Google Scholar]
- Moos RH, Schutte KK, Brennan PL, Moos BS, 2004. Ten-year patterns of alcohol consumption and drinking problems among older women and men. Addiction 99, 829–838. [DOI] [PubMed] [Google Scholar]
- Moos RH, Schutte KK, Brennan PL, Moos BS, 2009. Older adults’ alcohol consumption and late-life drinking problems: a 20-year perspective. Addiction 104, 1293–1302. [DOI] [PMC free article] [PubMed] [Google Scholar]
- National Institute on Alcohol Abuse and Alcoholism (NIAAA), 1998. Alcohol and Aging. Alcohol Alert, 40 National Institute on Alcohol Abuse and Alcoholism, Bethesda, MD. [Google Scholar]
- National Institute on Alcohol Abuse and Alcoholism (NIAAA), 2004. NIAAA Council Approves Definition of Binge Drinking. NIAAA Newsletter, 3 National Institute on Alcohol Abuse and Alcoholism, Bethesda, MD. [Google Scholar]
- National Institute on Alcohol Abuse and Alcoholism (NIAAA), 2016. Rethinking Drinking: Alcohol and Your Health (NIH Publication No. 16-AA-3770; ). (Bethesda, MD: ). [Google Scholar]
- National Institute of Alcohol Abuse and Alcoholism (NIAAA), 2017. Strategic Plan 2017–2021 National Institute of Alcohol Abuse and Alcoholism, Bethesda, MD. [Google Scholar]
- Naimi TS, Brewer RD, Mokdad A, Denny C, Serdula MK, Marks JS, 2003. Binge drinking among US adults. JAMA 289, 70–75. [DOI] [PubMed] [Google Scholar]
- Ortman JM, Velkoff VA, Hogan H, 2014. An Aging Nation: The Older Population in the United States. United States Census Bureau, Economics and Statistics Administration, US Department of Commerce, Washington, DC, pp. 25–1140. [Google Scholar]
- Selzer ML, 1971. The Michigan Alcoholism Screening Test: the quest for a new diagnostic instrument. Am. J. Psychiatry 127, 1653–1658. [DOI] [PubMed] [Google Scholar]
- Shaw BA, Krause N, Liang J, McGeever K, 2011. Age differences in long-term patterns of change in alcohol consumption among aging adults. J. Aging Health 23, 207–227. [DOI] [PMC free article] [PubMed] [Google Scholar]
- Sklar AL, Boissoneault J, Fillmore MT, Nixon SJ, 2014. Interactions between age and moderate alcohol effects on simulated driving performance. Psychopharmacol 231, 557–566. [DOI] [PMC free article] [PubMed] [Google Scholar]
- Spielberger CD, 1983. Manual for the State-Trait Anxiety Inventory Consulting Psychologists Press, Palo Alto, CA. [Google Scholar]
- Storgaard H, Nielsen SD, Gluud C, 1994. The validity of the Michigan Alcoholism Screening Test (MAST). Alcohol Alcohol 29, 493–503. [PubMed] [Google Scholar]
- Department of Health and Human Services (DHHS), US Department of Agriculture, 2015. 2015–2020-Dietary Guidelines for Americans, 8th edition. Department of Health and Human Services, Washington, DC. [Google Scholar]
- Vestal RE, McGuire EA, Tobin JD, Andres R, Norris AH, Mezey E, 1977. Aging and ethanol metabolism. Clin. Pharmacol. Ther 21, 343–354. [DOI] [PubMed] [Google Scholar]
- Wardzala C, Murchison C, Loftis JM, Schenning KJ, Mattek N, Woltjer R, Kaye J, Quinn JF, Wilhelm CJ, 2017. Sex differences in the association of alcohol with cognitive decline and brain pathology in a cohort of octogenarians. Psychopharmacology 235, 761–770. [DOI] [PMC free article] [PubMed] [Google Scholar]
- Woods AJ, Porges EC, Bryant VE, Seider T, Gongvatana A, Kahler CW, de la Monte S, Monti PM, Ronald AC, 2016. Current heavy alcohol consumption is associated with greater cognitive impairment in older adults. Alcohol Clin. Exp. Res 40, 2435–2444. [DOI] [PMC free article] [PubMed] [Google Scholar]
- Yesavage JA, Brink TL, Rose TL, Lum O, Huang V, Adey M, Leirer VO, 1982. Development and validation of a geriatric depression screening scale: A preliminary report. J. Psychiatr. Res 17, 37–49. [DOI] [PubMed] [Google Scholar]