

Abstract
Background and Purpose
Developing novel pharmacological targets beyond the monoaminergic system is now a popular strategy for treating depression. PPARα is a nuclear receptor protein that functions as a transcription factor,‐regulating gene expression. We have previously reported that both WY14643 and fenofibrate, two pharmacological agonists of PPARα, have antidepressant‐like effects in mice, implying that PPARα is a potential antidepressant target.
Experimental Approach
We first used various biotechnological methods to evaluate the effects of chronic stress and fluoxetine on hippocampal PPARα. The viral‐mediated genetic approach was then employed to explore whether hippocampal PPARα was an antidepressant target. PPARα inhibitors, PPARα‐knockout (KO) mice and PPARα‐knockdown (KD) mice were further used to determine the role of PPARα in the antidepressant effects of fluoxetine.
Key Results
Chronic stress significantly decreased mRNA and protein levels of PPARα in the hippocampus, but not other regions, and also fully reduced the recruitment of hippocampal PPARα to the cAMP response element‐binding (CREB) promoter. Genetic overexpression of hippocampal PPARα induced significant antidepressant‐like actions in mice by promoting CREB‐mediated biosynthesis of brain‐derived neurotrophic factor. Moreover, fluoxetine notably restored the stress‐induced negative effects on hippocampal PPARα. Using PPARα antagonists fully blocked the antidepressant effects of fluoxetine in mice, and similarly, both PPARα‐KO and PPARα‐KD abolished the effects of fluoxetine. Besides, PPARα‐KO and PPARα‐KD aggravated depression in mice.
Conclusions and Implications
Hippocampal PPARα is a potential novel antidepressant target that mediates the antidepressant actions of fluoxetine in mice.
Abbreviations
- ACSF
artificial CSF
- BDNF
brain‐derived neurotrophic factor
- Brdu
5‐bromo‐2‐deoxyuridine
- ChIP
chromatin immunoprecipitation
- CREB
cAMP response element binding
- CSDS
chronic social defeat stress
- CUMS
chronic unpredictable mild stress
- DCX
doublecortin
- DG
dentate gyrus
- FST
forced swimming test
- KD
knockdown
- KO
knockout
- mPFC
medial prefrontal cortex
- NAc
nucleus accumbens
- NeuN
neuronal nuclei
- PPRE
peroxisome proliferator response element
- qRT‐PCR
quantitative real‐time RT‐PCR
- SNRI
5‐HT‐noradrenaline reuptake inhibitor
- SSRI
5‐HT reuptake inhibitor
- TST
tail suspension test
- VTA
ventral tegmental area
- WT
wild‐type
Introduction
Major depressive disorder is currently one of the leading public health problems around the world and is aggravated by stressful life events interacting with genetic and other predisposing factors (Shelton, 2007; Krishnan and Nestler, 2008; Hirschfeld, 2012). Current antidepressants used in clinical practice, including selective http://www.guidetopharmacology.org/GRAC/ObjectDisplayForward?objectId=928 inhibitor (SSRI) and 5‐HT–http://www.guidetopharmacology.org/GRAC/ObjectDisplayForward?objectId=926 inhibitor (SNRI), have been developed, based on the ‘monoamine hypothesis’, which indicates that depression is caused by deficiency of synaptic monoamine neurotransmitters, especially http://www.guidetopharmacology.org/GRAC/LigandDisplayForward?ligandId=5 and http://www.guidetopharmacology.org/GRAC/LigandDisplayForward?ligandId=484 (Shelton, 2007; Krishnan and Nestler, 2008). However, although SSRI/SNRI administration increases the levels of 5‐HT or noradrenaline immediately, weeks or even months of treatments are usually required to exert beneficial effects on patients (Berton and Nestler, 2006; Albert et al., 2012). Moreover, many depressed patients do not respond well to SSRI/SNRI and some suffer from a range of side effects, including dry mouth, headache and insomnia (Berton and Nestler, 2006; Albert et al., 2012; Hirschfeld, 2012). Therefore, developing novel pharmacological targets beyond the serotonergic and noradrenergic systems is currently a promising strategy for treating depression (Berton and Nestler, 2006; Hirschfeld, 2012).
In recent years, much research has supported the ‘neurotrophic hypothesis’ for the pathophysiology of depression (Berton and Nestler, 2006; Krishnan and Nestler, 2008). This hypothesis postulates that neurotrophic factors, especially http://www.guidetopharmacology.org/GRAC/LigandDisplayForward?ligandId=4872 (BDNF), play a critical role in depression. For example, BDNF levels decrease in the brain (particularly in the hippocampus and prefrontal cortex) and serum of depressed patients, compared with those of normal subjects (Neto et al., 2011; Schimizu et al., 2004). Chronic stress significantly reduces BDNF expression in the hippocampus and medial prefrontal cortex (mPFC) of mice, but BDNF expression in nucleus accumbens (NAc) and ventral tegmental area (VTA) is enhanced (Eisch et al., 2003; Berton et al., 2006; Razzoli et al., 2011). Also, direct infusion of BDNF into the hippocampus produces antidepressant‐like effects in rodents (Shirayama et al., 2002). The delayed therapeutic effects of SSRI/SNRI may be attributed to the serotoninergic/noradrenergic signalling‐mediated intracellular effects on BDNF biosynthesis, which need a long time. Chronic treatment with many SSRI/SNRI, such as http://www.guidetopharmacology.org/GRAC/LigandDisplayForward?ligandId=203, promote BDNF production in rodents (Nibuya et al., 1995; Chen et al., 2001). However, so far, the mechanism by which chronic stress and antidepressant medications modulate the production of BDNF remains unknown.
http://www.guidetopharmacology.org/GRAC/ObjectDisplayForward?objectId=593 is a nuclear receptor protein that belongs to the PPAR family (the other members are http://www.guidetopharmacology.org/GRAC/ObjectDisplayForward?objectId=594 and http://www.guidetopharmacology.org/GRAC/ObjectDisplayForward?objectId=595) and functions as a transcription factor regulating gene expressions (Green, 1995; Qi et al., 2000). PPARα is distributed in many tissues like liver, kidney, heart, muscle and small intestine (Takahashi and Kawada, 2001). Recently, PPARα has been found to be involved in the CNS besides in fatty acid catabolism. PPARα can modulate antioxidant responses, neurotransmission, neuroinflammation, neurogenesis (Gao and Li, 2012; Fidaleo et al., 2014; Esmaeili et al., 2016; Pérez‐Martín et al., 2016). Roy et al. (2013) reported that PPARα was widely expressed in nuclei of hippocampal neurons and controlled the expressions of various plasticity‐related proteins through direct transcriptional regulation of cAMP response element binding (CREB). It is well known that CREB is crucial for BDNF biosynthesis (Finkbeiner et al., 1997). Also, with antidepressant‐like effects in rats exposed to chronic mild stress, http://www.guidetopharmacology.org/GRAC/LigandDisplayForward?ligandId=2955 can promote hippocampal BDNF expression through PPARα‐mediated transcriptional activation of CREB (Lin et al., 2014; Roy et al., 2015). In a previous study, we reported that both http://www.guidetopharmacology.org/GRAC/LigandDisplayForward?ligandId=2666 and http://www.guidetopharmacology.org/GRAC/LigandDisplayForward?ligandId=7186, two selective agonists of PPARα, had significant antidepressant‐like effects in mice via enhancing the hippocampal BDNF system, while PPARα antagonism blocked the effects of fenofibrate (Jiang et al., 2015b; Jiang et al., 2017). Collectively, PPARα may be involved in the pathogenesis of depression and the effects of antidepressant medications. Targeting PPARα may be a new approach for developing novel antidepressants. In this study, we validated these assumptions by performing a series of experiments, using various methods.
Methods
Animals
All animal care and experimental procedures were approved by the Animal Welfare Committee of Nantong University. Animal studies are reported in compliance with the ARRIVE guidelines (Kilkenny et al., 2010; McGrath and Lilley, 2015). Adult male C57BL/6J mice (8 weeks old; 22–25 g) and CD1 mice (male and female, 50 weeks old; 30–35 g) were obtained from Shanghai SLAC Laboratory Animal Co., Ltd. (Shanghai, China). Adult male PPARα‐knockout (KO) mice (stock number: 008154; B6, 129S4‐Ppara tm1Gonz/J; 8 weeks old; 20–24 g) and their wild‐type (WT) littermates (stock number: 000664; C57BL/6J; 8 weeks old; 20–24 g) were bought from Jackson Laboratory (Bar Harbor, ME, USA). Before use, all the mice were acclimatized to housing for 1 week under standard conditions (five per cage, M2 type; 12 h of light/dark cycle, lights on from 07:00 to 19:00 h; (23 ± 1)°C ambient temperature; (55 ± 10)% relative humidity; noise less than 50 dB; ammonia concentration less than 14 mg·m−3; 24 h of air circulation; and bedding replacement twice a week) and allowed ad libitum access to food and water.
All behavioural experiments were carried out during the light phase, and the mice were subjected to stratified randomization according to their body weights. To perform in vitro assays, the mice were anaesthetized using carbon dioxide and then killed by cervical dislocation. A total of 985 C57BL/6J mice (including WT) and 67 PPARα‐KO mice were used. The sample sizes were decided using power analysis. Detailed information about the mouse numbers (n) of each experimental group is provided in Supporting Information Table S1.
Forced swim test
This test was performed using plastic cylinders (diameter 20 cm; height 45 cm) filled with water (25 ± 1°C) to a depth of 15 cm (Jiang et al., 2013; Jiang et al., 2015a; Jiang et al., 2015b; Jiang et al., 2017; Wang et al., 2017a,b). C57BL/6J mice were individually placed in the cylinders for 6 min. The duration of immobility was recorded during the last 4 min by an investigator unaware of animal treatments. Then water was replaced for each trial, and the mice were considered immobile when they were floating without struggling or slightly moving to keep the heads above water. Separate groups of mice were used for this test.
Tail suspension test
C57BL/6J mice were individually suspended 60 cm above floor and fastened by adhesive tapes (approximately 1 cm from the tail tip) (Jiang et al., 2015a; Jiang et al., 2015b; Jiang et al., 2017; Wang et al., 2017a,b). The duration of immobility was recorded for 6 min by an investigator unaware of animal treatment. The mice were considered immobile when they were hung passively and completely motionless. Separate groups of mice were used for this test.
Locomotor activity test
This test was used to assay the spontaneous locomotor activity of mice (Jiang et al., 2015a; Jiang et al., 2015b; Jiang et al., 2017; Wang et al., 2017a,b). Briefly, mice were individually placed in an open‐field apparatus (100 × 100 × 50 cm) containing 25 equal squares (20 × 20 cm) for 5 min. During the 5 min, the squares that each mouse crossed were recorded under dim light condition (a 50 W red bulb on the ceiling) by an investigator unaware of animal grouping. The apparatus was thoroughly cleaned for each trial. Separate groups of mice were used for this test.
Chronic social defeat stress procedure, social interaction test and sucrose preference test
This model of depression has been frequently used in our previous studies (Jiang et al., 2013; Jiang et al., 2015a; Jiang et al., 2015b; Jiang et al., 2017; Wang et al., 2017a,b). Enough amounts of aggressive male CD1 mice were selected according to different experimental designs using a published method. In brief, the chronic social defeat stress (CSDS) period lasted for 10 days, and on each day, each C57BL/6J mouse was exposed to an aggressive CD1 mouse for up to 10 min as the intruder. After contacting, the mice were separated by plastic dividers containing holes for the next 24 h during which the C57BL/6J mice received further stressful sensory cues from the CD1 aggressors. To minimize harm and to avoid any physical wounds, the dividers were set immediately when the C57BL/6J mice showed submissive behaviours including immobility, crouching, trembling, fleeing and upright posture (usually 7–10 min). Non‐defeated control C57BL/6J mice were pair housed, handled daily and replaced with each other daily. After the stress period, the control and defeated mice received daily injection of vehicle/fluoxetine for 14 days.
Afterwards, the social interaction test containing two 5 min trials was performed. In the first trial (target absent), each mouse was placed into an open‐field apparatus (50 × 50 × 45 cm) exploring a wire‐mesh cage placed within the predefined interaction zone (14 × 26 cm) freely. In the second trial (target present), each mouse was reintroduced into the apparatus containing an unfamiliar male CD1 mouse within the cage. The duration of time spent in the interaction zone for each trial was recorded using Ethovision XT software (Noldus, Wageningen, The Netherlands). The apparatus was cleaned after each trial using 70% ethanol to remove olfactory cues. Lastly, the sucrose preference test lasting for 4 days was conducted. During the first 2 days, each mouse was individually exposed to two bottles containing pure water and 1% sucrose solution, respectively, and positions of the bottles were exchanged every 6 h to prevent side preferences. On the third day, both food and bottles were deprived for 18 h. On the fourth day, each mouse was exposed to pre‐weighed bottles for 6 h with their positions interchanged (every 2 h), sucrose preference index = consumed sucrose solution volume∕(consumed sucrose solution volume + consumed pure water volume) × 100%.
Intracerebroventricular infusions
As described before (Jiang et al., 2015a; Jiang et al., 2015b; Jiang et al., 2017), mice were anaesthetized (0.5% pentobarbital sodium, 50 mg·kg−1) and then placed in stereotaxic frames. The scalps were cut open, and the skulls were exposed to 75% ethanol and 1% H2O2. Double‐guide cannulas (Plastics One, Roanoke, VA, USA) were implanted into the left lateral brain ventricle [anteroposterior (AP) = −0.2 mm, mediolateral (ML) = +1.0 mm and dorsoventral (DV) = +2.3 mm] of each mouse using stereotactic holders under aseptic conditions. Each double‐guide cannula with inserted dummy cannula and dust cap was fixed to the skull with dental cement. The incisions were sutured, and the mice were allowed to recover for 3 days in a warm room (31 ± 1°C) with care. Osmotic minipumps were used to deliver 0.3 μL·min−1 of GW6471, MK886, ACSF containing 1% DMSO, chicken anti‐BDNF antibody, chicken IgY antibody or ACSF through the double‐internal cannulas (3 μL per mouse). Chicken anti‐BDNF antibody, which specifically neutralizes the function of BDNF, has been frequently used in our previous studies (Jiang et al., 2015a; Jiang et al., 2015b; Jiang et al., 2017) and other literatures (Braun et al., 2004). Few mice receiving infusion of anti‐BDNF + CSDS died (Supporting Information Table S1).
Intrahippocampal infusions
In brief, similar to i.c.v. procedures, mice were anaesthetized and fixed in stereotaxic frames (Jiang et al., 2014; Wang et al., 2017a,b). After the skulls were exposed, double‐guide cannulas were bilaterally implanted into the hippocampus (AP = −2.3 mm, ML = ±1.6 mm and DV = +1.8 mm) of each mouse under aseptic conditions and cemented. The incisions were sutured, and the mice were allowed to recover for 3 days. Hippocampal infusions of AAV‐PPARα‐EGFP/AAV‐Control‐EGFP/AAV‐PPARα‐shR NA‐EGFP/AAV‐Control‐shRNA‐EGFP were performed bilaterally at a rate of 0.2 μL·min−1 (1 μL per side). CREB siRNA (2 nmol per mouse, 4457308, Ambion® In Vivo siRNA, Thermo Fisher, Waltham, MA, USA; Ambion Inc., Austin, TX, USA) or negative control siRNA (2 nmol per mouse, 4457289, Ambion In Vivo siRNA) with Invivofectamine® 2.0 (200 μM, 1377501; Invitrogen, Waltham, MA, USA) was also infused at a rate of 0.1 μL·min−1 (0.5 μL per side). A few mice receiving CREB siRNA infusion + CSDS died (Supporting Information Table S1).
To produce AAV‐PPARα‐EGFP, the coding regions of PPARα were amplified from C57BL/6J mice cDNA by PCR and cloned into pAOV‐CAG‐EGFP‐2A‐MCS‐3FLAG. The vector was confirmed by sequencing. The recombinant plasmids were then packaged into AAV2/8 particles (AAV2 ITRs, AAV8 capsid) together with AAV helper plasmid (pAAV helper) and AAV Rep/Cap expression plasmid and purified by an iodixanol step‐gradient ultracentrifugation method. All these procedures were conducted by Neuron Biotech Co., Ltd (Shanghai, China). The titres of recombinant AAV supernatant were determined by quantitative PCR: AAV‐PPARα‐EGFP, 1.04 × 10¹³ (genome copies mL−1); AAV‐AAV‐Control‐EGFP, 6.00 × 10¹². They were diluted to 5 × 10¹² before the experiments.
To produce AAV‐PPARα‐shRNA‐EGFP, shRNA for PPARα was cloned into pAKD‐CMV‐bGlobin‐eGFP‐H1‐shRNA and confirmed by sequencing. The recombinant plasmids were then treated as mentioned above using a triple‐transfection, helper‐free method and purified. All these procedures were performed by Genechem Co., Ltd (Shanghai, China). The titres of virus were determined using quantitative PCR: AAV‐PPARα‐shRNA‐EGFP, 8.34 × 10¹² (genome copies mL−1); AAV‐Control‐shRNA‐EGFP, 1.19 × 10¹³. They were diluted to 5 × 10¹² before the experiments. The sequences for PPARα‐shRNA and scrambled control‐shRNA were 5′‐AGAAATTCTTACCTGTGAA‐3′ and 5′‐TTCTCCGAACGTGTCACGT‐3′ respectively.
Quantitative real‐time RT‐PCR detection
PPARα and BDNF mRNA levels were determined by quantitative real‐time RT‐PCR (qRT‐PCR). Total RNA was isolated from tissues using TRIzol® reagent (15596026, Invitrogen). PrimeScript™ RT Master Mix (RR036A; Takara, Shiga, Japan) and SYBR® fast qPCR master mix (RR430A; Takara) were further used following the kit protocols. GAPDH was selected as internal control. Each sample was assayed in triplicate. Primers for PPARα mRNA (forward: 5′‐GGCAAGAGAATCCACGAAGC‐3′; reverse: 5′‐CGTCTTCTCGGCCATACACA‐3′), CREB mRNA (forward: 5′‐AGCTGGCTAACAATGGTACGG‐3′; reverse: 5′‐CCTCTCTCTTCCGTGCTGCT‐3′), BDNF mRNA (forward: 5′‐GACAAGGCAACTTGGCCTAC‐3′; reverse: 5′‐CCTGTCACACACGCTCAGCTC‐3′) (Wang et al., 2017a,b) and GAPDH mRNA (forward: 5′‐ACATTGTTGCCATCAACGAC‐3′; reverse: 5′‐ACGCCAGTAGACTCCACGAC‐3′) were provided by Sangon Biotech (Shanghai, China). The threshold cycle (CT) was defined as the fractional cycle number at which fluorescence passed the fixed threshold. The relative expression levels of PPARα mRNA and BDNF mRNA were normalized to that of GAPDH and calculated using the △△CT method.
Western blotting analysis
Western blotting was performed according to a protocol used in other reports (Zhai et al., 2013; Qin et al., 2015; Liu et al., 2016, 2017a,b; Han et al., 2017; Huang et al., 2017; Zhang et al., 2017; Wang et al., 2017a, 2017b). Primary antibodies against PPARα (ab8934, 1:500; Abcam, Cambridge, UK), BDNF (sc‐20981, 1:200; Santa Cruz Biotechnology, Inc., Santa Cruz, CA, USA) and GAPDH (2118S, 1:2000; Cell Signaling, Danvers, MA, USA) were used. GAPDH was selected as internal control.
Immunohistochemical analysis
As previously shown (Jiang et al., 2015a; Jiang et al., 2015b; Jiang et al., 2017; Wang et al., 2017a,b), mice were anaesthetized and then perfused transcardially with 0.01 M PBS containing 4% paraformaldehyde. The brains were separated, post‐fixed (24 h) and dehydrated in 30% sucrose solution. Afterwards, hippocampal sections (25 μm) were cut, using a freezing microtome (Leica, Wetzlar, Germany). For hippocampal PPARα/neuronal nuclei (NeuN) co‐staining, the sections were treated as follows: (i) incubation in 0.3% Triton X‐100 for 30 min, (ii) incubation in 3% BSA for 30 min, (iii) incubation with rabbit anti‐PPARα (ab8934, 1:100; Abcam) and mouse anti‐NeuN (MAB377, 1:100; Millipore, Burlington, MA, USA) antibodies overnight at 4°C, (iv) washing, (v) incubation with FITC‐conjugated anti‐rabbit and rhodamine‐conjugated anti‐mouse secondary antibodies (1:50; Thermo Fisher, Waltham, MA, USA) for 2 h at room temperature, (vi) washing and (vii) coverslipping and observation.
For hippocampal doublecortin (DCX) staining, the procedures were the same as mentioned above, except for incubation with anti‐DCX antibody (4604S, 1:100; Cell Signaling) and FITC‐conjugated anti‐rabbit secondary antibody respectively.
For hippocampal NeuN/Brdu co‐labelling, mice were injected with Brdu (4 × 75 mg·kg−1 at 2 h intervals day−1) for 2 days, then anaesthetized and perfused after 28 days. After post‐fixing and dehydration, hippocampal sections of 25 μm were collected and treated as follows: (i) incubation in 50% formamide/2× SSC at 65°C for 2 h, (ii) incubation in 2 N HCl at 37°C for 30 min, (iii) incubation in 0.1 M boric acid buffer (pH 8.5) at room temperature for 10 min, (iv) incubation in 0.3% Triton X‐100 for 30 min, (v) incubation in 3% BSA for 30 min, (vi) incubation with mouse anti‐Brdu (11170376001, 2 μg·mL−1; Roche, Basel, Switzerland) and rabbit anti‐NeuN (ab177487, 1:500; Abcam) antibodies overnight at 4°C, (vii) washing, (viii) incubation with FITC‐conjugated anti‐rabbit and rhodamine‐conjugated anti‐mouse secondary antibodies (1:50; Thermo Fisher) at room temperature for 2 h, (ix) washing and (x) coverslipping and observation.
Chromatin immunoprecipitation
PPARα recruitment to CREB promoter in hippocampus was detected using Magna chromatin immunoprecipitation (ChIP)™ (17‐10460; Millipore) according to the manufacturer's protocol. Briefly, fresh hippocampus tissues were collected, washed and cut into small pieces in PBS. After incubation in 1% formaldehyde‐containing PBS for 15 min at room temperature, glycine was used to quench excess formaldehyde (5 min at room temperature). The cross‐linked tissues were washed, resuspended in PBS and homogenized. The homogenates were centrifuged to pellet cells, and the cell pellets were resuspended in nuclei isolation buffer for 15 min on ice to release the cross‐linked proteins/DNA and then centrifuged. The cell lysates were resuspended in sonication/ChIP/wash (SCW) buffer containing protease inhibitors, then sonicated in an ice‐water mixture to shear DNA, and centrifuged. The supernatant was collected as ChIP sample, and 50 μL of aliquots was separated as DNA input control. To assay CREB DNA in the input control, the following primers were used: 5′‐AGCTGGCTAACAATGGTACGG‐3′ (forward), 5′‐CCTCTCTCTTCCGTGCTGCT‐3′ (reverse). The product size was predicted to be 110 bp.
ChIP samples (50 μL) were incubated with Magna ChIP protein A/G beads and ChIP‐validated PPARα antibody (ab97609, 1:50; Abcam)/control IgG antibody (ab18413, 1:50; Abcam) overnight at 4°C (rotating) to perform immunoprecipitation assay. After being centrifuged, the supernatant was removed, and the beads were washed with SCW buffer twice and then low stringency IP buffer and finally resuspended in ChIP elution buffer containing protease inhibitors. Next, the resuspended bead samples were incubated in a thermomixer at 65°C (2 h) and then 95°C (15 min) and centrifuged again. The supernatant containing immunoprecipitated DNA was collected as the final sample. The ChIP assays addressing PPARα recruitment to the peroxisome proliferator response element (PPRE) in CREB gene were analyzed by semi‐quantitative/quantitative PCR using the following primers: 5′‐TGGAACTCGGAAAGGAGCTTAAGGA‐3′ (sense), 5′‐CGAGAACCC.
ACGTGGTAGAAAGGAGAGAA‐3′ (antisense) (Roy et al., 2013). The product size was predicted to be 144 bp.
Data and statistical analysis
The data and statistical analysis comply with the recommendations on experimental design and analysis in pharmacology (Curtis et al., 2015). All results are presented as means ± SEM. The comparisons between groups were performed using one‐way ANOVA followed by post hoc least significant difference test, or two‐way ANOVA followed by post hoc Bonferroni's test. The post hoc tests were only applied when the results of ANOVA were significant (P < 0.05). In the Figures, differences between group means were considered statistically significant when P<0.01.
Materials
Fluoxetine and 5‐bromo‐2‐deoxyuridine (Brdu) were purchased from Sigma (St. Louis, MO, USA) and dissolved in 0.9% saline. http://www.guidetopharmacology.org/GRAC/LigandDisplayForward?ligandId=336 was purchased from Target Mol (Boston, MA, USA) and dissolved in normal saline containing 1% DMSO. http://www.guidetopharmacology.org/GRAC/LigandDisplayForward?ligandId=3440 and http://www.guidetopharmacology.org/GRAC/LigandDisplayForward?ligandId=2655 were purchased from Tocris Bioscience (Bristol, UK) and dissolved in artificial CSF (ACSF) containing 1% DMSO. Chicken anti‐BDNF‐neutralizing antibody (G1641) and control chicken IgY antibody (G1161) were purchased from Promega (Madison, WI, USA) and dissolved in ACSF. The doses of fluoxetine (20 mg·kg−1), Brdu (75 mg·kg−1), K252a (25 μg·kg−1), GW6471 (2 μg per mouse), MK886 (2 μg per mouse) and chicken anti‐BDNF antibody (60 ng per mouse) were chosen based on previous publications (Jiang et al., 2015a; Jiang et al., 2015b; Jiang et al., 2017; Wang et al., 2017a,b). Fluoxetine, Brdu and K252a were i.p. injected in a volume of 10 mL·kg−1. GW6471, MK886, chicken anti‐BDNF antibody and chicken IgY antibody were i.c.v. infused.
Nomenclature of targets and ligands
Key protein targets and ligands in this article are hyperlinked to corresponding entries in http://www.guidetopharmacology.org, the common portal for data from the IUPHAR/BPS Guide to PHARMACOLOGY (Harding et al., 2018), and are permanently archived in the Concise Guide to PHARMACOLOGY 2017/18 (Alexander et al., 2017a,b).
Results
Chronic stress significantly decreased the expression and function of PPARα in the hippocampus
As the first step of this study, the CSDS model of depression was established. The C57BL/6J mice subjected to CSDS showed significantly less sucrose preference and social interaction than those of control mice (Figure 1A), showing depressive‐like behaviours, as reported earlier (Wook Koo et al., 2016; Bondar et al., 2017). We then used Western blotting to evaluate the effects of CSDS on PPARα expression in hippocampus, mPFC, amygdala, NAc, VTA and hypothalamus, which are all related with depression. Chronic stress clearly decreased the protein expression of PPARα in hippocampus but not in the other regions assayed (Figure 1B). Likewise, qRT‐PCR showed that chronic stress fully down‐regulated the level of PPARα mRNA only in hippocampus (Supporting Information Figure S1A). Also, nuclear PPARα distribution in hippocampus after CSDS was observed by immunohistochemistry, with NeuN as the nuclear marker. Under CSDS, PPARα distributions in CA1, CA3 and dentate gyrus (DG) sub‐regions all significantly decreased and appeared to be vacuolated, especially in DG (Figure 1C–E). Moreover, by using ChIP, we found that chronic stress also reduced the recruitment of PPARα to the CREB promoter in the hippocampus (Supporting Information Figure S1C, S1D). Therefore, hippocampal PPARα appears to be involved in depression.
Figure 1.

Repeated CSDS significantly decreased the PPARα protein expression in hippocampus. (A) CSDS induced notable depressive‐like behaviours in C57BL/6J mice, manifested as anhedonia and social avoidance (n = 10). (B) Representative Western blotting images showing the effects of CSDS on PPARα protein expressions in different brain regions. The images are shown as n = 3 for each group, while in total, samples from five mice were processed. (C–E) Representative immunohistochemical images showing the effects of CSDS on nuclear PPARα distribution in CA1, CA3 and DG subregions (n = 5). Scale bars: 150 μm for representative images and 37.5 μm for enlarged images. All results are shown as means ± SEM. ** P < 0.01; significantly different as indicated; n.s., no significance; one‐way ANOVA followed by the least significant difference test.
Genetic overexpression of hippocampal PPARα induced strong antidepressant‐like effects in mice
As the second step of this study, AAV‐PPARα‐EGFP was used to overexpress hippocampal PPARα. The expression of AAV‐PPARα‐EGFP was stable on 14th day after stereotaxic injection, and its efficacy was confirmed (Figure 2A). To test whether targeting hippocampal PPARα exerted antidepressant‐like effects in mice, the forced swimming test (FST) and the tail suspension test (TST), two behavioural assays widely used to detect potential antidepressant‐like activities, were first conducted. Briefly, naive C57BL/6J mice were treated with AAV‐PPARα‐EGFP, and FST or TST was performed 14 days later (Figure 2B). Hippocampal PPARα overexpression significantly decreased the immobility of mice in both FST and TST, compared with that of control mice (Figure 2C, D), whereas AAV‐Control‐EGFP had no such effects. To exclude the possible effects of enhanced locomotor activity, the locomotor activity test was also carried out. As shown in Figure 2E, hippocampal PPARα overexpression did not influence the spontaneous locomotor activity of mice.
Figure 2.

Hippocampal PPARα overexpression exerted significant antidepressant‐like effects in mice. (A) Fluorescence of a fixed brain section that expressed AAV‐PPARα‐EGFP, given by stereotactic injection into the hippocampus. Scale bar: 400 μm for representative image and 50 μm for enlarged image. Representative Western blotting images that showed the overexpressing efficacy of AAV‐PPARα‐EGFP. The images are shown as n = 2 for each group, while in total, samples from four mice were processed. (B) Schematic timeline of experimental procedures. (C–E) Hippocampal PPARα overexpression by AAV‐PPARα‐EGFP induced strong antidepressant‐like actions in FST and TST, without influencing the locomotor activity of mice (n = 10). (F and G) Hippocampal PPARα overexpression by AAV‐PPARα‐EGFP fully antagonized the attenuating effects of CSDS on the sucrose preference and social interaction in mice (n = 10). (H) Representative Western blotting images showing that AAV‐PPARα‐EGFP completely restored the down‐regulatory effects of CSDS on hippocampal PPARα and BDNF expressions (n = 5). All results are shown as means ± SEM. ** P < 0.01; significantly different as indicated; n.s., no significance; for (C–E), one‐way ANOVA followed by least significant difference test, for (F–H), two‐way ANOVA followed by Bonferroni's test. i.h., intrahippocampal.
Then, AAV‐PPARα‐EGFP was used to overexpress and to restore the decreased hippocampal PPARα expression in CSDS‐stressed mice. Briefly, the stressed mice were infused with AAV‐PPARα‐EGFP, and behavioural tests were performed after 14 days (Figure 2B). AAV‐Control‐EGFP infusion did not affect the behaviours of mice, but AAV‐PPARα‐EGFP fully reversed the anhedonia and social avoidance behaviours of CSDS‐stressed mice (Figure 2F, G), revealing a notable antidepressant‐like effect. In addition, AAV‐PPARα‐EGFP did not influence the sucrose preference or social interaction of naive control mice (Figure 2F, G). After the behavioural tests, we also examined the expression and distribution of hippocampal PPARα in all groups. Consistently, treatment with AAV‐PPARα‐EGFP completely restored the negative effects of CSDS on PPARα in CA1, CA3 and DG regions (Figure 3) and also fully reversed CSDS‐induced effects on hippocampal PPARα recruitment to the CREB promoter (Supporting Information Figures S2A, S2B).
Figure 3.

Representative microscopic images of immunohistochemical data which showed the effects of AAV‐PPARα‐EGFP on nuclear PPARα distribution in (A) CA1, (B) CA3 and (C) DG of CSDS‐stressed mice (n = 5). Scale bar: 150 μm.
It is well established that depression is often accompanied by down‐regulated BDNF expression and neurogenesis in the hippocampus (Jacobs et al., 2000; Kempermann and Kronenberg, 2003; Krishnan and Nestler, 2008). Therefore, Western blotting and immunohistochemistry were carried out again. To observe hippocampal neurogenesis, the hippocampal DCX labelling and NeuN/Brdu co‐labelling experiments were performed to evaluate neuronal proliferation and differentiation respectively. Here, hippocampal PPARα overexpression not only exerted antidepressant‐like effects in mice but also fully restored chronic stress‐induced attenuation of BDNF expression and neurogenesis. CSDS + AAV‐PPARα‐EGFP mice showed a marked increase in hippocampal BDNF protein and mRNA, and in the numbers of DCX+ cells and NeuN+/Brdu+ cells in DG, compared with those of CSDS‐stressed mice (Figures 2H and 4 and Supporting Information Figure S2C). Furthermore, AAV‐PPARα‐EGFP treatment elevated hippocampal BDNF expression but not neurogenesis in naive control mice (Figures 2H and 4 and Supporting Information Figure S2C). In contrast, treatment with AAV‐Control‐EGFP did not have these effects. In combination with our previous studies, it would appear that hippocampal PPARα may be a molecular target for treating depression.
Figure 4.

Hippocampal PPARα overexpression fully reversed the down‐regulatory effects of CSDS on hippocampal neurogenesis. (A) Representative confocal microscopic images showed the localization of DCX (green) in DG. Scale bar: 150 μm for representative images and 75 μm for enlarged images. Quantitative analysis indicated that AAV‐PPARα‐EGFP significantly increased the number of DCX+ cells in DG of the stressed mice (n = 5). (B) Representative microscopic images showed the co‐staining (yellow) of NeuN (green) and Brdu (red) in DG. Scale bar: 150 μm for representative images and 75 μm for enlarged images. Quantitative analysis revealed that AAV‐PPARα‐EGFP fully reversed CSDS‐induced decrease of NeuN+/Brdu+ cells number in DG (n = 5). All results are shown as means ± SEM. ** P < 0.01; significantly different as indicated; n.s., no significance; two‐way ANOVA followed by post hoc Bonferroni's test.
CREB‐mediated BDNF biosynthesis underlies the antidepressant‐like actions of hippocampal PPARα overexpression
Subsequently, we explored whether hippocampal PPARα activation had antidepressant effects. We postulated that PPAR‐α‐mediated CREB activation and CREB‐mediated BDNF biosynthesis were involved. Thus, CREB siRNA, K252a and anti‐BDNF antibody were used to block the functions of hippocampal CREB and BDNF respectively. Figure 5B shows the efficacy of CREB siRNA. CREB siRNA and AAV‐PPARα‐EGFP, when used together, did not influence each other (Figure 5C). Naive C57BL/6J mice were co‐treated with AAV‐PPARα‐EGFP and CREB siRNA, followed by FST or TST (Figure 5A). CREB siRNA treatment alone moderately increased the immobility of mice, while co‐administration completely prevented the AAV‐PPARα‐EGFP‐induced reduction of immobility in FST and TST (Figure 5D, E). Moreover, CSDS‐stressed mice were co‐treated with AAV‐PPARα‐EGFP and CREB siRNA (Figure 5A). As demonstrated by the behavioural data, CREB siRNA co‐administration also abolished the enhancing effects of AAV‐PPARα‐EGFP on the sucrose preference and social interaction of the stressed mice (Figure 5F, G).
Figure 5.

Hippocampal CREB KD abolished the antidepressant‐like effects of AAV‐PPARα‐EGFP in mice. (A) Schematic timeline of experimental procedures. (B and C) Representative Western blotting images that showed not only the silencing efficacy of CREB siRNA on hippocampal CREB expression but also that CREB siRNA and AAV‐PPARα‐EGFP did not influence each other (n = 4). (D and E) Hippocampal CREB KD by CREB siRNA abolished the antidepressant‐like actions of AAV‐PPARα‐EGFP in FST and TST (n = 10). (F and G) Hippocampal CREB KD by CREB siRNA completely blocked the reversal effects of AAV‐PPARα‐EGFP on CSDS‐induced depressive‐like behaviours in mice, manifested as anhedonia and social avoidance (n = 10). All results are shown as means ± SEM. ** P < 0.01; significantly different as indicated; n.s., no significance; two‐way ANOVA followed by Bonferroni's test. i.h., intrahippocampal.
Supporting Information Figure S3 illustrates the results obtained with K252a in our experimental model. Naive C57BL/6J mice were co‐treated with AAV‐PPARα‐EGFP and K252a, followed by FST or TST (Supporting Information Figure S3A). K252a alone did not affect the immobility of mice, whereas co‐administration significantly attenuated the antidepressant‐like effects of AAV‐PPARα‐EGFP in FST and TST (Supporting Information Figure S3B, C). Also, CSDS‐stressed mice were co‐treated with AAV‐PPARα‐EGFP and K252a (Supporting Information Figure S3A). K252a significantly blocked the antidepressant‐like effects of AAV‐PPARα‐EGFP in the CSDS model of depression, in terms of sucrose preference and social interaction (Supporting Information Figure S3D, E).
Figure 6 shows the anti‐BDNF antibody results. Naive C57BL/6J mice were co‐treated with AAV‐PPARα‐EGFP and anti‐BDNF antibody, followed by FST or TST (Figure 6A). As observed with CREB siRNA, infusion of anti‐BDNF antibody alone enhanced the immobility of mice, consistent with previous studies (Jiang et al., 2017). Meanwhile, co‐administration fully prevented the antidepressant‐like effects of AAV‐PPARα‐EGFP in FST and TST (Figure 6B, C). Also, CSDS‐stressed mice were co‐treated with AAV‐PPARα‐EGFP and anti‐BDNF antibody (Figure 6A). As expected, infusion of anti‐BDNF antibody completely blocked the antidepressant‐like effects of AAV‐PPARα‐EGFP on the stressed mice (Figure 6D, E).
Figure 6.

Blockade of BDNF function by infusion of anti‐BDNF antibody totally prevented the antidepressant‐like effects of AAV‐PPARα‐EGFP in mice. (A) Schematic timeline of experimental procedures. (B and C) Anti‐BDNF antibody effectively prevented the AAV‐PPARα‐EGFP‐induced decrease of immobility of mice in FST and TST (n = 9–10). (D and E) Anti‐BDNF antibody also completely blocked the AAV‐PPARα‐EGFP‐induced enhancement of sucrose preference and social interaction in CSDS‐stressed mice (n = 9–10). All results are shown as means ± SEM. ** P < 0.01; significantly different as indicated; n.s., no significance; two‐way ANOVA followed by Bonferroni's test. i.h., intrahippocampal.
Fluoxetine administration fully reversed chronic stress‐induced effects on the expression and function of hippocampal PPARα
Fluoxetine is the most commonly used antidepressant in clinical practice, as an SSRI. Although fluoxetine increases extracellular 5‐HT concentration relatively rapidly, it always takes weeks to months of administration to have antidepressant effects, so there may be other antidepressant targets. Here, we investigated the possible role of hippocampal PPARα. CSDS‐stressed mice received 14 days of fluoxetine injection, and the behavioural results confirmed the effects of fluoxetine on sucrose preference and social interaction (Figure 7A). As suggested by Western blotting and immunohistochemistry, fluoxetine did not affect hippocampal PPARα expression in naive mice, but significantly reversed the CSDS‐induced decrease in such expression (Figure 7B–E). Moreover, fluoxetine administration significantly increased the levels of PPARα mRNA (Supporting Information Figure S1B) and PPARα‐PPRE (CREB) binding (Supporting Information Figures S1E and S1F) in the hippocampus of the stressed mice, but not naive mice (Figure 7B–E). Thus, the antidepressant effects of fluoxetine in our model appeared to involve hippocampal PPARα.
Figure 7.
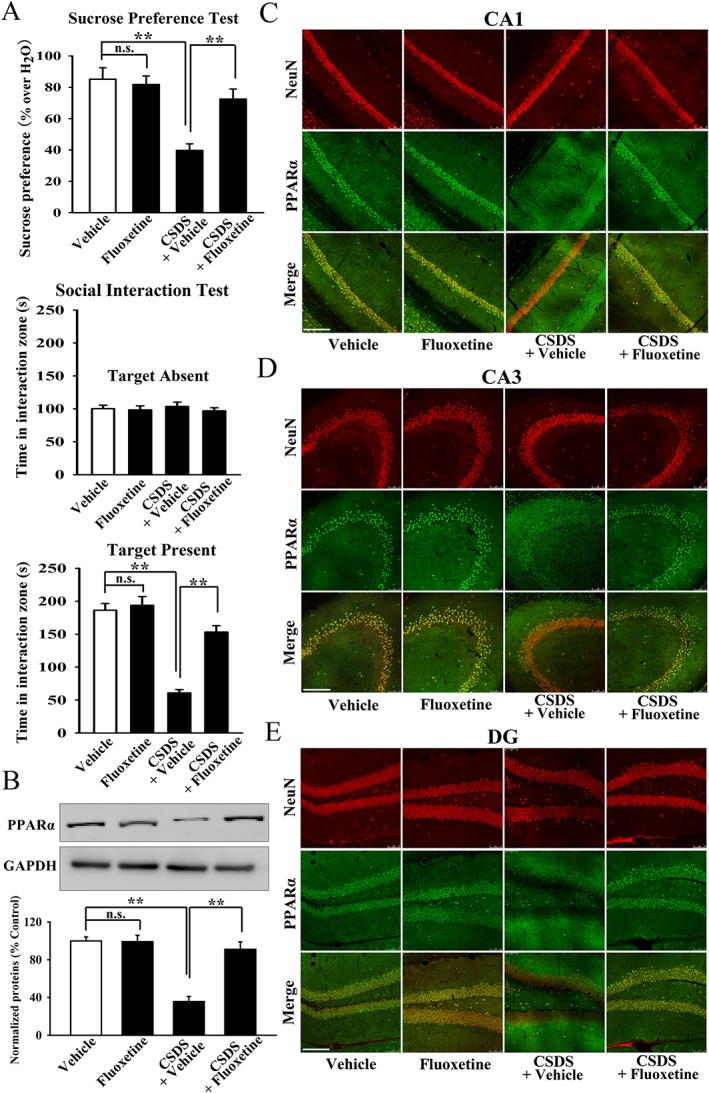
Reversal effects of fluoxetine on the protein expression of hippocampal PPARα in the stressed mice. (A) Fluoxetine administration fully restored CSDS‐induced depressive‐like behaviours in mice (n = 10). (B) Representative Western blotting images that indicated the effects of fluoxetine on hippocampal PPARα expression in CSDS‐stressed and naïve mice (n = 5). (C–E) Representative immunohistochemical images that showed the effects of fluoxetine on nuclear PPARα distribution in CA1, CA3 and DG of stressed and naive mice (n = 5). Scale bar: 150 μm. All results are shown as means ± SEM. ** P < 0.01; significantly different as indicated; n.s., no significance; two‐way ANOVA followed by Bonferroni's test.
Pharmacological blockade of PPARα significantly antagonized the antidepressant effects of fluoxetine in mice
Next, two selective PPARα antagonists, GW6471 and MK886, were used. CSDS‐stressed mice were co‐treated with fluoxetine and GW6471 (Supporting Information Figure S4A), and this co‐administration totally prevented the reversal by fluoxetine of the depressive‐like behaviours (sucrose preference and social interaction) of the stressed mice (Supporting Information Figure S4D, E). GW6471 pretreatment also significantly attenuated fluoxetine‐induced decrease in the immobility of naive mice in both FST and TST, while its infusion alone did not affect the immobility results (Supporting Information Figure S4B, C). Additionally, GW6471 co‐treatment significantly reduced the restoring effects of fluoxetine on hippocampal PPARα and BDNF expression in the stressed mice (Supporting Information Figure S4F). Supporting Information Figure S5 shows the results with MK886. As observed with GW6471, MK886 fully reversed the antidepressant effects of fluoxetine in FST and TST, as well as on the CSDS model of depression, and hippocampal PPARα and BDNF expression (Supporting Information Figure S5). In addition, both GW6471 and MK886 attenuated the reversal effects of fluoxetine on hippocampal PPARα mRNA (Supporting Information Figures S6A and S6C), BDNF mRNA (Supporting Information Figure S6B and S6D) and PPARα‐PPRE (CREB) binding (Supporting Information Figures S7A‐S7D), in the stressed mice.
PPARα knockout abolished the antidepressant actions of fluoxetine in mice
PPARα‐KO mice from Jackson Laboratory were used, and their validity was confirmed (Supporting Information Figure S8). Firstly, both WT and PPARα‐KO mice received single injections of fluoxetine, followed by FST or TST. As shown in Figure 8A, B, PPARα‐KO mice have much higher immobility than that of WT mice in both FST and TST, showing depressive‐like behaviours. PPARα‐KO did not affect the locomotor activity of mice (Supporting Information Figure S9). Particularly, although fluoxetine reduced the immobility of WT mice, it had no influence on PPARα‐KO mice in FST and TST (Figure 8A, B). Secondly, both WT and PPARα‐KO mice were subjected to CSDS and then treated for 14 days with fluoxetine. Such chronic fluoxetine administration prevented CSDS‐induced anhedonia and social avoidance behaviours in WT mice but not PPARα‐KO mice (Figure 8C, D). Additionally, the stressed PPARα‐KO mice displayed even less sucrose preference and social interaction than those of the stressed WT mice (Figure 8C, D), implying that PPARα‐KO rendered mice more susceptible to chronic stress. There were no significant differences in the sucrose preference and social interaction between PPARα‐KO and WT mice (Figure 8C, D). Lastly, the hippocampal BDNF expression in all groups was assessed by Western blotting. As shown in Figure 8E, PPARα‐KO mice have much less BDNF in the hippocampus than WT mice, accounting for their depressive‐like behaviours in FST and TST. Meanwhile, fluoxetine restored CSDS‐induced reduction of hippocampal BDNF expression in WT mice but not PPARα‐KO mice (Figure 8E), consistent with the results shown in Figure 8C, D. Taken together, PPARα‐KO abolished the antidepressant effects of fluoxetine in mice.
Figure 8.

Hippocampal PPARα KO abolished the antidepressant effects of fluoxetine in mice. (A) Effects of fluoxetine on WT and PPARα‐KO mice in FST (n = 10). (B) Effects of fluoxetine on WT and PPARα‐KO mice in TST (n = 10). (C) Fluoxetine administration reversed CSDS‐induced decrease of sucrose preference in WT mice but not PPARα‐KO mice (n = 10). (D) Fluoxetine treatment restored CSDS‐induced decrease of social interaction in WT mice but not PPARα‐KO mice (n = 10). (E) Representative Western blotting images that showed the effects of fluoxetine and CSDS on hippocampal BDNF expression in WT and PPARα‐KO mice (n = 6). All results are shown as means ± SEM. ** P < 0.01; significantly different as indicated; n.s., no significance; two‐way ANOVA followed by Bonferroni's test.
Hippocampal PPARα knockdown fully blocked the antidepressant effects of fluoxetine in mice
Furthermore, we used AAV‐PPARα‐shRNA‐EGFP to specifically knockdown PPARα in the hippocampus, and the effects were confirmed (Figure 9A). PPARα knockdown (KD) down‐regulated BDNF expression and neurogenesis in the hippocampus (Figure 9A and Supporting Information Figure S10A, B). We examined whether hippocampal PPARα‐KD affected the effects of fluoxetine in the FST and TST (Figure 9B). As shown in Figure 9C, D, control‐shRNA did not affect the results, whereas hippocampal PPARα‐KD significantly enhanced the immobility of naive mice, representing a pro‐depressant effect. Interestingly, PPARα‐shRNA abolished the antidepressant effects of fluoxetine in both FST and TST (Figure 9C, D). We then subjected the PPARα‐KD mice to CSDS and fluoxetine administration (Figure 9B). Hippocampal PPARα‐KD completely prevented the reversal by fluoxetine of mouse behaviours in the CSDS model of depression, assaying sucrose preference and social interaction (Figure 9E, F). PPARα‐shRNA did not affect the sucrose preference or social interaction in naive mice (Supporting Information Figure S10C, D). Finally, the promoting effects of fluoxetine on hippocampal BDNF expression in CSDS‐stressed mice were also abolished by PPARα‐shRNA (Figure 9G). Collectively, the PPARα‐KD and PPARα‐KO results were consistent with the suggestion that hippocampal PPARα mediated the antidepressant actions of fluoxetine.
Figure 9.

Hippocampal PPARα KD also abolished the antidepressant actions of fluoxetine in mice. (A) Fluorescence of a fixed brain section that expressed AAV‐PPARα‐shRNA‐EGFP in the hippocampus after its stereotactic injection. Scale bar: 400 μm for representative image and 50 μm for enlarged image. Representative Western blotting images that showed not only the silencing efficacy of AAV‐PPARα‐shRNA‐EGFP but also that AAV‐PPARα‐shRNA‐EGFP significantly decreased the expression of hippocampal BDNF in naive mice. The images are shown as n = 2 for each group, while in total, samples from four mice were processed. (B) Schematic timeline of experimental procedures. (C and D) Hippocampal PPARα KD by PPARα‐shRNA fully blocked the attenuating effects of fluoxetine on the immobility of mice in FST and TST (n = 10). (E and F) Hippocampal PPARα KD by PPARα‐shRNA markedly prevented the protective effects of fluoxetine on CSDS‐induced anhedonia and social avoidance behaviours in mice (n = 10). (G) Representative Western blotting images that revealed that PPARα‐shRNA strongly antagonized the enhancing effects of fluoxetine on hippocampal BDNF expression in CSDS‐stressed mice (n = 6). All results are shown as means ± SEM. ** P < 0.01; significantly different as indicated; n.s., no significance; two‐way ANOVA followed by Bonferroni's test. i.h., intrahippocampal.
Discussion
Although PPARα has been implicated in depression, to our knowledge, this study has provided the first evidence directly supporting the role of PPARα in depression. The highlights of this study are as follows: (i) chronic stress significantly decreased the expression and function of PPARα in the hippocampus but not in other related regions; (ii) targeting hippocampal PPARα directly exerted strong antidepressant‐like effects, which were regulated by promoting CREB‐mediated BDNF biosynthesis; and (iii) fluoxetine required hippocampal PPARα in order to exert its antidepressant effects, further demonstrating the potential of PPARα as a novel antidepressant target.
To observe the effects of chronic stress on central PPARα exactly and objectively, we used various biotechnological methods including Western blotting, qRT‐PCR and immunohistochemistry and obtained consistent results. qRT‐PCR showed that stress down‐regulated hippocampal PPARα at the transcriptional level. The immunofluorescence results indicated that chronic stress induced global changes of hippocampal PPARα distribution. As a nuclear receptor, PPARα has the main physiological function of modulating the transcriptional activities of some genes, including those for Glut1, CREB, Mogat1 and HO‐1, by binding PPREs (Roy et al., 2013; Sankella et al., 2016; Wu et al., 2016; You et al., 2017). Among these genes, CREB is well known to participate in depression (Blendy, 2006; Gass and Riva, 2007; Krishnan and Nestler, 2008). Thus, we also assessed the effects of chronic stress on hippocampal PPARα‐PPRE (CREB) binding using ChIP. So far, it remains unclear why chronic stress does not have effects on PPARα in brain regions other than the hippocampus, and further studies are required. Furthermore, the vacuolated distribution of nuclear PPARα in the stressed mice implied that under depressive condition, hippocampal PPARα was located in the peripheral area of the nucleus and thus less likely to be contact with the CREB genome, which could explain the ChIP results.
The AAV‐PPARα‐EGFP results directly supported that hippocampal PPARα was a feasible antidepressant target. In contrast, the behaviours of PPARα‐KO mice and PPARα‐KD mice suggested that deficiency of hippocampal PPARα promoted depression. Accordingly, PPARα participates in depression both positively and negatively. Perhaps using one model (CSDS) of depression is not enough, and we will assess more models, such as chronic unpredictable mild stress (CUMS) and chronic restraint stress, in further studies.
How does hippocampal PPARα play a role in the pathophysiology of depression? It appears to be most likely that PPARα regulated depression through CREB‐mediated BDNF biosynthesis. Western blotting showed that PPARα hyperfunction significantly elevated the expression of hippocampal BDNF, whereas PPARα hypofunction sharply decreased such level. Notably, after the CREB‐BDNF pathway was blocked by CREB siRNA, K252a or anti‐BDNF antibody, targeting PPARα no longer had antidepressant effects. The neurobiology of depression is rather complex and involves many factors like BDNF, CREB, 5‐HT and mTOR (Blendy, 2006; Krishnan and Nestler, 2008; Jernigan et al., 2011; Albert et al., 2012), so it is likely that other mechanisms may also participate in the antidepressant actions mediated by PPARα. We also examined hippocampal neurogenesis. Although hippocampal neurogenesis was mainly used as a biological index to evaluate antidepressant efficacy in this study, the related results suggested that PPARα was able to modulate neurogenesis, extending the knowledge of its physiological functions. PPARα may modulate neurogenesis via two pathways: one is direct enhancement of the transcriptional activities of pro‐neurogenic factors, such as Sox2, Pax6 and NeuroD1, by binding PPREs (Beckervordersandforth et al., 2015), and the other is indirect mediation by promoting the biosynthesis of BDNF, because the correlation between BDNF and neurogenesis is well established (Lee and Son, 2009).
To explore whether hippocampal PPARα was necessary for the effects of fluoxetine, we performed experiments from both positive and negative aspects. From the positive aspect, we used various biotechnological methods to evaluate the effects of fluoxetine on hippocampal PPARα under depressive condition. From the negative aspect, we employed multiple interfering/blocking measures, including pharmacological and genetic procedures, to test whether fluoxetine still had antidepressant actions, when PPARα was deficient. As expected, fluoxetine notably restored the inhibitory effects of CSDS on hippocampal PPARα, while both pharmacological and genetic blockade of PPARα prevented the antidepressant efficacy of fluoxetine. Regarding the mechanisms by which fluoxetine affects PPARα, one possibility is that fluoxetine directly binds and activates PPARα, functioning as an exogenous ligand (like WY14643, simvastatin and fibrates), which needs to be further validated using time‐resolved FRET, electrospray ionization MS and in silico structural analysis (Roy et al., 2015). The other possibility is that fluoxetine increases the concentration of extracellular 5‐HT and thus indirectly activates PPARα via a 5‐HT‐mediated signalling pathway. However, the connection between PPARα and any 5‐HT‐mediated signalling has not been confirmed so far. Nevertheless, our findings extend the knowledge of the pharmacological actions of fluoxetine and it is possible that, like the fibrates, fluoxetine has protective effects on atherosclerosis by activating hepatic PPARα to reduce serum lipids. Here, we only investigated fluoxetine, as an example of a clinically used antidepressant, in this study. If hippocampal PPARα is also necessary for the effects of other antidepressants, such as http://www.guidetopharmacology.org/GRAC/LigandDisplayForward?ligandId=7321, http://www.guidetopharmacology.org/GRAC/LigandDisplayForward?ligandId=4790 and http://www.guidetopharmacology.org/GRAC/LigandDisplayForward?ligandId=7241, it can be an exact antidepressant target. Further in‐depth studies are ongoing in our group.
Until now, the role of PPARα in the CNS has been extensively studied. PPARα is a promising therapeutic target for several neurodegenerative disorders, including Parkinson's disease, Alzheimer's disease, Huntington disease and amyotrophic lateral sclerosis (Agarwal et al., 2017; Barbiero et al., 2014; D'Orio et al., 2018). PPARα activation significantly decreased neuronal death in models of cerebral ischaemia reperfusion and also improved the learning and memory of rodents (Gao and Li, 2012; Roy et al., 2013; Roy et al., 2015; Xuan et al., 2015). PPARα has been closely implicated in oxidative stress, neuroinflammation, neurogenesis and synaptic plasticity (Gao and Li, 2012; Roy et al., 2013; Fidaleo et al., 2014; Pérez‐Martín et al., 2016). This study provides another aspect of PPARα function. Given that PPARα is involved in so many neurological disorders and processes, we have, here, ascribed the results to its biological effects on the CREB promoter, as CREB is multifunctional in brain, controlling the transcriptional activities of many genes. Additionally, endogenous PPARα ligands, including 3‐hydroxy‐(2,2)‐dimethyl butyrate, hexadecanamide and 9‐octadecenamide (Roy et al., 2016), may also have antidepressant‐like activities, like WY14643 and fenofibrate. Also, two other members of the PPAR family, PPARhttps://en.wikipedia.org/wiki/Peroxisome_proliferator-activated_receptor_delta/δ and PPARγ, have also been correlated with depression, directly or indirectly. For example, hippocampal PPARδ overexpression repressed the stress‐induced depressive‐like behaviours (Ji et al., 2015), and decreased PPARδ expression was found in rats subjected to CUMS (Liu et al., 2017a,b). Both http://www.guidetopharmacology.org/GRAC/LigandDisplayForward?ligandId=2694 and http://www.guidetopharmacology.org/GRAC/LigandDisplayForward?ligandId=1056, two agonists of PPARγ, have potential antidepressant‐like effects (Eissa Ahmed et al., 2009; Sadaghiani et al., 2011).
In conclusion, our study demonstrated that hippocampal PPARα participated in depression, as a novel and feasible antidepressant target. The findings may provide support for the neurotrophic hypothesis of depression.
Author contributions
B.J. and W.Z. designed this study and wrote the manuscript. B.J., L.S., H.W., Y.‐J.W. and J.‐L.W. performed the experiments. Q.Z. and F.W. helped in collecting and analysing the data. All authors read and approved this manuscript.
Conflict of interest
The authors declare no conflicts of interest.
Declaration of transparency and scientific rigour
This http://onlinelibrary.wiley.com/doi/10.1111/bph.13405/abstract acknowledges that this paper adheres to the principles for transparent reporting and scientific rigour of preclinical research recommended by funding agencies, publishers and other organisations engaged with supporting research.
Supporting information
Figure S1 Effects of CSDS and fluoxetine on PPARα mRNA and PPARα recruitment to CREB promoter in hippocampus. (A) QRT‐PCR showed the effects of CSDS on PPARα mRNA level in different brain regions (n = 5). (B) QRT‐PCR also revealed the restoring effects of fluoxetine on hippocampal PPARα mRNA in CSDS‐stressed mice (n = 5). (C and D) ChIP analyses for hippocampal PPARα‐PPRE (CREB) binding followed by semi‐quantitative PCR (C) and quantitative PCR (D) were performed in naive and CSDS‐stressed mice (n = 5). (E and F) ChIP followed by semi‐quantitative PCR (E) and quantitative PCR (F) were performed in Vehicle (0.9% saline)‐treated, Fluoxetine‐treated, CSDS + Vehicle and CSDS + Fluoxetine mice (n = 5). All results were represented as means ± SEM; ** P < 0.01; n.s., no significance. For (A, C and D), Comparisons were made by one‐way ANOVA followed by LSD test. For (B, E and F), Comparisons were made by two‐way ANOVA followed by Bonferroni's test.
Figure S2 Hippocampal PPARα overexpression completely restored the inhibiting effects of CSDS on BDNF mRNA and hippocampal PPARα recruitment to CREB promoter. (A and B) ChIP followed by semi‐quantitative PCR (A) and quantitative PCR (B) revealed that AAV‐PPARα‐EGFP significantly enhanced the level of hippocampal PPARα‐PPRE (CREB) binding in CSDS‐stressed mice (n = 5). (C) QRT‐PCR showed that AAV‐PPARα‐EGFP largely promoted the level of hippocampal BDNF mRNA in CSDS‐stressed mice (n = 5). All results were represented as means ± SEM; ** P < 0.01; n.s., no significance. Comparisons were made by two‐way ANOVA followed by Bonferroni's test.
Figure S3 Blockade of BDNF function by K252a significantly attenuated the antidepressant‐like effects of AAV‐PPARα‐EGFP in mice. (A) Schematic timeline of experimental procedures. (B and C) Usage of K252a notably antagonized the decreasing effects of AAV‐PPARα‐EGFP on the immobility of mice in FST and TST (n = 10). (D and E) Also, usage of K252a fully attenuated the promoting effects of AAV‐PPARα‐EGFP on the sucrose preference and social interaction in CSDS‐stressed mice (n = 10). All results were represented as means ± SEM; * P < 0.05, ** P < 0.01; n.s., no significance. Comparisons were made by two‐way ANOVA followed by Bonferroni's test.
Figure S4 Blockade of PPARα function by GW6471 disturbed the antidepressant actions of fluoxetine in mice. (A) Schematic timeline of experimental procedures. (B and C) GW6471 infusion significantly attenuated the antidepressant actions of fluoxetine in FST and TST (n = 10). (D and E) GW6471 infusion fully prevented the reversal effects of fluoxetine on CSDS‐induced anhedonia and social avoidance behaviors in mice (n = 10). (F) Representative Western blotting images which revealed that the promoting effects of fluoxetine on hippocampal PPARα and BDNF expressions in the stressed mice were also blocked by GW6471 infusion (n = 5). All results were represented as means ± SEM; *P < 0.05, **P < 0.01; n.s., no significance. Comparisons were made by two‐way ANOVA followed by Bonferroni's test.
Figure S5 Blockade of PPARα function by MK886 interrupted the antidepressant effects of fluoxetine in mice. (A) Schematic timeline of experimental procedures. (B and C) MK886 infusion strongly attenuated the antidepressant effects of fluoxetine in FST and TST (n = 10). (D and E) MK886 infusion notably prevented the restoring effects of fluoxetine on CSDS‐induced anhedonia and social avoidance behaviors in mice (n = 10). (F) Representative Western blotting images which indicated that the enhancing effects of fluoxetine on hippocampal PPARα and BDNF expressions in the stressed mice were also antagonized by MK886 infusion (n = 5). All results were represented as means ± SEM; * P < 0.05, ** P < 0.01; n.s., no significance. Comparisons were made by two‐way ANOVA followed by Bonferroni's test.
Figure S6 QRT‐PCR revealed that blockade of PPARα function by both GW6471 (A and B) and MK886 (C and D) abolished the reversal effects of fluoxetine on hippocampal PPARα and BDNF mRNAs in CSDS‐stressed mice (n = 5). All results were represented as means ± SEM; * P < 0.05, ** P < 0.01; n.s., no significance. Comparisons were made by two‐way ANOVA followed by Bonferroni's test.
Figure S7 Both GW6471 and MK886 prevented the antidepressant effects of fluoxetine on hippocampal PPARα recruitment to CREB promoter. (A and B) ChIP followed by semi‐quantitative PCR (A) and quantitative PCR (B) showed that CSDS + Fluoxetine + GW6471 mice displayed significantly less hippocampal PPARα‐PPRE (CREB) binding than CSDS + Fluoxetine mice (n = 5). (C and D) ChIP followed by semi‐quantitative PCR (C) and quantitative PCR (D) showed that CSDS + Fluoxetine + MK886 mice also had notably less hippocampal PPARα‐PPRE (CREB) binding than CSDS + Fluoxetine mice (n = 5). All results were represented as means ± SEM; ** P < 0.01; n.s., no significance. Comparisons were made by two‐way ANOVA followed by Bonferroni's test.
Figure S8 The effectiveness and validity of PPARα‐KO mice were proved using western blotting and immunohistochemistry. (A) Representative Western blotting images which revealed that compared with WT mice, PPARα‐KO mice displayed no PPARα expression in the brain (n = 4). Homogenates of the whole brains were used. (B, C and D) Immunohistochemical analysis showed that there were no observed PPARα staining in CA1, CA3 and DG of PPARα‐KO mice, in contrast to WT mice (n = 3). Scale bar: 150 μm.
Figure S9 PPARα‐KO did not affect the locomotor activities of mice (n = 10). All results were represented as means ± SEM; n.s., no significance. Comparisons were made by one‐way ANOVA followed by LSD test.
Figure S10 Hippocampal PPARα knockdown by AAV‐PPARα‐shRNA‐EGFP notably down‐regulated hippocampal neurogenesis in naive mice. (A) Representative confocal microscopic images showed the localization of DCX (green) in DG. Scale bar: 150 μm for representative images and 75 μm for enlarged images. Quantitative analysis showed that AAV‐PPARα‐shRNA‐EGFP significantly decreased the number of DCX+ cells in DG of naive mice (n = 4). (B) Representative microscopic images showed the co‐staining (yellow) of NeuN (green) and Brdu (red) in DG. Scale bar: 150 μm for representative images and 75 μm for enlarged images. Quantitative analysis indicated that AAV‐PPARα‐EGFP fully reduced the amount of NeuN+/Brdu+ cells in DG of naive mice (n = 4). (C and D) AAV‐PPARα‐shRNA‐EGFP did not affect the behaviors of naive mice in the sucrose preference and social interaction tests (n = 8). All results were represented as means ± SEM; n.s., no significance. Comparisons were made by one‐way ANOVA followed by LSD test.
Table S1 Mice numbers (N) for each experimental group in this study.
Acknowledgements
This work was supported by grants from the National Natural Science Foundation of China to Dr Bo Jiang (no. 81401116) and Professor Wei Zhang (no. 81670243), a grant from the Natural Science Foundation of Jiangsu Province to Dr Bo Jiang (no. BK20161284) and a grant from the graduate student scientific research innovation projects of Jiangsu Province to Ying‐Jie Wang (KYCX17‐1929).
Song L., Wang H., Wang Y.‐J., Wang J.‐L., Zhu Q., Wu F., Zhang W., and Jiang B. (2018) Hippocampal PPARα is a novel therapeutic target for depression and mediates the antidepressant actions of fluoxetine in mice, British Journal of Pharmacology, 175, 2968–2987, https://doi.org/10.1111/bph.14346.
Contributor Information
Wei Zhang, Email: zhangw@ntu.edu.cn.
Bo Jiang, Email: jiangbo78099@ntu.edu.cn.
References
- Agarwal S, Yadav A, Chaturvedi RK (2017). Peroxisome proliferator‐activated receptors (PPARs) as therapeutic target in neurodegenerative disorders. Biochem Biophys Res Commun 483: 1166–1177. [DOI] [PubMed] [Google Scholar]
- Albert PR, Benkelfat C, Descarries L (2012). The neurobiology of depression‐revisiting the serotonin hypothesis. I. Cellular and molecular mechanisms. Philos Trans R Soc Lond Ser B Biol Sci 367: 378–2381. [DOI] [PMC free article] [PubMed] [Google Scholar]
- Alexander SPH, Cidlowski JA, Kelly E, Marrion NV, Peters JA, Faccenda E et al (2017a). The Concise Guide to PHARMACOLOGY 2017/18: nuclear hormone receptors. Br J Pharmacol 174 (Suppl 1): S208–S224. [DOI] [PMC free article] [PubMed] [Google Scholar]
- Alexander SPH, Kelly E, Marrion NV, Peters JA, Faccenda E, Harding SD et al (2017b). The Concise Guide to PHARMACOLOGY 2017/18: Transporters. Br J Pharmacol 174: S360–S446. [DOI] [PMC free article] [PubMed] [Google Scholar]
- Barbiero JK, Santiago R, Tonin FS, Boschen S, da Silva LM, Werner MF et al (2014). PPAR‐α agonist fenofibrate protects against the damaging effects of MPTP in a rat model of Parkinson's disease. Prog Neuro‐Psychopharmacol Biol Psychiatry 53: 35–44. [DOI] [PubMed] [Google Scholar]
- Beckervordersandforth R, Zhang CL, Lie DC (2015). Transcription‐factor‐dependent control of adult hippocampal neurogenesis. Cold Spring Harb Perspect Biol 7: a018879. [DOI] [PMC free article] [PubMed] [Google Scholar]
- Berton O, McClung CA, Dileone RJ, Krishnan V, Renthal W, Russo SJ et al (2006). Essential role of BDNF in the mesolimbic dopamine pathway in social defeat stress. Science 311: 864–868. [DOI] [PubMed] [Google Scholar]
- Berton O, Nestler EJ (2006). New approaches to antidepressant drug discovery: beyond monoamines. Nat Rev Neurosci 7: 137–151. [DOI] [PubMed] [Google Scholar]
- Blendy JA (2006). The role of CREB in depression and antidepressant treatment. Biol Psychiatry 59: 1144–1150. [DOI] [PubMed] [Google Scholar]
- Bondar N, Bryzgalov L, Ershov N, Gusev F, Reshetnikov V, Avgustinovich D et al (2017). Molecular adaptations to social defeat stress and induced depression in mice. Mol Neurobiol 55 (4): 3394–3407 [Epub ahead of print]. [DOI] [PubMed] [Google Scholar]
- Braun A, Lommatzsch M, Neuhaus‐Steinmetz U, Quarcoo D, Glaab T, McGregor GP et al (2004). Brain‐derived neurotrophic factor (BDNF) contributes to neuronal dysfunction in a model of allergic airway inflammation. Br J Pharmacol 141: 431–440. [DOI] [PMC free article] [PubMed] [Google Scholar]
- Chen B, Dowlatshahi D, MacQueen GW, Wang JF, Young LT (2001). Increased hippocampal BDNF immunoreactivity in subjects treated with antidepressant medications. Biol Psychiatry 50: 260–265. [DOI] [PubMed] [Google Scholar]
- Curtis MJ, Bond RA, Spina D, Ahluwalia A, Alexander SP, Giembycz MA et al (2015). Experimental design and analysis and their reporting: new guidance for publication in BJP. Br J Pharmacol 172: 3461–3471. [DOI] [PMC free article] [PubMed] [Google Scholar]
- D'Orio B, Fracassi A, Cerù MP, Moreno S (2018). Targeting PPARα In Alzheimer's Disease. Curr Alzheimer Res 15: 345–354. [DOI] [PubMed] [Google Scholar]
- Eisch AJ, Bolaños CA, de Wit J, Simonak RD, Pudiak CM, Barrot M et al (2003). Brain‐derived neurotrophic factor in the ventral midbrain‐nucleus accumbens pathway: a role in depression. Biol Psychiatry 54: 994–1005. [DOI] [PubMed] [Google Scholar]
- Eissa Ahmed AA, Al‐Rasheed NM, Al‐Rasheed NM (2009). Antidepressant‐like effects of rosiglitazone, a PPARγ agonist, in the rat forced swim and mouse tail suspension tests. Behav Pharmacol 20: 635–642. [DOI] [PubMed] [Google Scholar]
- Esmaeili MA, Yadav S, Gupta RK, Waggoner GR, Deloach A, Calingasan NY et al (2016). Preferential PPAR‐α activation reduces neuroinflammation, and blocks neurodegeneration in vivo . Hum Mol Genet 25: 317–327. [DOI] [PMC free article] [PubMed] [Google Scholar]
- Fidaleo M, Fanelli F, Ceru MP, Moreno S (2014). Neuroprotective properties of peroxisome proliferator‐activated receptor alpha (PPARα) and its lipid ligands. Curr Med Chem 21: 2803–2821. [DOI] [PubMed] [Google Scholar]
- Finkbeiner S, Tavazoie SF, Maloratsky A, Jacobs KM, Harris KM, Greenberg ME (1997). CREB: a major mediator of neuronal neurotrophin responses. Neuron 19: 1031–1047. [DOI] [PubMed] [Google Scholar]
- Gao Z, Li YH (2012). Antioxidant stress and anti‐inflammation of PPARα on warm hepatic ischemia–reperfusion injury. PPAR Res 2012: 738785. [DOI] [PMC free article] [PubMed] [Google Scholar]
- Gass P, Riva MA (2007). CREB, neurogenesis and depression. Bioessays 29: 957–961. [DOI] [PubMed] [Google Scholar]
- Green S (1995). PPAR: a mediator of peroxisome proliferator action. Mutat Res 333: 101–109. [DOI] [PubMed] [Google Scholar]
- Han M, Liu X, Liu S, Su G, Fan X, Chen J et al (2017). 2,3,7,8‐Tetrachlorodibenzo‐p‐dioxin (TCDD) induces hepatic stellate cell (HSC) activation and liver fibrosis in C57BL6 mouse via activating AKt and NF‐κB signaling pathways. Toxicol Lett 273: 10–19. [DOI] [PubMed] [Google Scholar]
- Harding SD, Sharman JL, Faccenda E, Southan C, Pawson AJ, Ireland S et al (2018). The IUPHAR/BPS Guide to PHARMACOLOGY in 2018: updates and expansion to encompass the new guide to IMMUNOPHARMACOLOGY. Nucleic Acids Res 46: D1091–D1106. [DOI] [PMC free article] [PubMed] [Google Scholar]
- Hirschfeld RM (2012). Depression epidemiology and its treatment evolution. J Clin Psychiatry 73: e29. [DOI] [PubMed] [Google Scholar]
- Huang J, Mei H, Tang Z, Li J, Zhang X, Lu Y et al (2017). Triple‐amiRNA VEGFRs inhibition in pancreatic cancer improves the efficacy of chemotherapy through EMT regulation. J Control Release 245: 1–14. [DOI] [PubMed] [Google Scholar]
- Jacobs BL, van Praag H, Gage FH (2000). Adult brain neurogenesis and psychiatry: a novel theory of depression. Mol Psychiatry 5: 262–269. [DOI] [PubMed] [Google Scholar]
- Jernigan CS, Goswami DB, Austin MC, Iyo AH, Chandran A, Stockmeier CA et al (2011). The mTOR signaling pathway in the prefrontal cortex is compromised in major depressive disorder. Prog Neuro‐Psychopharmacol Biol Psychiatry 35: 1774–1779. [DOI] [PMC free article] [PubMed] [Google Scholar]
- Ji MJ, Yu XB, Mei ZL, An YQ, Tang SS, Hu M et al (2015). Hippocampal PPARδ overexpression or activation represses stress‐induced depressive behaviors and enhances neurogenesis. Int J Neuropsychopharmacol 19 pii: pyv083. [DOI] [PMC free article] [PubMed] [Google Scholar]
- Jiang B, Huang C, Chen XF, Tong LJ, Zhang W (2015a). Tetramethylpyrazine produces antidepressant‐like effects in mice through promotion of BDNF signaling pathway. Int J Neuropsychopharmacol 18 pii: pyv010. [DOI] [PMC free article] [PubMed] [Google Scholar]
- Jiang B, Huang C, Zhu Q, Tong LJ, Zhang W (2015b). WY14643 produces anti‐depressant‐like effects in mice via the BDNF signaling pathway. Psychopharmacology 32: 1629–1642. [DOI] [PubMed] [Google Scholar]
- Jiang B, Wang F, Yang S, Fang P, Deng ZF, Xiao JL et al (2014). SKF83959 produces antidepressant effects in a chronic social defeat stress model of depression through BDNF‐TrkB pathway. Int J Neuropsychopharmacol 18 pii: pyu096. [DOI] [PMC free article] [PubMed] [Google Scholar]
- Jiang B, Wang W, Wang F, Hu ZL, Xiao JL, Yang S et al (2013). The stability of NR2B in the nucleus accumbens controls behavioral and synaptic adaptations to chronic stress. Biol Psychiatry 74: 145–155. [DOI] [PubMed] [Google Scholar]
- Jiang B, Wang YJ, Wang H, Song L, Huang C, Zhu Q et al (2017). Antidepressant‐like effects of fenofibrate in mice via the hippocampal brain‐derived neurotrophic factor signalling pathway. Br J Pharmacol 174: 177–194. [DOI] [PMC free article] [PubMed] [Google Scholar]
- Kempermann G, Kronenberg G (2003). Depressed new neurons‐adult hippocampal neurogenesis and a cellular plasticity hypothesis of major depression. Biol Psychiatry 54: 499–503. [DOI] [PubMed] [Google Scholar]
- Kilkenny C, Browne W, Cuthill IC, Emerson M, Altman DG (2010). Animal research: reporting in vivo experiments: the ARRIVE guidelines. Br J Pharmacol 160: 1577–1579. [DOI] [PMC free article] [PubMed] [Google Scholar]
- Krishnan V, Nestler EJ (2008). The molecular neurobiology of depression. Nature 455: 894–902. [DOI] [PMC free article] [PubMed] [Google Scholar]
- Lee E, Son H (2009). Adult hippocampal neurogenesis and related neurotrophic factors. BMP Rep 42: 239–244. [DOI] [PubMed] [Google Scholar]
- Lin PY, Chang AY, Lin TK (2014). Simvastatin treatment exerts antidepressant‐like effect in rats exposed to chronic mild stress. Pharmacol Biochem Behav 124: 174–179. [DOI] [PubMed] [Google Scholar]
- Liu J, Lu C, Xiao M, Jiang F, Qu L, Ni R (2017a). Long non‐coding RNA SNHG20 predicts a poor prognosis for HCC and promotes cell invasion by regulating the epithelial‐to‐mesenchymal transition. Biomed Pharmacother 89: 857–863. [DOI] [PubMed] [Google Scholar]
- Liu KF, Li Y, Cheng KC, Hsu CC, Cheng JT, Peng WH (2017b). Changes in PPARδ expression in a rat model of stress‐induced depression. Clin Exp Pharmacol Physiol 44: 664–670. [DOI] [PubMed] [Google Scholar]
- Liu S, Ji Y, Yao J, Zhao X, Xu H, Guan Y et al (2016). Knockout of the prostaglandin E2 receptor subtype 3 promotes eccentric cardiac hypertrophy and fibrosis in mice. J Cardiovasc Pharmacol Ther pii: 1074248416642520 [Epub ahead of print]. [DOI] [PubMed] [Google Scholar]
- McGrath JC, Lilley E (2015). Implementing guidelines on reporting research using animals (ARRIVE etc.): new requirements for publication in BJP. Br J Pharmacol 172: 3189–3193. [DOI] [PMC free article] [PubMed] [Google Scholar]
- Neto FL, Borges G, Torres‐Sanchez S, Mico JA, Berrocoso E (2011). Neurotrophic role in depression neurobiology: a review of basic and clinical evidence. Curr Neuropharmacol 9: 530–552. [DOI] [PMC free article] [PubMed] [Google Scholar]
- Nibuya M, Morinobu S, Duman RS (1995). Regulation of BDNF and trkB mRNA in rat brain by chronic electroconvulsive seizure and antidepressant drug treatments. J Neurosci 15: 7539–7547. [DOI] [PMC free article] [PubMed] [Google Scholar]
- Pérez‐Martín M, Rivera P, Blanco E, Lorefice C, Decara J, Pavón FJ et al (2016). Environmental enrichment, age, and PPARα interact to regulate proliferation in neurogenic niches. Front Neurosci 10: 89. [DOI] [PMC free article] [PubMed] [Google Scholar]
- Qi C, Zhu Y, Reddy JK (2000). Peroxisome proliferator‐activated receptors, coactivators, and downstream targets. Cell Biochem Biophys 32: 187–204. [DOI] [PubMed] [Google Scholar]
- Qin J, Wu M, Yu S, Gao X, Zhang J, Dong X et al (2015). Pyrroloquinoline quinone‐conferred neuroprotection in rotenone models of Parkinson's disease. Toxicol Lett 238: 70–82. [DOI] [PubMed] [Google Scholar]
- Razzoli M, Domenici E, Carboni L, Rantamaki T, Lindholm J, Castrén E et al (2011). A role for BDNF/TrkB signaling in behavioral and physiological consequences of social defeat stress. Genes Brain Behav 10: 424–433. [DOI] [PubMed] [Google Scholar]
- Roy A, Jana M, Corbett GT, Ramaswamy S, Kordower JH, Gonzalez FJ et al (2013). Regulation of cyclic AMP response element binding and hippocampal plasticity‐related genes by peroxisome proliferator‐activated receptor α. Cell Rep 4: 724–737. [DOI] [PMC free article] [PubMed] [Google Scholar]
- Roy A, Jana M, Kundu M, Corbett GT, Rangaswamy SB, Mishra RK et al (2015). HMG‐CoA reductase inhibtors bind to PPARα to upregulate neurotrophin expression in the brain and improve memory in mice. Cell Metab 22: 253–265. [DOI] [PMC free article] [PubMed] [Google Scholar]
- Roy A, Kundu M, Jana M, Mishra RK, Yung Y, Luan CH et al (2016). Identification and characterization of PPARα ligands in the hippocampus. Nat Chem Biol 12: 1075–1083. [DOI] [PMC free article] [PubMed] [Google Scholar]
- Sadaghiani MS, Javadi‐Paydar M, Gharedaghi MH, Fard YY, Dehpour AR (2011). Antidepressant‐like effect of pioglitazone in the forced swimming test in mice: the role of PPAR‐gamma receptor and nitric oxide pathway. Behav Brain Res 224: 336–343. [DOI] [PubMed] [Google Scholar]
- Sankella S, Garg A, Agarwal AK (2016). Characterization of the mouse and human monoacylglycerol O‐acyltransferase 1 (Mogat1) promoter in human kidney proximal tubule and rat liver cells. PLoS One 11: e0162504. [DOI] [PMC free article] [PubMed] [Google Scholar]
- Schimizu E, Hashimoto K, Iyo M (2004). Major depressive disorders and BDNF (brain‐derived neurotrophic factor). Nihon Shinkei Seishin Yakurigaku Zasshi 24: 147–150. [PubMed] [Google Scholar]
- Shelton RC (2007). The molecular neurobiology of depression. Psychiatr Clin North Am 30: 1–11. [DOI] [PMC free article] [PubMed] [Google Scholar]
- Shirayama Y, Chen AC, Nakagawa S, Russell DS, Duman RS (2002). Brain‐derived neurotrophic factor produces antidepressant effects in behavioral models of depression. J Neurosci 22: 3251–3261. [DOI] [PMC free article] [PubMed] [Google Scholar]
- Takahashi N, Kawada T (2001). Physiological and pharmacological function of PPARs. Nihon Yakurigaku Zasshi 117: 319–327. [DOI] [PubMed] [Google Scholar]
- Wang H, Zhao Y, Wang YJ, Song L, Wang JL, Huang C et al (2017a). Antidepressant‐like effects of tetrahydroxystilbene glucoside in mice: involvement of BDNF signaling cascade in the hippocampus. CNS Neurosci Ther 23: 627–636. [DOI] [PMC free article] [PubMed] [Google Scholar]
- Wang Y, Yu D, Tolleson WH, Yu LR, Green B, Zeng L et al (2017b). A systematic evaluation of microRNAs in regulating human hepatic CYP2E1. Biochem Pharmacol 138: 174–184. [DOI] [PMC free article] [PubMed] [Google Scholar]
- Wook Koo J, Labonté B, Engmann O, Calipari ES, Juarez B, Lorsch Z et al (2016). Essential role of mesolimbic brain‐derived neurotrophic factor in chronic social stress‐induced depressive behaviors. Biol Psychiatry 80: 469–478. [DOI] [PMC free article] [PubMed] [Google Scholar]
- Wu SH, Chen XQ, Lu J, Wang MJ (2016). BML‐111 attenuates renal ischemia/reperfusion injury via peroxisome proliferator‐activated receptor‐α‐regulated heme oxygenase‐1. Inflammation 39: 611–624. [DOI] [PubMed] [Google Scholar]
- Xuan AG, Chen Y, Long DH, Zhang M, Ji WD, Zhang WJ et al (2015). PPARα agonist fenofibrate ameliorates learning and memory deficits in rats following global cerebral ischemia. Mol Neurobiol 52: 601–609. [DOI] [PubMed] [Google Scholar]
- You M, Jin J, Liu Q, Xu Q, Shi J, Hou Y (2017). PPARα promotes cancer cell glut1 transcription repression. J Cell Biochem 118: 1556–1562. [DOI] [PubMed] [Google Scholar]
- Zhai X, Yan K, Fan J, Niu M, Zhou Q, Zhou Y et al (2013). The β‐catenin pathway contributes to the effects of leptin on SREBP‐1c expression in rat hepatic stellate cells and liver fibrosis. Br J Pharmacol 169: 197–212. [DOI] [PMC free article] [PubMed] [Google Scholar]
- Zhang Y, Zhang C, Dong F, Chen M, Cao J, Wang H et al (2017). Inhibition of autophagy aggravated 4‐nitrophenol‐induced oxidative stress and apoptosis in NHPrE1 human normal prostate epithelial progenitor cells. Regul Toxicol Pharmacol 87: 88–94. [DOI] [PubMed] [Google Scholar]
Associated Data
This section collects any data citations, data availability statements, or supplementary materials included in this article.
Supplementary Materials
Figure S1 Effects of CSDS and fluoxetine on PPARα mRNA and PPARα recruitment to CREB promoter in hippocampus. (A) QRT‐PCR showed the effects of CSDS on PPARα mRNA level in different brain regions (n = 5). (B) QRT‐PCR also revealed the restoring effects of fluoxetine on hippocampal PPARα mRNA in CSDS‐stressed mice (n = 5). (C and D) ChIP analyses for hippocampal PPARα‐PPRE (CREB) binding followed by semi‐quantitative PCR (C) and quantitative PCR (D) were performed in naive and CSDS‐stressed mice (n = 5). (E and F) ChIP followed by semi‐quantitative PCR (E) and quantitative PCR (F) were performed in Vehicle (0.9% saline)‐treated, Fluoxetine‐treated, CSDS + Vehicle and CSDS + Fluoxetine mice (n = 5). All results were represented as means ± SEM; ** P < 0.01; n.s., no significance. For (A, C and D), Comparisons were made by one‐way ANOVA followed by LSD test. For (B, E and F), Comparisons were made by two‐way ANOVA followed by Bonferroni's test.
Figure S2 Hippocampal PPARα overexpression completely restored the inhibiting effects of CSDS on BDNF mRNA and hippocampal PPARα recruitment to CREB promoter. (A and B) ChIP followed by semi‐quantitative PCR (A) and quantitative PCR (B) revealed that AAV‐PPARα‐EGFP significantly enhanced the level of hippocampal PPARα‐PPRE (CREB) binding in CSDS‐stressed mice (n = 5). (C) QRT‐PCR showed that AAV‐PPARα‐EGFP largely promoted the level of hippocampal BDNF mRNA in CSDS‐stressed mice (n = 5). All results were represented as means ± SEM; ** P < 0.01; n.s., no significance. Comparisons were made by two‐way ANOVA followed by Bonferroni's test.
Figure S3 Blockade of BDNF function by K252a significantly attenuated the antidepressant‐like effects of AAV‐PPARα‐EGFP in mice. (A) Schematic timeline of experimental procedures. (B and C) Usage of K252a notably antagonized the decreasing effects of AAV‐PPARα‐EGFP on the immobility of mice in FST and TST (n = 10). (D and E) Also, usage of K252a fully attenuated the promoting effects of AAV‐PPARα‐EGFP on the sucrose preference and social interaction in CSDS‐stressed mice (n = 10). All results were represented as means ± SEM; * P < 0.05, ** P < 0.01; n.s., no significance. Comparisons were made by two‐way ANOVA followed by Bonferroni's test.
Figure S4 Blockade of PPARα function by GW6471 disturbed the antidepressant actions of fluoxetine in mice. (A) Schematic timeline of experimental procedures. (B and C) GW6471 infusion significantly attenuated the antidepressant actions of fluoxetine in FST and TST (n = 10). (D and E) GW6471 infusion fully prevented the reversal effects of fluoxetine on CSDS‐induced anhedonia and social avoidance behaviors in mice (n = 10). (F) Representative Western blotting images which revealed that the promoting effects of fluoxetine on hippocampal PPARα and BDNF expressions in the stressed mice were also blocked by GW6471 infusion (n = 5). All results were represented as means ± SEM; *P < 0.05, **P < 0.01; n.s., no significance. Comparisons were made by two‐way ANOVA followed by Bonferroni's test.
Figure S5 Blockade of PPARα function by MK886 interrupted the antidepressant effects of fluoxetine in mice. (A) Schematic timeline of experimental procedures. (B and C) MK886 infusion strongly attenuated the antidepressant effects of fluoxetine in FST and TST (n = 10). (D and E) MK886 infusion notably prevented the restoring effects of fluoxetine on CSDS‐induced anhedonia and social avoidance behaviors in mice (n = 10). (F) Representative Western blotting images which indicated that the enhancing effects of fluoxetine on hippocampal PPARα and BDNF expressions in the stressed mice were also antagonized by MK886 infusion (n = 5). All results were represented as means ± SEM; * P < 0.05, ** P < 0.01; n.s., no significance. Comparisons were made by two‐way ANOVA followed by Bonferroni's test.
Figure S6 QRT‐PCR revealed that blockade of PPARα function by both GW6471 (A and B) and MK886 (C and D) abolished the reversal effects of fluoxetine on hippocampal PPARα and BDNF mRNAs in CSDS‐stressed mice (n = 5). All results were represented as means ± SEM; * P < 0.05, ** P < 0.01; n.s., no significance. Comparisons were made by two‐way ANOVA followed by Bonferroni's test.
Figure S7 Both GW6471 and MK886 prevented the antidepressant effects of fluoxetine on hippocampal PPARα recruitment to CREB promoter. (A and B) ChIP followed by semi‐quantitative PCR (A) and quantitative PCR (B) showed that CSDS + Fluoxetine + GW6471 mice displayed significantly less hippocampal PPARα‐PPRE (CREB) binding than CSDS + Fluoxetine mice (n = 5). (C and D) ChIP followed by semi‐quantitative PCR (C) and quantitative PCR (D) showed that CSDS + Fluoxetine + MK886 mice also had notably less hippocampal PPARα‐PPRE (CREB) binding than CSDS + Fluoxetine mice (n = 5). All results were represented as means ± SEM; ** P < 0.01; n.s., no significance. Comparisons were made by two‐way ANOVA followed by Bonferroni's test.
Figure S8 The effectiveness and validity of PPARα‐KO mice were proved using western blotting and immunohistochemistry. (A) Representative Western blotting images which revealed that compared with WT mice, PPARα‐KO mice displayed no PPARα expression in the brain (n = 4). Homogenates of the whole brains were used. (B, C and D) Immunohistochemical analysis showed that there were no observed PPARα staining in CA1, CA3 and DG of PPARα‐KO mice, in contrast to WT mice (n = 3). Scale bar: 150 μm.
Figure S9 PPARα‐KO did not affect the locomotor activities of mice (n = 10). All results were represented as means ± SEM; n.s., no significance. Comparisons were made by one‐way ANOVA followed by LSD test.
Figure S10 Hippocampal PPARα knockdown by AAV‐PPARα‐shRNA‐EGFP notably down‐regulated hippocampal neurogenesis in naive mice. (A) Representative confocal microscopic images showed the localization of DCX (green) in DG. Scale bar: 150 μm for representative images and 75 μm for enlarged images. Quantitative analysis showed that AAV‐PPARα‐shRNA‐EGFP significantly decreased the number of DCX+ cells in DG of naive mice (n = 4). (B) Representative microscopic images showed the co‐staining (yellow) of NeuN (green) and Brdu (red) in DG. Scale bar: 150 μm for representative images and 75 μm for enlarged images. Quantitative analysis indicated that AAV‐PPARα‐EGFP fully reduced the amount of NeuN+/Brdu+ cells in DG of naive mice (n = 4). (C and D) AAV‐PPARα‐shRNA‐EGFP did not affect the behaviors of naive mice in the sucrose preference and social interaction tests (n = 8). All results were represented as means ± SEM; n.s., no significance. Comparisons were made by one‐way ANOVA followed by LSD test.
Table S1 Mice numbers (N) for each experimental group in this study.