

Abstract
Electrochemical amperometric sensors require a constant or varying potential at the working electrode that drives redox reactions of the analyte for detection. The interfacial redox reaction(s) can result in the formation of new chemical products that could change the initial condition of the electrode/electrolyte interface. If the products are not inert and/or cannot be removed from the system such that the initial condition of the electrode/electrolyte interface cannot be restored, the sensor signal baseline would consequently drift, which is problematic for the continuous and real-time sensors. By setting the electrode potential with the periodical ON-OFF mode, electrolysis can be forestalled during the off mode which can minimize the sensor signal baseline drift and reduce the power consumption of the sensor. However, it is known that the relaxation of the structure in the electrical double layer at the ionic liquid/electrode interface to the steps of the electrode potential is slow. This work characterized the electrode/electrolyte interfacial relaxation process of an ionic liquid based electrochemical gas (IL-EG) sensor by performing multiple potential step experiments in which the potential is stepped from an open circuit potential (OCP) to the amperometric sensing potential at various frequencies with different time periods. Our results showed that by shortening the sensing period as well as extending the idle period (i.e., enlarge the ratio of idle period versus sensing period) of the potential step experiments, the electrode/electrolyte interface is prone to relax to its original state, and thus reduces the baseline drift. Additionally, the high viscosity of the ionic liquids is beneficial for electrochemical regeneration via the implementation of a conditioning step at zero volts at the electrode/electrolyte. By setting the working electrode at zero volts instead of OCP, our results showed that it could further minimize the baseline drift, enhance the sensing signal stability, and extend the functioning lifetime of a continuous IL-EG oxygen sensor.
Keywords: ionic liquids, amperometric sensor, electric double layer, interfacial relaxation, oxygen sensor
Graphical Abstract

Timely detection of flammable gases prevents explosions and fires, saves lives, avoids injuries, and protects assets. While many commercial gas sensors exist for individual gases and many gas analyzers provide highly accurate offline concentration measurements, gas monitoring for worker safety and environmental health requires real-time, continuous-use gas sensors.1–4 Although some carbon monoxide5 and hydrogen6,7 electrochemical sensors are capable of online monitoring, the use of an aqueous electrolyte limits their functioning lifetime as well as the shelf life due to the electrolyte drying-out issue.8 The ionic liquid based electrochemical gas (IL-EG) sensor technology that our lab pioneered has shown great potential to satisfy many of the requirements for personal real-time point-of-exposure and continuous-use gas monitoring applications.9–14 Among all electrochemical gas sensing methods, chronoamperometry is the desired method due to its simplicity and low-cost/power instrumentation.15 Chronoamperometry uses the potential-step method in which the potential of the working electrode is stepped from the open circuit potential (OCP) to a predetermined value where the redox reaction of the analyte occurs for analyte detection. This stepped potential also provides the selectivity for analyte analysis as many analyte redox reactions occur at a specific potential.
In the absence of a redox analyte, a non-faradaic capacitive charging current will be generated when a potential is stepped to a predetermined value, due to the presence of an electric double layer at the electrode/electrolyte interface. The capacitive charging current reflects the change in potential polarization.16 Equation 1 depicts this correlation. In the presence of the redox analyte, a faradaic current will occur and superimpose on the capacitive charging current. The faradaic current is due to the analyte electrolysis reaction that follows the Cottrell equation as shown in eq 2, provided this current is controlled by the diffusion of the redox analyte. Hence, the recorded current signal (i) is the sum of the faradaic current (if) and the capacitive charging current (ic), as shown in eq 3. Through time, the capacitive charging current decays (exponentially) much faster than the faradaic current decay (inverse of square root). Consequently, when current is sampled at a time exceeding five times the time constant (τ, τ = RsCd), the faradaic current can be quantitatively related to the gas analyte concentration since the capacitive charging current is then negligible.16,17
| (1) |
| (2) |
| (3) |
E is the amplitude of the applied potential step, Rs is the solution resistance, Cd is the differential capacitance of the double layer, n is the stoichiometric number of electron, F is the Faraday constant, A is the electroactive area, D is the diffusion coefficient, and C is the concentration of the electroactive analyte.
In ionic liquid (IL) systems, numerous theoretical and experimental studies have shown that the structure and dynamic of the electric double layer (EDL) near the IL/electrode interface at an applied potential differs from those in traditional aqueous and nonaqueous organic electrolytes.18,19 First, the double layer capacitance in the IL is potential-dependent.20 In situ X-ray reflectivity and impedance spectroscopy study of the dynamic of IL/electrode interface shows oscillatory charge density profiles consisting of alternating anion- and cation-enriched layers at both cathodic and anodic potentials.21–23 Second, the EDL at the IL/electrode interface response to the steps of the electrode potential is shown to involve complex dynamics with a large time scale of relaxation processes (seconds to minutes) and length scales (10–60 nm).23–25 For example, Druschler26 and Gore27 have reported a hysteresis effect in the potential-dependent double-layer capacitance in the ILs at either platinum or gold electrode. They explained that this hysteresis effect comes from the slow pseudocapacitive processes when the frequency is below 10 Hz. These studies suggested a slow relaxation process at the IL/electrode interface under an external potential polarization in the IL electrolytes.28–30 This slow relaxation process of the IL/electrode interface to a potential step can result in a slow drift of the baseline that is detrimental for continuous and real-time amperometric sensing. In our previous work on the IL-EG oxygen sensor,31 we characterized the sensor signal stability at various oxygen concentrations and noticed that slow mass transport is one of the key aspects that cause the sensor signal drift on a continuous-use basis. An earlier study by our group focusing on the IL/electrode interface morphologies at different potentials reported that the ions near the IL/electrode interface become more organized at the application of a feature potential.32 Such reduced unoccupied spaces at the IL/electrode interface expel the analyte gas molecules and cause significant capacitance change.32 Although there are many publications discussing the surface electrochemistry in ILs,33–35 however, to the best of our knowledge, there has been no study on the IL/electrode interfacial relaxation processes at programed potential polarizations in serving the development of IL-EG sensors.
In this work, we performed systematical measurements to characterize the IL/electrode interface relaxation processes at multiple potential-step programs, setting various lengths of time and frequencies of the potential polarization, aiming to ascertain the time required to restore the IL/electrode interface initial condition after the removal of potential polarization. Such potential-step measurements were conducted in both inert nitrogen and a 5% oxygen/nitrogen mixture gas condition, so that the signal stability of both the baseline signal (non-faradaic condition) and the sensing signal (faradaic condition) could be analyzed. Since sensors run for certain hours per day and then are switched off to conserve energy and to extend the sensors’ lifetime in many real-world applications, we also carried out such “sniff mode”36 measurements accordingly. Our results showed that the signal drift over time could be significantly minimized and the sensor functioning lifetime could be largely extended when the sensor is set to function intermittently rather than continuously at a large ratio of the idle (e.g., at open circuit potential) versus sensing (i.e., at a potential that drives redox reaction) period. Furthermore, taking advantage of the reversible redox process of oxygen/superoxide radical in the IL, and the high viscosity of the ionic liquids, we studied the implementation of a conditioning step at the electrode which allows electrochemical conversion of the more reactive superoxide anion to oxygen. This was shown to further minimize the baseline drift, enhance the sensing signal stability, and extend the functioning lifetime of a continuous IL-EG oxygen sensor. The results from this study address the direction to enhance the sensor signal stability and form the basis to develop real-world amperometric sensing protocols as well as the calibration methods for the IL-EG sensor technology for various practical applications.
METHODOLOGY AND EXPERIMENTS
Electrochemical Cell Setup.
Electrochemical measurements were carried out using a Clark-type electrochemical cell (Figure 1a). The working electrode (polycrystalline platinum gauze, Sigma-Aldrich, 100 mesh, 0.076 mm diameter), counter and reference electrodes (polycrystalline platinum wires, Sigma-Aldrich, 0.5 mm diameter) of the Clark-type cell were stacked in a layered configuration. The porous Teflon membrane (Interstate Specialty Products, type PM71W, 5 μm pore size, 0.15 mm thickness, and 35% porosity) was utilized as the gas permeable membrane (GPM). Cellulose filter paper (Whatman, No. 1) was infused with the IL providing the electrolytic contact between working, reference, and counter electrodes. All these elements were assembled in a Kel-F electrochemical cell body. The electrochemical active surface area of the platinum gauze working electrode was calculated as 5.96 cm2, using the method of the hydrogen adsorption/desorption charge measurement on the platinum electrode in 0.1 M perchlorate acid.37 The CV of hydrogen adsorption/desorption was presented in Figure S1. The working electrode was electrochemically cleaned in 0.1 M perchloric acid (Fisher Chemical, 70% certified ACS). A commercial KWJ electrochemical cell (Figure 1b, from KWJ Engineering) was used to compare the effects of the electrode geometry and electrode material. The KWJ cell consists of microfabricated working, counter, and reference electrodes (all made of platinum black material) in a planar geometry.
Figure 1.

(a) Cross section of the modified Clark-type electrochemical cell. (b) Snapshot of the KWJ electrochemical cell. Material of working, reference, and counter electrodes is platinum black. (c) Potential–time function of a typical “measurement cycle”. (d) Potential–time function when varying the ti period and maintaining a specific ts period.
1-Butyl-1-methylpyrrolidinium bis(trifluoromethylsulfonyl)-imide ([Bmpy][NTf2], Io-LiTec Inc., 99%, viscosity is 61.14 cP at 25 °C38) was used in all electrochemical experiments, in accordance with our previous work.17,26 The IL was stored in a vacuum-dry chamber (Shel Lab, model no. 1415M) set at room temperature with a vacuum pressure of 18 in. Hg. Prior to the measurements, the testing sensors with electrodes and the IL electrolyte were conditioned in a flow system with continuous nitrogen (PRAXAIR compressed nitrogen) flow via Tygon PVC gas tubing (ϕ = 1 mm) for at least 12 h, for the purpose to control the water content in IL.39
Nitrogen (PRAXAIR, UN1066, 99.998%) and oxygen (PRAXAIR, 4.3UH-T, 99.993%) gas cylinders were the sources of inert nitrogen and oxygen, respectively. The Henry constant of oxygen in [Bmpy][NTf2] is reported as 1830 ± 590 bar at 298 K.40 Based on Henry’s Law (p = kH * c), the maximum oxygen concentration at 1 atm should be 0.6 ± 0.2 mM. In this work, the gas flow rate was 100 sccm, and the oxygen was fed in a volume concentration of 5% with nitrogen. Thus, the amount of oxygen fed to the electrochemical cell (loaded with 0.3 mL IL) was 6.7 M/min, according to Avogadro’s principle.41 This was a much larger amount than [Bmpy][NTf2] can dissolve. Hence, the oxygen gas was saturated at the IL/electrode interface throughout all measurements, because of the benefits of the cell design12,14 in which gases flow through the bottom of the electrochemical cells (Figure 1a).
All measurements were carried out using the VersasStat MC 4-channel electrochemical workstation (Princeton AMETEK) at room temperature (~25 °C), in a gas flow system in which the outlet was vented to a vacuum hood to avoid the buildup of gas pressure in the testing system. The total gas flow rate was controlled at 100 sccm (standard cubic centimeters per minute) using MKS (MKS Instruments, Inc.) type 247 4-channel readout (bundled with Mass-Flo Controller). Two mass-flow controllers were used to adjust the volume ratio of the mixture gas flows: one controlled the inert nitrogen (the background gas) flow and the other was used to adjust the oxygen (the analyte gas) flow. These two gases were mixed in a glass gas mixer prior to the inlet of the gas sensor chamber.
Stepped-Potential Polarization Protocols.
The IL/electrode interface can be perturbed with different potential–time functions. For each potential–time function there is a current–time response of the system which depends, to a large extent, on the kinetics of the electrolyte/electrode interface reactions. To delineate the drift mechanism of the IL-EG sensors, our group has reported17,42,43 the need to understand if the ions of the IL can reorganize and relax to their initial state after the removal of the applied potential, and, further, the time it takes for the restoration of the IL/electrode interfacial relaxation to its initial state. To approach this, we analyzed the current–time response of the system when a potential is applied to the IL/electrode interface at varying frequencies. The measurement protocols are illustrated in Figure 1c. The so-called “test cycle” consists of one “idle period” (ti = t1 – t0) followed by one “sensing period” (ts = t2 – t1). The “idle period” is defined as the time the working electrode is set at the open circuit potential (OCP). OCP is the potential in a working electrode compared to the reference electrode when there is no external potential applied to the electrochemical cell and there is also no current existing in the electrochemical cell. In many commercial potentiostats, by default, the instrument simply disconnects from the electrochemical cell at OCP. In real-world condition, OCP can vary slightly with time subject to the transient nature of the process in the electrochemical cell. To mimic the real world conditions, in our experiments, the idle condition is set to the OCP by not applying any potential in the instrument. We define this condition as the open circuit potential condition of our system. As the measurements of varying ti and ts periods are designed in a chronological order (Figure 1d), the purpose of the “idle period” is to allow the IL/electrode interface to recover its initial condition before the next ts period. The “sensing period” is defined as the time the applied potential was stepped to the Ec and maintained at Ec for a certain time period. Since this work serves to ascertain the influences of the initial condition of the IL/electrode interface and the corresponding relaxation process that was mentioned in our early work,26 we herein set the Ec value at −1.2 V (see the oxygen reduction peak potential in Figure S2). Investigated ti values were 15, 30, 60, and 120 min; and investigated ts values were 1, 200, and 1800 s. As depicted in Figure 1d, the ts period was kept the same while varying the ti period. Each test cycle (a combination of specific ti and ts) was repeated three times in series.
Since OCP can vary depending on the nature of IL/electrode interface conditions, a known IL/electrode interface state can be obtained through a conditioning step in which a selected potential such as zero volts is applied that facilitates the IL/electrode interface to approach equilibrium but without promoting any faradaic process.44,45 This IL/electrode interface equilibrium condition is different from the previously mentioned initial condition at OCP, but it shall be a fixed steady state condition. To achieve this, we conducted experiments that implemented a conditioning step (the time of the conditioning step is marked as tcondition), substituting the “idle period” (i.e., replacing ti with tcondition). In these experiments, the applied potential for the conditioning step was zero V (vs platinum reference electrode) instead of at an open circuit potential. To differentiate the “idle condition” from the condition in which a zero voltage is applied to the working electrode, we used “rest condition” to refer to the latter.
RESULTS AND DISCUSSION
Significance of the Understanding of the IL/Electrode Interfacial Relaxation Process.
For a typical constant potential amperometric experiment, a potential is applied to the working electrode that leads to a capacitive current that follows the exponential decay equation (i.e., i ∞ e−t) when no redox analyte is present. Typically, the analyte is then introduced to the sensor system after the capacitive current decays to a negligible value,16 and a faradaic current, due to the presence of redox analyte, will be superimposed on this residual capacitive current. We noticed that the precision of the recorded current signal is affected by the value and the stability of the capacitive current. The capacitive current, in other words, is the baseline current prior to the redox analyte introduction. In an amperometric measurement, as shown in Figure S3, with 11 repetitive cycles of 5% oxygen exposure, the sensing signals were more reliable (i.e., smaller RSD; see Table S1) when the baseline currents were very small and relatively stable (SD = ± 1.41 μA for measurement cycles #4–11). This was consistent with our previous report17 which showed the capacitive current decay influences the repeatability of the sensing response because it affects the baseline residual current. We thus performed the measurement when the capacitive current is at a negligible value to study other factors that affect sensor signal drift.
Earlier, in the investigation of gas molecule adsorption at the IL/electrode interface, our group and others have reported that the IL/electrode interface structure is potential-dependent.32 Thus, the unoccupied spaces near the IL/electrode interface in both amount and size will depend on the applied potential.32 When a redox analyte is absent, such a change of the IL/electrode interface will cause a fluctuation of the baseline signal that results in baseline signal drift through time.46 Due to the hysteresis effects of the potential polarization26,47,48 the change of the IL/electrode interface, under potential polarization, will not only vary the interfacial capacitance but also lead to difficulties in surface adsorption of the analyte gas molecules.32 For an electrochemical sensor, the sensing signal is proportional to the concentration of the analyte at the electrode/electrolyte interface.49 Therefore, the reduced amount of the analyte at the IL/electrode interface will eventually cause the deviation of the sensing signal, which is exhibited as sensing signal drift. It is thus necessary to study the IL/electrode interface behavior with and without potential polarization, so as to provide information pertaining to the signal stability of both the baseline signal and the sensing signal for continuous use of the IL-EG sensor and give guidelines to the optimal functioning profile of the IL-EG sensor.
In our previous work on the IL-EG oxygen sensor,31 we reported that the sensor signal stability is influenced by the analyte concentration gradient since the mass transport is rather slow in the IL due to its relative high viscosity. As shown in Figure 2, a constant potential amperometric sensor shows several features: (1) When a constant potential is applied, a double layer charge current flows. We define the highest current as the “peak capacitive charging current” (ic(peak)). The ic(peak) is the largest current recorded in the early transient when a potential is applied. This value varies due to the limitations of the recording device.16 (2) The decay rate of the capacitive charging current (or the derivative of the capacitive charging current, ) determines the stability of the baseline current prior to the introduction of redox analyte. (3) The transient time τ: there are many ways to define a characteristic time in a dynamical electrochemical experiment. A potential step experiment results in an asymptotic relaxation toward the steady state, and the transition process will be exponential. The transient time τ is the decay time of capacitive current to a new equilibrium under potential polarization (i.e., the difference between the t0 and t1 in Figure 2b). The term “transient time” has some similarity to “relaxation time”. These three features reflect the initial condition of the IL/electrode interface. Figure 2a presents two separate measurements of the same Clark electrochemical cell at different IL/electrode interface conditions, as their ic(peak) varies. Both measurements were conducted using the same instrument and the data acquisition rate was set at 1 data point per 0.1 s. Oxygen gas was programed to be introduced when values of both measurements were negligible and close to each other, which led to different transient times. Values of the ic(peak), , and the transient time is summarized in Table S2. As the ic(peak) of measurement #1 (−826.6 μA) was larger than that of measurement #2 (−599.0 μA), it required a longer transient time at a potential polarization. When the analyte oxygen was present, the recorded current for 20% oxygen was −155.6 μA (measurement #1) and −154.3 μA (measurement #2), and the T90 (the time needed to approach 90% of the peak current) values for these two measurements were nearly 11 s apart (i.e., T90 values of measurements #1 and #2 were 455.1 and 466.5 s, respectively). The difference in transient time and T90 bears the potential risk in measurement deviation if the analyte introduction is programmed at a fixed time point. Therefore, it is important to characterize the IL/electrode interface behavior under a potential polarization as well as at the removal of this potential polarization.
Figure 2.

(a) Current–time responses of two separate measurements depicting the difference of the peak capacitive current and the transient time in non-faradaic condition, and the response time in faradaic condition, showing the influences from the initial condition of the IL/electrode interface. The peak capacitive current and transient time of measurement #1 and #2 are marked in black and blue, respectively. (b) Illustration of the transient time definition at constant potential polarization.
IL/Electrode Interfacial Relaxation in Non-Faradaic Conditions.
When the IL/electrode interface is perturbed with stepped potential-time functions the ions will rearrange in accordance with the externally applied potential as ILs are substances composed of pure cations and anions.32 To be specific, when a negative potential is applied at the working electrode, cations will be driven to the surface of the working electrode while anions will be repelled away. Therein, the applied external potential will cause a change in the charge distribution at the IL/electrode interface from its initial state. Such an effect was reported by Lockett et al. and was called the potential polarization in ILs.50 Thus, when the external potential is removed, the ions require a period of time to restore to reach the prior state.28 This IL/electrode interface restoration is a process defined as relaxation, which is the transition of a system between different equilibrium states.51 Each relaxation process can be characterized by a relaxation time. The IL/electrode interface relaxation process is shown to be a relatively slow process since the electrostatic interactions between cations and anions in an IL make the ions reluctant to migrate, and the large and bulky size of the cation and/or anion (reflected as the small diffusion coefficients of species in ILs) further contributes to the slow relaxation.52 Therefore, we conducted stepped potential chronoamperometry measurements to study the IL/electrode interface relaxation processes at varying ti and ts periods. The OCP over the course of the entire experimental time scale was measured in both inert nitrogen and 5% oxygen conditions (Figure S4) which showed negligible potential shift of the platinum quasi-reference electrode at no potential polarization. In our earlier work,31 we also validated that insignificant reference potential drift occurred in the IL-EG oxygen sensor at a potential polarization of −1.2 V, conducting the voltammogram of a sensor before and after functioning for a day.
The study of various ti and ts effects on current-time response indicated that longer ti periods and shorter ts periods (or larger ti/ts ratio) facilitate the IL/electrode interface relaxation. The measured current-time curves, when a potential of −1.2 V was applied to the working electrode at a potential waveform, are presented in Figure S5a–c. These measurements were carried out in nitrogen environment (absence of any redox analyte) and only the capacitive charging current was present. For each ts period, four different ti periods (i.e., 15, 30, 60, and 120 min) were studied in sequence. The observed trends showed that a longer ts period causes greater deviation of the current–time curves from the first current–time curve (the curve marked as test 1 in Figure S5), while a longer ti period was helpful to mitigate such deviation.
To better depict the IL/electrode interface relaxation due to varying ti and ts periods, we use the mean current value of the last portion of each measurement (i.e., last 2 s of the current–time curve when the ts period is 30 min or 200 s, and the last 0.1 s of the current–time curve when the ts period is 1 s). The symbol Iavg(ti = 0) represents the mean current value of the first current–time curve, and Iavg(ti = t) represents the mean current value of all other measured current–time curves when ti equals to 15, 30, 60, or 120 min. The difference between Iavg(ti = t) and Iavg(ti = 0) can depict the deviation among measured current–time curves. Because the absolute signals of the current–time responses at different ts periods vary and the capacitive charge is dependent on the decay time, we herein plot ΔIavg/Iti=0 as a function of the ti period to compare the relative signals (Figure 3). Since the reduction current is defined as a negative current, the value of ΔIavg/Iti=0 is negative. The larger the absolute value of ΔIavg/Iti=0 is, the greater the deviation from the initial state at ti = 0. At shorter idle period ti, the |ΔIavg/Iti=0| value was large but it decreased as the ti period increased. Due to the slow mass transport of species in the IL, the organized ions near the IL/electrode interface at a potential polarization found difficulty relaxing and restoring the initial condition of the IL/electrode interface if not given a long enough idle period ti. However, at larger ti/ts ratios (e.g., ti = 120 min and ts = 200 s), the IL/electrode relaxation began to overcome the effect of the potential polarization, since the |ΔIavg/Iti=0| vs ti leveled off when the ti period was longer than 60 min and the |ΔIavg/Iti=0| value was observed to decrease at ti = 120 min of the measurements. Changes of the standard deviation (SD) and the relative standard deviation (RSD) of each measured current–time curve (summarized in Table S3) reflect the same trend in which the IL/electrode interface relaxation occurs more efficiently at longer ti period. The RSD values in Table S3 also indicate that the baseline current stability is enhanced at longer ti periods and shorter ts periods (a larger ti/ts ratio), when no redox analyte is present. These observed phenomena suggested that continuous but intermittent potential polarization with high frequency could make cations/anions close to the IL/electrode interface more organized and cause relaxation to be more difficult, while larger ti/ts ratios could favor the IL/electrode interface relaxation.
Figure 3.

Plots of the ΔIavg/Iti=0 as a function of the idle period, when the sensing period varied as 30 min, 200 s, and 1 s. Measurements were performed in nitrogen condition.
Results from the measurements on KWJ cell (Figure S6a–c) validated the importance of longer ti and shorter ts in facilitating the IL/electrode interface relaxation. As the KWJ cell is assembled in a different geometry from the Clark cell, the proposed conclusion shall be generic and can be applied to other IL-EG sensor systems.
IL/Electrode Interfacial Relaxation in Faradaic Conditions.
As previously discussed, when no redox analyte is present, the IL cation/anion polarization occurs when a potential is applied and the IL/electrode interface relaxes when the potential is removed and reset to the OCP. In the case where the redox analyte is present and common IL-EG sensors function at a feature potential that drives analyte redox reactions, the formation of products will have a detrimental effect on the electrochemical system leading to the baseline drift. In the current work, oxygen was selected as the redox analyte as it is a ubiquitous analyte in ambient condition with a unique reversible redox process in the IL electrolyte.
In the presence of a redox analyte, our investigation implied that larger ti/ts ratio is also helpful for the IL/electrode interface relaxation, and the current–time signal stability is enhanced as well. The measured current–time curves in the presence of 5% oxygen, using the stepped potential waveform, are presented in Figure S5d–f. Plots of the ΔIavg/Iti=0 as a function of ti period in 5% oxygen/nitrogen mixture gas condition are presented in Figure 4. It is noteworthy to point out in Figure 4 that the ΔIavg/Iti=0 exhibit different trends at longer ti periods (30 min and 200 s) and shorter ti period (1 s). Such a phenomenon was not seen in non-faradaic conditions (see Figure 3). Thus, the facilitation of IL/electrode interface relaxation at larger ti/ts ratio is not the sole influential factor. Jewell et al.53 reported the reactivity enhancement of platinum material after repetitive reducing and oxidizing surface adsorbed redox species. Based on this theory, we ascribed the observed phenomenon as a consequence of platinum electrode activation. In our case, oxygen was reduced to O2•− species at −1.2 V. When this potential was removed during the ti period, the recorded OCP values were anodic enough to oxidize the O2•− species to oxygen molecules. Such a phenomenon was not significant at a shorter ti period (e.g., ti = 1 s), as only a small amount of O2•− species was produced and consequently there was less platinum electrode activation over a short ti period. Another explanation lies on the current decay speed of the capacitive current and the faradaic current (the faradaic current decays slower than the capacitive current). According to an early work of our group,17 the faradaic current could dominate when current–time curves were measured at times longer than 300 s, and vice versa. Thus, with the intermittent potential polarization and OCP at the ti period, the reactivated platinum working electrode caused larger faradaic current in measurements when ts = 30 min (Figure 5a). Wang et al.17 also reported that at the 0–150 s time scale of the current–time curve, the capacitive charging current stands out and the current–time response reflects the slow IL/electrode interface relaxation. Hence, at larger ti/ts ratios (especially when ts is small), increasing ΔIavg/Iti=0 was not observed owing to less redox byproduct perturbation as well as insignificant loss of electrode reactivity. Nevertheless, such increased current–time responses at a larger ti/ts ratio were not observed in the KWJ cell (Figure S6d–f), most likely because the KWJ cell uses platinum black as the working electrode material that inherits high reactivity versus the polycrystalline platinum material.
Figure 4.

Plots of the ΔIavg/Iti=0 as a function of the idle period, when the sensing period varied as 30 min, 200 s, and 1 s. Measurements were performed in 5% oxygen/nitrogen mixture gas condition.
Figure 5.
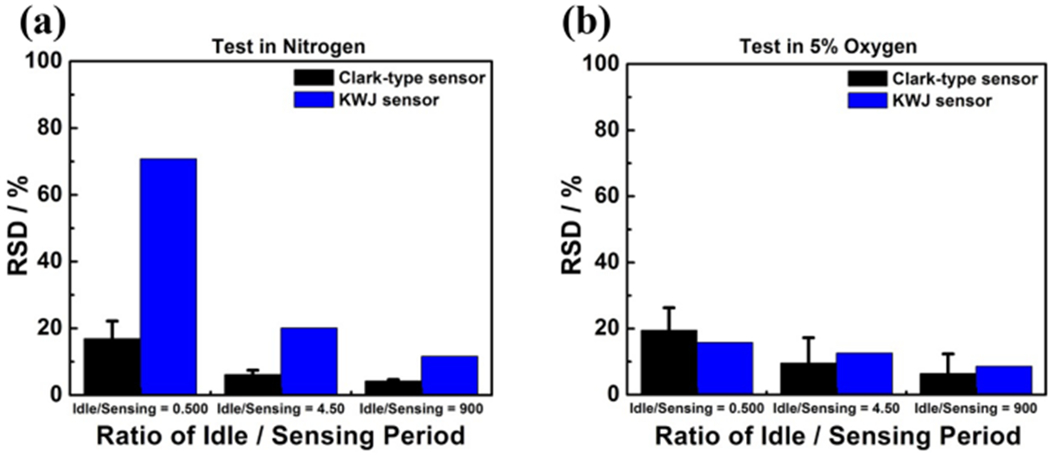
Plot of the RSD of the measurements at three different ti/ts ratios in (a) inert nitrogen condition and (b) 5% oxygen/nitrogen mixture gas condition. The three analyzed ti/ts ratios are (1) idle:sensing = 0.5000 (ti = 15 min, ts = 30 min), (2) idle:sensing = 4.50 (ti = 15 min, ts = 200 s), and (3) idle:sensing = 900.9 (ti = 15 min, ts = 1 s).
Values of the SD and RSD of each of the measured current–time curves in 5% oxygen condition are summarized in Table S4. The RSD values are comparably smaller when the ts period was shorter and the ti period was longer. Smaller RSD indicates better current–time signal stability. A comparison of the RSD among three different ti/ts ratios is shown in Figure 5, validating that larger ti/ts ratio (or in other words, longer ti period and shorter ts period) facilitates not only the baseline current stability when no redox analyte is present but also the current–time stability in the presence of the redox analyte.
As under a potential polarization, unoccupied spaces at the IL/electrode interface were reported to be reduced in both size and number and could expel the surface adsorption of analyte gas molecules.32 It is thus necessary to quantify the oxygen concentration using the Cottrell equation (eq 2). The oxygen concentration obtained from the Cottrell equation represents the oxygen concentration in the diffusion layer. However, it gives a relative comparison of the oxygen concentrations at the IL/electrode interface, allowing us to have an understanding of whether the IL-EG oxygen sensor signal drift comes from the decrease of the oxygen concentration at the IL-electrode interface at tested conditions. Detailed data are summarized in Table S5 and plotted in Figure S7. Results indicated that longer ti helps to restore the oxygen concentration in the IL/electrode interface back to the corresponding initial value. This result is important for the design of the optimum analytical strategy for continued-use IL-EG sensors.
Benefits of Larger Idle/Sensing Ratio and IL/Electrode Conditioning.
According to Xiao et al54 the oxygen reduction product (O2•−), will form an ion pair with the IL cation, changing the electrochemical system, which can affect the reactivity of oxygen reduction at the platinum working electrode. In addition, the high viscosity of the IL will cause slow diffusion of both the reactant oxygen molecules and the product O2•− species in the IL. Thus, the O2•− species has sufficient time to accumulate at the IL/electrode interface.54 Such a phenomenon will alter the initial condition of the IL/electrode interface. Therefore, for a continuous and real-time oxygen sensor, a calibration method is necessary to address this baseline signal drift in the applied potential waveform programs.
Bear in mind from the previous discussion that longer ti and shorter ts favors the current–time signal stability both with and without the redox analyte, such signal stability also depends on the dissolved oxygen concentration that also correlates to its initial value. We thereby hypothesized the ion arrangement conditions at the IL/electrode interface under different potentials in Scheme 1, and conducted the 80-repetitive-measurement cycle stepped potential measurements (Figure 6) to study the multiple polarization effects on the sensor signal stability with the consideration of both aspects: (1) minimizing ts (or increasing the ti/ts ratio) while (2) incorporating an IL/electrode interface conditioning step at 0 V (Econd = 0 V). As the oxidation peak potential of the O2•− species was −0.7 V (see Figure S2), the potential in the idle period was set to 0 V for the purpose of facilitating the removal of surface adsorbed O2•− species, maintaining the same initial IL/electrode interface condition before each measurement cycle. The merit of this conditioning step is also demonstrated in Figure S8 in which a fixed IL/electrode interface initial condition can be guaranteed.
Scheme 1. Hypothesized Ion Arrangement Conditions at the IL/Electrode Interface under Different Potentialsaa.
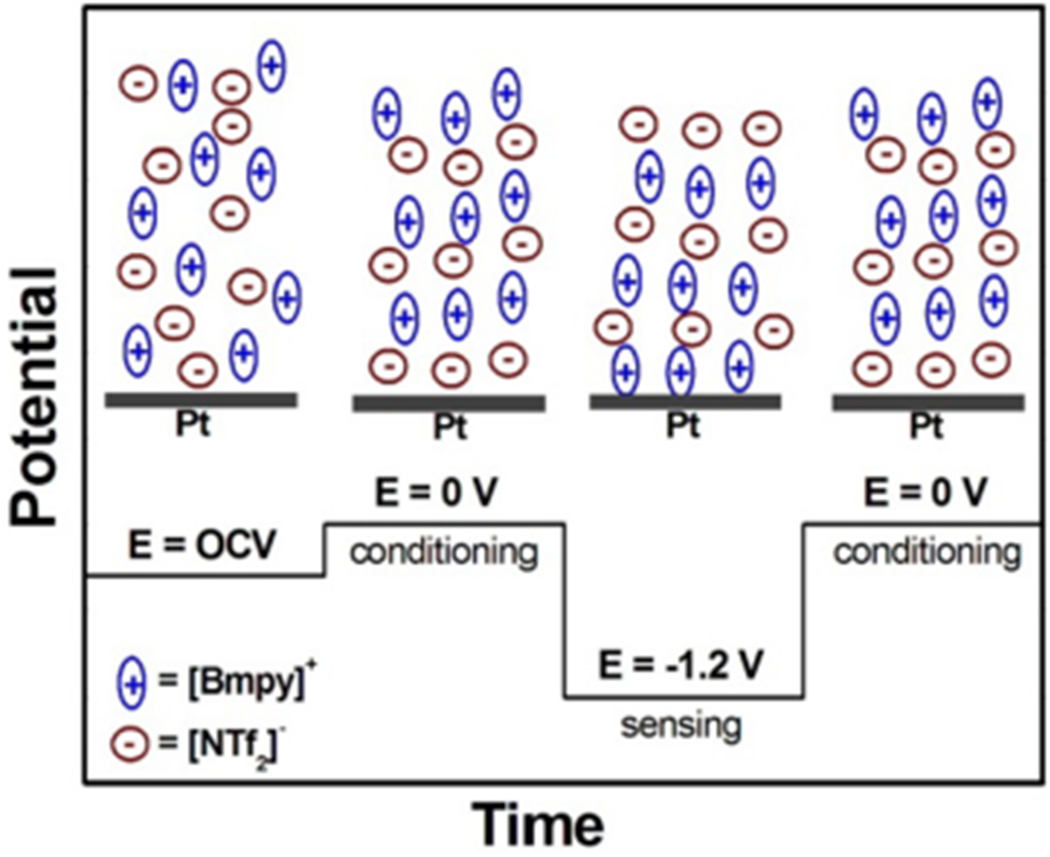
aThe recorded OCP of our IL-EG sensor was −38.07 μV; thus, we assume that more anions will aggregate at the IL/electrode interface when a 0 V conditioning potential was applied.
Figure 6.

Stepped potential voltammetry current–time responses for a total 80-cycle intermittent idle and sensing period, incorporating the IL/electrode interface conditioning step (set the conditioning potential Econd as 0 V) during the idle period. Two ti/ts ratios: (a) ti = 59 s and ts = 1 s, and (b) ti = 159 s and ts = 1 s. Trends of the current–time signals at ts period were marked by cyan lines. The time presented in the x-axis only reflected the total sensing period. The data acquisition from the Princeton AMETEK instrument did not record signals during the ti periods. Data acquisition rate: 1 data point per 0.02 s.
Two different ti/ts ratios were studied in these measurements with 80 cycles of potential polarization between 0 V and −1.2 V. The results implied that measurement set as a larger ti/ts ratio exhibits better signal stability and a greater extended functioning sensor lifetime. Both measurements began with the IL/electrode interface conditioning step (Econd = 0 V) under inert nitrogen condition for 10 min, followed by 80 cycles of intermittent −1.2 V potential polarization (ts period) and 0 V conditioning step (ti period), as depicted in Figure S9a. A 5% oxygen/nitrogen mixture gas was introduced to the measurements at the 12th cycle. When the ti/ts ratio was 59:1 and 159:1, the current–time signals density was −80.32 and −80.54 μA/cm2, respectively. Trends of the current–time signals at the ts period (utilizing the last data point at each ts period, marked by the cyan arrow in Figure S9b) in both measurements were marked by cyan lines. At the smaller ti/ts ratio, the current–time signal exhibited a significant drift to a value of −18.22 μA/cm2 at the 80th cycle, which was a drift of nearly 77%. Considering a 5% signal drift, the test cell functioning cycle life was 51 cycles, which equals 3060 s (~0.85 h). Inspirationally, a tremendous improvement of the current–time signal stability was attained at the larger ti/ts ratio. The current–time signal at the 80th test cycle only drifted to −77.64 μA/cm2, which was only a drift of 4.4%. Consequently, the test cell cycle life was anticipated to be more than 80 cycles. This is equivalent to 12 800 s (~3.6 h), an extension of four times. These parallel measurements demonstrated the benefit of sensor operation at higher ti/ts ratio and lower ts frequency in the enhancement of the sensing signal stability and extension of the functioning lifetime.
CONCLUSIONS
This work quantitatively studied the external potential polarization in affecting the IL/electrode interfacial relaxation process as well as the current–time signal stability that is important for the development of continuous IL-EG gas sensors. A stepped potential chronoamperometry at various time lengths and frequencies of the potential polarization, with or without the presence of redox analyte of oxygen, was systematically characterized. At an applied potential, the ion polarization and the analyte oxygen redox reaction effects on the IL/electrode interface have been observed to be cumulative and are responsible for current–time signal instability. This is because of the slow diffusion coefficient of the IL and subsequently the slow IL/electrode interface relaxation processes when the external potential was reset to the OCP. Results also implied that the IL/electrode interface relaxation could be facilitated at a larger ratio of idle versus sensing period (the ti/ts ratio). In other words, at larger ti/ts ratio, the baseline signal stability of an IL-EG sensor could be enhanced, leading to better quality assurance among multiple measurements. Moreover, by incorporating an IL/electrode interface conditioning step at 0 V, a fixed IL/electrode interface initial condition can be guaranteed, thus enhancing the current–time signal stability. Demonstrative measurements validated that not only the current–time signal stability could be enhanced (<4.4% drift) but also an extended test cell functioning cycle life was achieved (>4 times of improvement), when the ti/ts ratio was increased from 59:1 to 159:1.
In this study, two different electrochemical cells (i.e., lab assembled layered structural Clark-type cell and a commercial microfabricated planar KWJ cell) were utilized for measurements, which allows us to put forth a universal understanding of the IL/electrode interface characteristics under a potential polarization and the removal of this polarization. Further study can shed light on the future IL-EG sensor operations and methods design for continuous-use gas sensing applications.
Supplementary Material
ACKNOWLEDGMENTS
X. Zeng acknowledges the NIH-NIEHS (R01ES022302) support and partly support by Alpha Foundation (AF518) award for this work. We would also like to thank KWJ Inc. for providing the commercial gas sensor cell for this study. Dr. Xiaojun Liu’s help in proofreading is acknowledged.
Footnotes
Supporting Information
The Supporting Information is available free of charge on the ACS Publications website at DOI: 10.1021/acssensors.8b00155.
Cyclic voltammograms; Constant potential chronoamperometry and analysis of signals; Recordings of the open circuit potential versus time; Current–time responses; Plot of the dissolved oxygen concentration (PDF)
The authors declare no competing financial interest.
REFERENCES
- (1).Räsänen R-M; Nousiainen M; Peräkorpi K; Sillanpää M; Polari L; Anttalainen O; Utriainen M Determination of gas phase triacetone triperoxide with aspiration ion mobility spectrometry and gas chromatography–mass spectrometry. Anal. Chim. Acta 2008, 623 (1), 59–65. [DOI] [PubMed] [Google Scholar]
- (2).Datta S; Rule a M.; Mihalic JN.; Chillrud SN; Bostick BC.; Ramos-Bonilla JP.; Han I; Polyak LM.; Geyh a S.; Breysse PN Use of X-ray Absorption Spectroscopy To Speciate Manganese in Airborne Particulate Matter from Five Counties Across the United States. Environ. Sci. Technol 2012, 46 (6), 3101–3109. [DOI] [PMC free article] [PubMed] [Google Scholar]
- (3).Pingitore NE; Clague JW; Amaya MA; Maciejewska B; Reynoso JJ Urban airborne lead: X-ray absorption spectroscopy establishes soil as dominant source. PLoS One 2009, 4 (4), e5019. [DOI] [PMC free article] [PubMed] [Google Scholar]
- (4).Bruns EA; Perraud V; Greaves J; Finlayson-Pitts BJ Atmospheric solids analysis probe mass spectrometry: a new approach for airborne particle analysis. Anal. Chem 2010, 82 (14), 5922–5927. [DOI] [PubMed] [Google Scholar]
- (5).Stetter JR; Pan L Amperometric carbon monoxide sensor module for residential alarms; US Patent 5,331,310 A, 1994-07-19.
- (6).Hübert T; Boon-Brett L; Black G; Banach U Hydrogen sensors–a review. Sens. Actuators, B 2011, 157 (2), 329–352. [Google Scholar]
- (7).Korotcenkov G; Han SD; Stetter JR Review of electrochemical hydrogen sensors. Chem. Rev 2009, 109 (3), 1402–1433. [DOI] [PubMed] [Google Scholar]
- (8).Anderson GL; Hadden DM The gas monitoring handbook; Avocet Press Inc, 1999. [Google Scholar]
- (9).Li H; Mu X; Yang Y; Mason AJ Low power multimode electrochemical gas sensor array system for wearable health and safety monitoring. IEEE Sens. J 2014, 14 (10), 3391–3399. [Google Scholar]
- (10).Li H; Mu X; Wang Z; Guo M; Zeng X; Mason AJ Room temperature ionic-liquid electrochemical gas sensor array system for real-time mine safety monitoring; In SENSORS, 2013; IEEE, 2013; pp 1–4. [Google Scholar]
- (11).Mu X; Wang Z; Guo M; Zeng X; Mason AJ Fabrication of a miniaturized room temperature ionic liquid gas sensor for human health and safety monitoring; In 2012 IEEE Biomedical Circuits and Systems Conference (BioCAS); 2012; pp 140–143. [Google Scholar]
- (12).Mu X; Wang Z; Zeng X; Mason AJ A robust flexible electrochemical gas sensor using room temperature ionic liquid. IEEE Sens. J 2013, 13 (10), 3976–3981. [DOI] [PMC free article] [PubMed] [Google Scholar]
- (13).Yin H; Wan H; Lin L; Zeng X; Mason AJ Miniaturized planar RTIL-based eletrochemical gas sensor for real-time point-of-exposure monitoring; In Healthcare Innovation Point-Of-Care Technologies Conference (HI-POCT), 2016; IEEE; 2016; pp 85–88. [Google Scholar]
- (14).Wan H; Yin H; Lin L; Zeng X; Mason AJ Miniaturized planar room temperature ionic liquid electrochemical gas sensor for rapid multiple gas pollutants monitoring. Sens. Actuators, B 2018, 255, 638–646. [DOI] [PMC free article] [PubMed] [Google Scholar]
- (15).Stetter JR; Penrose WR; Yao S Sensors, chemical sensors, electrochemical sensors, and ECS. J. Electrochem. Soc 2003, 150 (2), S11–S16. [Google Scholar]
- (16).Bard AJ; Faulkner LR; York N; Brisbane W; Toronto SE Electrochemical methods – Fundamental and Applications; 2001.
- (17).Wang Z; Lin P; Baker GA; Stetter J; Zeng X Ionic liquids as electrolytes for the development of a robust amperometric oxygen sensor. Anal. Chem 2011, 83 (18), 7066–7073. [DOI] [PubMed] [Google Scholar]
- (18).Jitvisate M; Seddon JRT Direct Measurement of the Differential Capacitance of Solvent-Free and Dilute Ionic Liquids. J. Phys. Chem. Lett 2018, 9, 126–131. [DOI] [PMC free article] [PubMed] [Google Scholar]
- (19).Lockett V; Horne M; Sedev R; Rodopoulos T; Ralston J Differential capacitance of the double layer at the electrode/ionic liquids interface. Phys. Chem. Chem. Phys 2010, 12 (39), 12499–12512. [DOI] [PubMed] [Google Scholar]
- (20).Wang Z; Mu X; Guo M; Huang Y; Mason AJ; Zeng X Methane recognition and quantification by differential capacitance at the hydrophobic ionic liquid-electrified metal electrode interface. J. Electrochem. Soc 2013, 160 (6), B83–B89. [Google Scholar]
- (21).Limmer DT Interfacial ordering and accompanying divergent capacitance at ionic liquid-metal interfaces. Phys. Rev. Lett 2015, 115 (25), 256102. [DOI] [PubMed] [Google Scholar]
- (22).Kornyshev AA; Qiao R Three-dimensional double layers; ACS Publications, 2014. [Google Scholar]
- (23).Chu M; Miller M; Douglas T; Dutta P Ultraslow Dynamics at a Charged Silicon–Ionic Liquid Interface Revealed by X-ray Reflectivity. J. Phys. Chem. C 2017, 121 (7), 3841–3845. [Google Scholar]
- (24).Nishi N; Hirano Y; Motokawa T; Kakiuchi T Ultraslow relaxation of the structure at the ionic liquidlgold electrode interface to a potential step probed by electrochemical surface plasmon resonance measurements: asymmetry of the relaxation time to the potential-step direction. Phys. Chem. Chem. Phys 2013, 15 (28), 11615–11619. [DOI] [PubMed] [Google Scholar]
- (25).Uysal A; Zhou H; Feng G; Lee SS; Li S; Cummings PT; Fulvio PF; Dai S; McDonough JK; Gogotsi Y; et al. Interfacial ionic ‘liquids’: connecting static and dynamic structures. J. Phys.: Condens. Matter 2015, 27 (3), 32101. [DOI] [PubMed] [Google Scholar]
- (26).Druschler M; Huber B; Passerini S; Roling B Hysteresis effects in the potential-dependent double layer capacitance of room temperature ionic liquids at a polycrystalline platinum interface. J. Phys. Chem. C 2010, 114 (8), 3614–3617. [Google Scholar]
- (27).Gore TR; Bond T; Zhang W; Scott RWJ; Burgess I Hysteresis in the measurement of double-layer capacitance at the gold–ionic liquid interface. Electrochem. Commun 2010, 12 (10), 1340–1343. [Google Scholar]
- (28).Pinilla C; Del Popolo MG; Kohanoff J; Lynden-Bell R M. Polarization relaxation in an ionic liquid confined between electrified walls. J. Phys. Chem. B 2007, 111 (18), 4877–4884. [DOI] [PubMed] [Google Scholar]
- (29).Makino S; Kitazumi Y; Nishi N; Kakiuchi T Charging current probing of the slow relaxation of the ionic liquid double layer at the Pt electrode. Electrochem. Commun 2011, 13 (12), 1365–1368. [Google Scholar]
- (30).Xiong L; Aldous L; Henstridge MC; Compton RG Investigation of the optimal transient times for chronoamperometric analysis of diffusion coefficients and concentrations in non-aqueous solvents and ionic liquids. Anal. Methods 2012, 4 (2), 371–376. [Google Scholar]
- (31).Lin L; Zeng X Toward Continuous Amperometric Gas Sensing in Ionic Liquids: Rationalization of Signal Drift Nature and Calibration Methods. Anal. Bioanal. Chem In press. [DOI] [PubMed] [Google Scholar]
- (32).Wang Z; Guo M; Mu X; Sen S; Insley T; Mason AJ; Kral P; Zeng X Highly sensitive capacitive gas sensing at ionic liquid–electrode interfaces. Anal. Chem 2016, 88 (3), 1959–1964. [DOI] [PubMed] [Google Scholar]
- (33).Liu H; Liu Y; Li J Ionic liquids in surface electrochemistry. Phys. Chem. Chem. Phys 2010, 12 (8), 1685–1697. [DOI] [PubMed] [Google Scholar]
- (34).Chen F; Qing Q; Xia J; Li J; Tao N Electrochemical gate-controlled charge transport in graphene in ionic liquid and aqueous solutio. J. Am. Chem. Soc 2009, 131 (29), 9908–9909. [DOI] [PubMed] [Google Scholar]
- (35).Baldelli S Surface structure at the ionic liquid– electrified metal interface. Acc. Chem. Res 2008, 41 (3), 421–431. [DOI] [PubMed] [Google Scholar]
- (36).Choi S-H; Kim B-K; Park J; Kang C-H; Eom D-S An implementation of wireless sensor network. IEEE Trans. Consum. Electron 2004, 50 (1), 236–244. [Google Scholar]
- (37).Tang Y; Lin L; Kumar A; Guo M; Sevilla M; Zeng X Hydrogen Electrooxidation in Ionic Liquids Catalyzed by the NTf2 Radical. J. Phys. Chem. C 2017, 121 (9), 5161–5167. [DOI] [PMC free article] [PubMed] [Google Scholar]
- (38).Vranes M; Dozic S; Djeric V; Gadzuric S Physicochemical Characterization of 1-Butyl-3-methylimidazolium and 1-Butyl-1-methylpyrrolidinium Bis (trifluoromethylsulfonyl) imide. J. Chem. Eng. Data 2012, 57 (4), 1072–1077. [Google Scholar]
- (39).Endres F; El Abedin SZ Air and water stable ionic liquids in physical chemistry. Phys. Chem. Chem. Phys 2006, 8 (18), 2101–2116. [DOI] [PubMed] [Google Scholar]
- (40).Lei Z; Dai C; Chen B Gas solubility in ionic liquids. Chem. Rev 2014, 114 (2), 1289–1326. [DOI] [PubMed] [Google Scholar]
- (41).Hildebrand JH Principles of chemistry; Macmillan, 1919. [Google Scholar]
- (42).Wang Z; Guo M; Baker GA; Stetter JR; Lin L; Mason AJ; Zeng X Methane-oxygen electrochemical coupling in an ionic liquid: a robust sensor for simultaneous quantification. Analyst 2014, 139 (20), 5140–5147. [DOI] [PMC free article] [PubMed] [Google Scholar]
- (43).Tang Y; Zeng X Electrochemical Oxidation of Hydrogen in Bis (trifluoromethylsulfonyl) imide Ionic Liquids under Anaerobic and Aerobic Conditions. J. Phys. Chem. C 2016, 120 (41), 23542–23551. [DOI] [PMC free article] [PubMed] [Google Scholar]
- (44).Adelman WJ; Palti Y The effects of external potassium and long duration voltage conditioning on the amplitude of sodium currents in the giant axon of the squid, Loligo pealei. J. Gen. Physiol 1969, 54 (5), 589–606. [DOI] [PMC free article] [PubMed] [Google Scholar]
- (45).Aspelund A; Jordal K Gas conditioning–the interface between CO2 capture and transport. Int. J. Greenhouse Gas Control 2007, 1 (3), 343–354. [Google Scholar]
- (46).Arshak K; Moore E; Lyons GM; Harris J; Clifford S A review of gas sensors employed in electronic nose applications. Sens. Rev 2004, 24 (2), 181–198. [Google Scholar]
- (47).Motobayashi K; Minami K; Nishi N; Sakka T; Osawa M Hysteresis of Potential-Dependent Changes in Ion Density and Structure of an Ionic Liquid on a Gold Electrode: In Situ Observation by Surface-Enhanced Infrared Absorption Spectroscopy. J. Phys. Chem. Lett 2013, 4 (18), 3110–3114. [Google Scholar]
- (48).Zhou W; Inoue S; Iwahashi T; Kanai K; Seki K; Miyamae T; Kim D; Katayama Y; Ouchi Y Double layer structure and adsorption/desorption hysteresis of neat ionic liquid on Pt electrode surface — an in-situ IR-visible sum-frequency generation spectroscopic study. Electrochem. Commun 2010, 12 (5), 672–675. [Google Scholar]
- (49).Privett BJ; Shin JH; Schoenfisch MH Electrochemical sensors. Anal. Chem 2008, 80 (12), 4499–4517. [DOI] [PMC free article] [PubMed] [Google Scholar]
- (50).Lockett V; Sedev R; Ralston J; Horne M; Rodopoulos T Differential capacitance of the electrical double layer in imidazolium-based ionic liquids: influence of potential, cation size, and temperature. J. Phys. Chem. C 2008, 112 (19), 7486–7495. [Google Scholar]
- (51).Bottcher CJF; van Belle OC; Bordewijk P; Rip A Theory of electric polarization; Elsevier Science Ltd, 1978; Vol. 2. [Google Scholar]
- (52).Brookes R; Davies A; Ketwaroo G; Madden PA Diffusion coefficients in ionic liquids: Relationship to the viscosity. J. Phys. Chem. B 2005, 109 (14), 6485–6490. [DOI] [PubMed] [Google Scholar]
- (53).Jewell RC Platinum in the Glass Industry. Platin. Met. Rev 1964, 8 (4), 122–127. [Google Scholar]
- (54).Xiao C; Rehman A; Zeng X Evaluation of the dynamic electrochemical stability of ionic liquid–metal interfaces against reactive oxygen species using an in situ electrochemical quartz crystal microbalance. RSC Adv. 2015, 5 (40), 31826–31836. [Google Scholar]
Associated Data
This section collects any data citations, data availability statements, or supplementary materials included in this article.