

Abstract
We report on the implementation of an automated platform for detecting the presence of an antibody biomarker for human papillomavirus-associated oropharyngeal cancer from a single droplet of serum, in which a nanostructured photonic crystal surface is used to amplify the output of a fluorescence-linked immunosorbent assay. The platform is comprised of a microfluidic cartridge with integrated photonic crystal chips that interfaces with an assay instrument that automates the introduction of reagents, wash steps, and surface drying. Upon assay completion, the cartridge interfaces with a custom laser-scanning instrument that couples light into the photonic crystal at the optimal resonance condition for fluorescence enhancement. The instrument is used to measure the fluorescence intensity values of microarray spots corresponding to the biomarkers of interest, in addition to several experimental controls that verify correct functioning of the assay protocol. In this work, we report both dose-response characterization of the system using anti-E7 antibody introduced at known concentrations into serum and characterization of a set of clinical samples from which results were compared with a conventional enzyme-linked immunosorbent assay (ELISA) performed in microplate format. The demonstrated capability represents a simple, rapid, automated, and high-sensitivity method for multiplexed detection of protein biomarkers from a low-volume test sample.
Index Terms: automated, assay, biomarker, cancer, E7, fluorescence, human papillomavirus, immunoassay, microfluidic, oropharyngeal cancer, photonic crystal, point-of-care, serum
I. Introduction
THE last decade has seen a heightened interest in the discovery of new biomarkers and the development of more sensitive and specific biosensors for the screening, diagnosis, and monitoring of diseases at the point of care (POC). Cancer is commonly diagnosed via biopsy, which is highly invasive and impractical for serial sampling to monitor the efficacy of treatment. Biopsy is also inadequate for the detection of cancer in the early stages, when the likelihood of a palpable tumor is lowest and positive prognosis is highest [1–3].
Unlike the traditional biopsy, a liquid biopsy involves the detection of biomarkers within bodily fluids, such as blood, which can be obtained in a minimally invasive manner [4–6]. Blood-based protein [3, 7–11], nucleic acid [12–16], and circulating tumor cell [17, 18] biomarkers continue to be identified and clinically validated. It is now widely recognized that panels, rather than individual biomarkers, are necessary for accurate cancer identification and patient stratification [3, 4]. Integrated with a microfluidic platform, liquid biopsies are especially suitable for testing a few droplets of sample for multiplexed biomarker screening, early diagnosis, routine monitoring of treatment effectiveness, and regular follow-up for detecting remission.
Low biomarker concentration (picomolar range for proteins) in a liquid biopsy, especially during early-stage cancer [3], is an important technological challenge that can be addressed by methods for achieving a lower limit of detection (LOD) and improved signal-to-noise ratio (SNR). One such approach is the protein microarray, which generally utilizes the natural affinity of antigen-antibody interactions in immunoassays. Furthermore, DNA [19, 20] and protein [9, 20–23] microar-rays printed on photonic crystal (PC) surfaces can result in signal amplification of up to 8000× compared to microarray assays performed on ordinary glass substrates and scanned using a conventional fluorescence reader. Thus it is desirable to integrate PC-based fluorescence amplification technology into an automated platform for detecting bloodborne cancer biomarkers from a liquid biopsy [20].
PCs are comprised of a periodically modulated surface of alternating high and low refractive index (RI) materials (Fig. 1(a)). The PCs used in this work consist of a low RI silicon dioxide (SiO2) subwavelength one-dimensional grating structure coated with a high RI titanium dioxide (TiO2) layer, as described in the Methods section. With the correct combination of incident wavelength and angle, the “on-resonance condition” is fulfilled, resulting in PC enhanced excitation. A standing wave is generated within the TiO2 layer of the PC and extends into the surrounding medium (in this case, air) above the PC surface in the form of an evanescent field, and fluorophores on the PC surface are exposed to greater illumination intensity than they would receive if they were on an ordinary glass surface. While a similar effect could be achieved by utilizing a more powerful laser, PC enhanced excitation achieves amplification of only surface-bound fluorophores [24, 25], reducing background fluorescence and enabling the use of an inexpensive, low-power laser diode as the light source. Importantly, the detection instrument (Fig. 2) incorporates a motorized stage which enables tuning of the incident laser angle to its optimal on-resonant state, at which the greatest enhanced excitation effect occurs. In addition, PC enhanced extraction occurs for any photon emitter that approximately matches the wavelength of a resonant mode of the PC surface and directs emission to occur normal to the PC surface. This enables the detection optics to collect a greater proportion (5–10×) of all emitted photons, regardless of whether the enhanced excitation condition is met. PC enhancement can also be utilized to couple energy into nanoparticles [26] and Raman emitters to increase detected photon output [27].
Fig. 1.

(a) Schematic of the photonic crystal (PC) structure, composed of a high refractive index (RI) TiO2 layer and low RI SiO2 layer on a silicon substrate. (b) A 2 mm × 8 mm PC with some visible protein spots on a penny for size comparison. (c) Photo of the PC-integrated single- (left) and four-channel (right) cartridges, with food coloring to indicate sample flow channel. Sample is introduced through the sample inlet holes, outlined in red. In the four-channel cartridge, the center hole (purple) serves as the common inlet for reagents once connected to the automated flow system. Scale bar = 10 mm. (d) Exploded view of the four-channel microfluidic cartridge. Clear = acrylic, Blue = double-sided adhesive (DSA) layers (thickness = 150 μm), Orange = 2 mm × 8 mm × 725 μm PC, Gray = glass coverslip. (e) Schematic view of assembled four-channel cartridge.
Fig. 2.

Line scanner schematic. Both the laser diode and the sample are on motorized stages (with arrows indicating direction of motion) that allow computerized control over the illumination angle and position.
In this work, we present an implementation of PCEF that is compatible with a POC testing environment [28, 29]. The PC is embedded in a low-cost, easily manufacturable, single-use, disposable cartridge into which the user introduces a single droplet of serum. The cartridge is inserted into an assay automation station containing reservoirs of two reagents (wash buffer and fluorophore-labeled secondary antibody). Due to the length of time required for the incubation steps of the assay, it is important for independent test samples to be assayed simultaneously. Thus, a cartridge that enables multiplexed testing of up to four samples has been designed. After the assay is complete, the cartridge is inserted into the laser-scanning detection instrument. While the current instrumentation is semi-automatic and requires manual adjustment of the incident angle for optimal on-resonance illumination, we envision a completely automatic setup in which all scanning and detection steps occur with minimal user input.
We demonstrate the PCEF platform for detecting anti-E7 antibody, a biomarker for human papillomavirus (HPV)-associated oropharyngeal cancer (OPC), representing an application with a significant unmet clinical need that can benefit from POC analysis. The presence of host antibodies against specific viral proteins can provide valuable information regarding the disease state. HPV is commonly associated with various cancers, and of the ∼200 different types of HPV, fifteen are considered high-risk due to their oncogenic potential [30]. Those categorized as “high risk”, such as HPV types 16 and 18, produce oncoproteins that are particularly adept at inducing genomic instability and halting growth regulation pathways in cells [30]. While antibodies against the capsid protein L1 are indicative of an HPV infection or successful vaccination status [8], other proteins produced early in the viral life cycle— specifically E6 and E7—are known to play important roles in initiating and maintaining the malignant transformation of host cells, including the degradation of tumor suppressors p53 and Rb [30]. 40–80% of OPC cases have been attributed to HPV, and of these, up to 90% are caused by HPV16 [31]. Importantly, 63–69% of OPC cases have been demonstrated to be seropositive for HPV16 E7, with IgG antibodies to either E6 or E7 detected in less than 4% of healthy controls [7, 32, 33]. The identification of HPV association is clinically important, as the recommended therapy will be partially determined by HPV exposure, and HPV-OPC patients have a better prognosis than non-HPV-associated OPC patients [31]. Here, we focus on using the PCEF assay platform to detect anti-E7 IgG antibodies in spiked serum samples and in clinical samples with unknown anti-E7 antibody concentration to demonstrate its potential use in clinical diagnostic applications.
II. Methods
A. Preparation of the Photonic Crystal Sensor in Disposable Cartridges
PCs with a 40 nm grating depth, 360 nm period, 36% duty cycle, and 150 nm-thick, high refractive index (RI) TiO2 layer atop a 840 nm-thick low RI SiO2 layer (Fig. 1(a)) were fabricated on 8-inch-diameter silicon wafers and diced into 2 mm × 8 mm pieces (Fig. 1(b)) for incorporation within single- and four-channel microfluidic cartridges (Fig. 1(c)) as described previously [20, 22]. Fabrication upon silicon wafers using tools and methods that are conventional for integrated circuit manufacturing assures a high degree of intra-PC uniformity and reproducibility between independent PCs within a wafer and between wafers. All PCs have a resonant wavelength near 628 nm, with a bandwidth of ∼2 nm, and a resonant reflection efficiency of ∼80%. The devices are designed for utilization in an air environment, and resonant reflection spectra have been reported previously [20].
In preparation for deposition of capture proteins, the PCs were treated with (3-glycidyloxypropyl)trimethoxysilane (GPTMS) using a vapor-phase silanization process, as follows: PCs were sonicated sequentially in acetone, isopropanol, and ultrapure water for two minutes each, dried with N2, and then heated in an oven at 80°C for 10 minutes. PCs underwent oxygen plasma treatment for 2 minutes at 100 W and 0.75 mTorr. Plasma treated PCs were immediately placed in a closed glass container with GPTMS under nitrogen and incubated overnight (12–16 hours) in a vacuum oven at 80°C and 30 Torr. After silanization, the PCs were sequentially sonicated in toluene, methanol, and ultrapure water for two minutes each, dried with N2, and stored for up to a month under vacuum prior to protein microarray printing.
The protein microarray consists of ten rows of each protein column (shown schematically in Fig. 3(a)): 50 μg/mL Alexa Fluor 647 conjugated streptavidin (AF-SA, positive control); 160 μg/mL bovine serum albumin (BSA, negative control); 12.5, 25, and 50 μg/mL Protein A/G (experimental control); and 457.6 μg/mL protein E7 (prepared by the Anderson Lab at Arizona State University, ASU [34]). Protein microarrays were printed in-house using a non-contact printer (GeSiM Nano-Plotter 2.1) with piezoelectric pipetting tips (Nano-Tip A-J, designed for dispensing 0.25 nL droplets). Printing was performed in an enclosed environment at ambient temperature (24–28°C) and 60% relative humidity. Proteins were incubated overnight under these same conditions, allowing the formation of covalent bonds between the amines of the proteins and the epoxy functional groups on the silanized PC. The protein microarrays were then imaged using a bright-field microscope (Fig. 3(b)) and dried in the desiccator for at least 10 minutes to minimize spot smearing. The PCs were blocked with 1% casein in 1× PBS (Bio-Rad) for one hour to inhibit nonspecific binding. PCs were transferred into 1× PBS (Sigma-Aldrich), removed after 10 minutes, dried with N2, and stored in a sealed, desiccated container at 4°C.
Fig. 3.
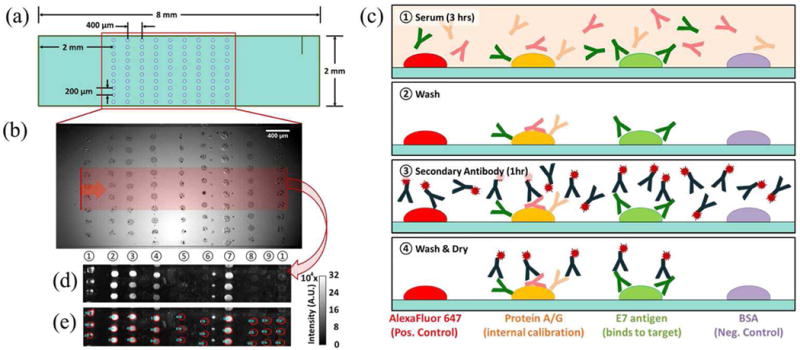
(a) Schematic of protein microarray printed on the 2 mm × 8 mm PC surface. (b) Bright-field microscope image of protein microarray before washing unbound proteins, where the red region corresponds to the area scanned with the line scanner, with the vertical laser line moving in the direction of the red arrow. (c) Schematic of fluorescence-linked immunosorbent assay (FLISA). ① Human serum was manually pipetted into the microfluidic cartridge and incubated for three hours. ② Phosphate buffered saline with Tween 20 (PBST) was flowed in for 30 s at 30 mBar. ③ Alexa Fluor 647-conjugated secondary antibody was incubated for 1 hour. ④ PBST was followed by drying with N2 gas. (d) Fluorescence intensity image obtained using the PCEF laser line scanner. (e) Result of the automated spot-finding algorithm. Protein columns for (b, d, e) are as follows: ① AF-SA, ② – ④ Protein A/G, ⑤ cE2 protein, ⑥ GST, ⑦ E7 protein, ⑧ BSA, and ⑨ representative background. Columns 5 and 6 were not evaluated here.
A custom-designed alignment press was used to assemble 25 mm × 75 mm × 8 mm single-channel and four-channel cartridges from layers of laser-machined acrylic of varying thicknesses and double-sided adhesive (DSA; 3M, #8212) of approximately 150 μm thickness. The cartridges are composed of: (1) a ¼-inch acrylic base layer, (2) three connective DSA layers, (3) a 1/32-inch PC cavity layer, and (4) a flow layer composed of two DSA layers (Fig. 1(d, e)). PCs with protein microarrays were inserted into the assembled cartridge, and the top was sealed with a 0.170 mm glass coverslip with minimal autofluorescence (Schott NEXTERION) immediately before performing the assay.
B. Fluorescence-Linked Immunosorbent Assay (FLISA) in the Automated Microfluidic Platform
The fluorescence-linked immunosorbent assay (FLISA) was performed in the microfluidic cartridges as shown in Fig. 3(c). For the dose-response assays, 6 μL of a twenty-fold dilution of human male AB serum (Sigma-Aldrich) in PBS spiked with known concentrations of mouse anti-E7 antibody (Santa Cruz Biotechnology) was manually pipetted into each of the four sample inlet holes in the four-channel cartridge. Forty clinical samples which had previously been approved for clinical testing as part of the HOTSPOT study (IRB-36563) [35] were provided by the Anderson Lab (ASU). Assays on the clinical samples were performed in single-channel cartridges with 10 μL of twenty-fold dilutions of the clinical sample in PBS.
The test sample was introduced by micropipette into the inlet hole of the microfluidic cartridge, where capillary action drew the liquid to cover the PC surface. Following a 3-hr incubation of the sample at room temperature, the cartridges were connected to an automated setup for controlled flow of reagents. To wash away unbound material from the serum sample, PBS-Tween 20 (PBST, Sigma-Aldrich) was flowed for 30 s at 30 mBar, followed by N2 gas for 10 s at 50 mBar, and flow-through of secondary antibody tagged with Alexa Fluor 647 (Jackson ImmunoResearch) for 20 s at 30 mBar. The secondary antibody, used to label the captured analytes, was comprised of one of the following: (1) A 1:1 mixture of 1 μg/mL goat anti-mouse antibody (for detecting spiked mouse anti-E7 antibody) and 1 μg/mL goat anti-human antibody (for detecting unidentified human antibodies bound to Protein A/G spots), used for the dose-response assays and (2) 1 μg/mL goat anti-human antibody, used for assays performed on clinical samples. PCs were incubated with the secondary antibody solution for 1 hour at room temperature, followed by automated flow of PBST for 30 s at 30 mBar. PCs were then dried with N2 flowing through the channel for 4 minutes. Finally, cartridges were removed, covered in foil, and stored in a desiccator at room temperature for at least two hours, until scanned.
C. Laser Line-scanning Detection Instrument
The laser line-scanning instrument, shown schematically in Fig. 2, incorporates an apodization filter into the optical path after the cylindrical lens. The laser line has a Gaussian profile as measured along the length of the scan line, which results in non-uniform illumination of the fluorescent spots across the width of the chip, as spots in the center of the line receive approximately 2× greater intensity than spots displaced only 200 μm from the center. The consequence of this non-uniform illumination is a large standard deviation of spot intensities of replicate assay spots. The apodization filter partially attenuates the center of the scan line, resulting in more uniform illumination and ensuring that the fluorescence intensity at the line edge is similar to the fluorescence intensity at the center (Supp. Fig. 1(a)). The apodization filter was fabricated by depositing a thin 12 nm layer of gold, 4 mm in diameter, at the center of an optically transparent glass plate (Supp. Fig. 1(b)).
The surface of the PC was scanned using the custom-designed laser line-scanning instrument to capture images of the fluorescently tagged protein spots (Fig. 3(d)). Importantly, the instrument is able to precisely adjust the incident angle of the laser illumination via motor-controlled linear translation of the distal end of the optical fiber that supplies light to the PC. The focal point of the cylindrical lens is at the back focal plane of the objective lens, so linear translation of the fiber tip results in modulation of the angle of light incident on the PC surface. In our system, a 500 μm linear translation of the fiber end results in an approximately 1.59° modulation of the angle of incidence, and the angle can be controlled with 0.025 degree accuracy.
To initiate the scanning process, the PC resonance angle at the anti-E7 spots was measured directly by scanning the incident angle from 0 to 8 degrees. Anti-E7 spots near the edge of the PC were used for this procedure so as not to photobleach the spots that are later scanned for analysis and quantification. The on-resonance angle of the anti-E7 spots, at which maximum fluorescence intensity is emitted, was recorded. Then, the sample stage was translated to an unscanned area of the chip to perform an on-resonance scan followed by an off-resonance scan (at an incident angle of 8°). On- and off-resonance scans are performed in the same area, encompassing 3–4 rows per column of printed protein spot on the PC surface, to estimate the enhancement factor contributed by the enhanced excitation mechanism.
The pixel size of the CCD camera is approximately 16 μm × 16 μm. After 10× magnification, this equates to a 1.6 μm × 1.6 μm square region of the sample, so images were gathered at 2 μm increments in the direction perpendicular to the laser line. A sliding window algorithm combines the fluorescence intensities of five consecutive scan lines per location to generate a single fluorescence intensity image of the surface. In other words, although the pixel width in the scan direction is only 2 μm, we capture a 10 μm image to get fluorescence information for 2 pixels away from the center in either direction. This ensures that we get the best estimate of fluorescence output due to the Gaussian intensity distribution of the laser intensity in the direction perpendicular to the scanning line.
To perform data analysis on the fluorescence intensity images, we have implemented an automated algorithm to find and analyze the spots (Fig. 3(e)). The algorithm uses Bernsen filtering and watershedding to identify local differences in intensity and to separate any unintended “satellite spots” (smaller, residue spots formed when more than one droplet is expelled from the printer tip during protein microarray printing) from the main printed protein spots [36]. Spots are also filtered by size and shape to exclude non-elliptical objects and background artifacts. This algorithm takes as input the raw fluorescence intensity data and outputs spot statistics, including median intensity, standard deviation, and average intensity of each column of spots. Each column represents either the positive control, negative control, experimental control, or target biomarker.
A representative blank area of the PC is selected to determine the background intensity, and its median intensity is subtracted from the median intensity of the corresponding protein spot, thereby accounting for vertical variations in the PC or in the laser line illumination. This method provides minimum covariance between spots, compared to other statistical analysis methods (e.g., average or maximum spot intensity, excluding background subtraction) [37]. The enhanced excitation factor, defined as the on-resonance intensity divided by the off-resonance intensity per assay column, is computed by averaging each background-subtracted spot column and provides insight as to how accurately the on-resonance angle has been determined.
III. Results and Discussion
A. Validating the Method for Finding On-resonance Angle
To validate our method of finding the on-resonance angle, we used semiconductor quantum dots (QDs) to quantify the output intensity at incremental deviations from what we determined to be the optimal resonance angle. QDs do not photobleach as quickly as organic fluorophores, enabling repeated scanning of the PC with a relatively stable emitted light intensity between subsequent scans. Even though the wavelength of the 637 nm laser in the scanning setup is not the optimal excitation wavelength for QDs, it is sufficiently within their excitation spectrum to cause them to emit a detectable signal. We obtained the on-resonance angle for different concentrations of the anti-E7 antibody and measured the fluorescence intensity at angles near the on-resonance angle (Supp. Fig. 2). The background-subtracted QD intensity is always maximized at the on-resonance angle, with the intensity decreasing as the incident angle deviates from the resonance condition. While intensity is largest at the resonance condition, the decay on either side is asymmetric. This discrepancy can be explained by the order in which these scans at different angles were performed, as the QDs gradually photobleach (significant decrease in intensity could not be detected after 3 minutes of continuous illumination) [38]. The PCs were first scanned at the on-resonance condition, followed by −0.2°, then +0.2°, then −0.4°, and finally +0.4° away from the on-resonance condition.
B. System Automation for Rapid Disease Screening
The assay workflow was devised to make the entire system automated and amenable to rapid processing for POC assays. The cartridge presented here is capable of testing four samples simultaneously and may be expanded to many more. The ability to multiplex samples decreased the time required to run batches of samples by approximately 7–10 minutes for each additional sample. A four-channel cartridge holder incorporating flanged tubing and press-fit connections was designed to interface with the cartridge and automated flow system. The use of laser-cut acrylic is cost-effective ($0.62/cartridge) for single-use disposable applications, especially compared to 3D-printed cartridges ($5/cartridge).
The automated spot-finding and analysis algorithm described in the Methods section reduced both data analysis time and user bias. Our algorithm ensures that all spots are analyzed in the same manner and that comparison between different data sets is statistically valid. While other groups have reported spot-finding algorithms [39], ours is specifically applicable for fluorescence assays, which includes distinguishing main spots from satellite spots while tolerating non-uniformity in spot size, location, and spacing on the PC surface.
C. Dose-Response Characterization
A dose-response curve for anti-E7 antibody spiked into serum was generated for concentrations ranging from 1 ng/mL to 1000 ng/mL (6.7 pM to 6.7 nM) for both on- and off-resonance conditions. Intensities obtained from calibration tests performed on different days were compared to each other by normalizing to the intensity at 100 ng/mL anti-E7 antibody on the corresponding day. A comparison of the on- and off-resonance calibration curves (Fig. 4) demonstrates the ability of the enhanced excitation phenomenon at on-resonance to bring spot intensities above the LOD to detect spots that otherwise would be classified as undetectable. While spot intensities for samples below 10 ng/mL are below the noise (defined as 3 standard deviations above the background) at off-resonance, the fluorescence enhancement of the on-resonance condition brings the spot intensities clearly above the numerical LOD at 10 ng/mL and even allows the spots to be visually detectable at 1 ng/mL (Fig. 4 inset). Due to signal saturation as a result of the enhancement, the sigmoidal curve begins to plateau sooner—between 100 and 250 ng/mL—in the on-resonance condition, while the off-resonance calibration curve does not appear to plateau within the range of tested concentrations. Furthermore, the approximate linear range of the on-resonance condition is narrower and spans the lower end of concentration values, ranging between 25 and 200 ng/mL, while the linear range at the off-resonance condition is broader but spans the higher end of the concentration values (approximately 100–500 ng/mL). By scanning a sample at both on- and off-resonance conditions, the platform could potentially quantify concentrations between 25 and 500 ng/mL (0.17–3.33 nM) of the target antibody in a sample, while detecting concentrations as low as 1 ng/mL (6.7 pM).
Fig. 4.

Dose-response curves obtained at (a) off-resonance and (b) on-resonance conditions for concentrations ranging from 1 ng/mL to 1 μg/mL of anti-E7 antibody. Intensities were normalized to the 100 ng/mL for each assay date. Insets show the line-scan images of the anti-E7 spots for 1, 10, and 100 ng/mL. Error bars represent ±1 standard deviation.
In addition to increasing the spot intensity, the on-resonance condition results in higher noise as intrinsic variability in the assay is amplified, resulting in varying enhancement factors (Supp. Fig. 3) and larger error bars at on-resonance compared to those at off-resonance. This intrinsic variability is predominantly caused by variations in spot density that occur during the drying process, called the coffee-ring effect, where the center has a lower protein density and a higher density ring is formed on the edge of the spot. The PC is sensitive to these variations, meaning that the on-resonance condition is either for the center or outer part of the ring, but not both. Additionally, non-specific binding introduces background noise that we were not successfully able to eliminate on these samples.
D. Clinical Samples
A total of forty clinical samples (gathered from 20 OPC patients and 20 healthy controls) were assayed using the PCEF platform at on- and off-resonance. Conventional ELISAs were run concurrently on aliquots of the same samples by the Demirci Lab (Stanford University) [34]. Our goal here was to evaluate the diagnostic capability of the PCEF platform to provide positive/negative discrimination of the presence of anti-E7 antibody, rather than to assess the clinical relevance of the antigen-antibody interaction of protein E7 and anti-E7 antibody in OPC patients. Therefore, the ELISA—an established diagnostic method—was chosen as the gold standard reference.
All OPC patient samples, plus three control samples, had detectable anti-E7 antibody when tested with ELISA, resulting in a total of 23 positive ELISA samples and 17 negative ELISA samples. Samples were filtered out of the final analysis if any inconsistencies (i.e., low positive control spot intensity or enhanced background instead of target spot) were present in the raw PCEF images and/or intensity values, reducing the final sample size from 40 to 31 (14 ELISA-positive and 17 ELISA-negative).
Receiver-Operator Characteristic (ROC) curves were generated based on the normalized spot intensities for both on-and off-resonance conditions from this final set of data, as shown in Fig. 5(a, b). As mentioned previously, the averages of the background-subtracted median spot intensities were normalized by the averaged background-subtracted median spot intensity for serum spiked with 100 ng/mL anti-E7 antibody, which served as a positive control for each batch of tests. The area under the curve (AUC) was 0.83 and 0.76 at off- and on-resonance, respectively, with an optimal specificity of 0.71 at a sensitivity of 0.79 for both off- and on-resonance conditions. Based on this specificity-sensitivity pair, the cutoff intervals were determined to be [0.20, 0.32) and [0.57, 0.61) for off- and on-resonance, respectively. In other words, samples with normalized intensity values greater than or equal to 0.32 were considered positive, while those with normalized intensity values less than 0.20 were considered negative at off-resonance. Similarly, at on-resonance, samples with normalized intensity greater than or equal to 0.61 were considered positive, while those less than 0.57 were considered negative. The cutoff range is relatively large at off-resonance due to the limited number of samples and the tendency for the values to be clustered at the lower range at the off-resonance condition (Fig. 5(c)). However, the range is much smaller at on-resonance, which tends to enhance the signal such that the values are spread out toward the upper range (Fig. 5(d)).
Fig. 5.

Results from 14 ELISA-positive and 17 ELISA-negative clinical samples. (a, b) Receiver-operator characteristic (ROC) curves for off-resonance and on-resonance conditions, using normalized spot intensities. Optimal specificity = 0.71 and sensitivity = 0.79 selected for further analysis. AUC = area under the curve (c, d) Scatter plot of background-subtracted intensity values before normalization for off-resonance and on-resonance. Bars show average ±1 standard deviation. Dotted line indicates the cutoff intensity value (1.7865×10³ and 8.347×10⁴ for off- and on-resonance, respectively). (e) PCEF results at off- and on-resonance, compared to ELISA results and OPC status for select samples, ① through ⑨, representing different variations in agreement between PCEF and ELISA results.
In almost all cases, the fluorescence intensity of the anti-E7 antibody spots was enhanced to a visible level at the on-resonance condition. The samples were enhanced variably between the off- and on-resonance conditions, with an enhanced excitation factor ranging between 10× and 25× for most samples, and up to 100–200× in a few cases. (Note that the enhanced extraction factor of ∼10× is always active.) The intensities are noticeably higher at on-resonance compared to those at off-resonance, hence several samples which were considered negative at off-resonance became positive when measured at the on-resonance angle.
While Supp. Table I tabulates the results from all the acceptable samples, Fig. 5(e) shows the off- and on-resonance E7 spot images obtained with PCEF, compared to the ELISA results and OPC status of select samples. Samples 1 and 2 represent those samples in which both the off- and on-resonance results correlated with both the ELISA and OPC status. Samples 3 through 9 represent samples in which there were discrepancies between the quantitative PCEF results and the ELISA status. More specifically, samples 3 through 5 indicate instances where at least one PCEF result (off- or on-resonance) was positive for an ELISA-negative sample. Overall, the high rate of false positives (29%) may be attributed to the increased ability of the PCEF system to enhance the signal intensity, perhaps indicating a higher sensitivity than the ELISA. Meanwhile, samples 6 through 9 represent cases in which at least one PCEF result was negative for an ELISA-positive sample. Sample 9 is the one case in which both PCEF results were negative for an ELISA-positive sample. When treated separately, the false negative rate was 14% for both the off- resonance and on-resonance conditions. However, when the two results are combined such that any sample found to be above the cutoff range for either off- or on-resonance is considered to be positive, the false negative rate decreases to 7%, while the false positive rate increases to 41% (corresponding to 59% specificity and 92% sensitivity).
Furthermore, a qualitative (rather than quantitative) analysis by visual inspection of the on-resonance images at a fixed intensity range from 0 to 3.2×10⁵ arbitrary units (A.U.) shows all of the ELISA-positive samples to be positive, resulting in a sensitivity of 1.0 (but specificity of 0.12). A similar qualitative analysis of the off-resonance images at a fixed range from 0 to 1.0×10⁵ A.U. results in a specificity of 0.76 and sensitivity of 0.64. As seen with sample 9, a relatively high background can result in a low numerical value, so that it is found to be below the cutoff value in a quantitative analysis, even though it is clearly visible in a qualitative analysis.
The detection of anti-E7 antibody in the plasma samples of healthy controls in the “false positive” cases discussed above can be attributed to the fact that these biomarkers may be detected in the blood serum before the tumor has taken a detectable form. Of the possible biomarkers for HPV16, the late proteins such as L1 and L2 are detectable in patients who have HPV16, whether it is currently active or not. It has been hypothesized that the early proteins, such as E7, may be more indicative of a cancer-related HPV infection, because these proteins are produced in the cytoplasm of cells and are not readily exposed to the blood. However, as long as an infected cell undergoes apoptosis or necrosis, antibodies against the protein may still be detected in the blood independent of the presence of a tumor, potentially explaining the detection of anti-E7 antibody in the serum of OPC-negative healthy controls. However, the enhanced fluorescence mechanism of our assay increased the false positive rate, and the results suggest that the anti-E7 antibody may not be as promising for the clinical diagnosis of HPV-OPC as initially expected.
IV. Conclusion
Technologies for understanding disease pathogenesis, monitoring disease progression, and determining treatment efficacy are important for prompt diagnosis and improved prognosis of diseases, particularly cancer. Diagnostic tools best suited for this purpose are simple, rapid, and automated, with the ability to detect multiple targets in a biomarker panel from a low sample volume extracted through a minimally invasive method such as a finger-prick. In this work, we presented a fluorescence-based platform combining automated microfluidic assay instrumentation with a photonic crystal resonance coupling system that significantly reduces user error, decreases testing time, and has the potential for multiplexed biomarker panel detection. The potential for the PCEF assay system to be used in clinical applications was demonstrated by a dose-response characterization and clinical sample testing from single droplets of serum for anti-E7 antibody, a potential biomarker for HPV-OPC. An estimated combined linear range of 25–500 ng/mL (0.17–3.33 nM) was demonstrated when the dose-response of both off- and on-resonance conditions was considered, while concentrations as low as 1 ng/mL (6.7 pM) were visually detectable at on-resonance. In particular, the PCEF assay system was compared to the conventional ELISA test and has been shown to be able to bring undetectable spots at the off-resonance condition and in the ELISA above the detectable range. The current system, with its combined 7% false negative rate and 41% false positive rate, could serve as a useful tool for early screening, with semi-quantitative results placing clinical samples as either positive, negative, or indeterminate if the values lay within the cutoff interval.
The system can be further characterized and improved to make it more suitable for use as a quantitative diagnostic tool, which requires higher specificity. The protein microarray capability in the assay workflow can incorporate additional clinically relevant proteins in a protein biomarker panel to further improve the specificity of the system for diseases such as HPV-OPC. Furthermore, while the LOD achievable with the PCEF platform may be unnecessarily low for serum anti-E7 antibody—the clinically relevant range of which was shown to be in the high pM to low nM range via ELISA—this platform is easily adaptable to other diseases with significantly low biomarker concentrations.
Supplementary Material
Acknowledgments
The authors thank Dr. Weili Chen for fabricating the apodization filter, Ted Lao for implementing the watershedding algorithm, and Austin Stilger for assembling the microfluidic cartridges. The authors also thank the staff at the Micro and Nanotechnology Laboratory and colleagues from the Nano Sensors Group at the University of Illinois at Urbana-Champaign for their suggestions and helpful discussions.
This work was supported by grants from the National Institutes of Health (5R33CA177446-02 and 5R01GM086382-03). Any opinions, findings, conclusions, or recommendations expressed in this material are those of the authors and do not necessarily reflect the views of the National Institutes of Health.
Biographies
Caitlin Race received the B.E.E. and M.S. degrees in electrical and computer engineering from the University of Minnesota -Twin Cities in 2011 and 2012, respectively. She is currently working on her Ph.D. degree as a Graduate Research Assistant under the direction of Prof. Brian T. Cunningham at the University of Illinois at Urbana-Champaign, Urbana. Her research focuses on the design and characterization of optical biosensors and device fabrication processes.

Lydia Kwon received the B.S. degree in Biomedical Engineering from the University of California, Davis in 2012. She is currently pursuing an M.D., Ph.D. dual degree at the University of Illinois at Urbana-Champaign. Her research, under the direction of Prof. Brian T. Cunningham, focuses on the development of biological assays for the detection of various disease biomarkers using optical biosensors.
Myles T. Foreman received the B.S. degree from Texas A&M University and the M.S. degree from the University of Illinois at Urbana Champaign in 2014 and 2016, respectively. His main area of research at the University of Illinois was in biosensors and photonics focusing in electromagnetics. He attended the University of Colorado at Boulder as a Ph.D. student with a research focus on high-efficiency RF power amplifiers until 2017. He is currently an RF engineer at Lockheed Martin Missiles and Fire Control working in antenna engineering and radar cross section analysis.
Hakan Inan is a Postdoctoral research scholar at Canary Cancer Early Detection Center at Medicine Faculty-Stanford University. He is working on microfluidics- and nanotechnology-based diagnostic devices and techniques for cancer diagnosis and prognosis for point-of-care applications. He obtained his Master and PhD degrees in Nanotechnology. He joined Professor Utkan Demirci’s lab at Stanford University in 2014 as a visiting graduate student and has been performing his research in the same group since then. He had 12 years of teaching experience in high school and undergraduate level, where he taught Chemistry and Biochemistry.

Sung Jun Lim received the Ph.D. degree in chemistry from the Pohang University of Science and Technology (POSTECH), South Korea in 2010. He worked as a post-doctoral researcher at POSTECH (2010–2012) and at University of Illinois at Urbana-Champaign (2012–2016). He is currently a senior researcher in Daegu Gyeongbuk Institute of Science and Technology, South Korea. His major research interests include synthesis and characterization of colloidal semiconductor nanocrystals, widely known as quantum dots, and their applications towards biological imaging and optoelectronics.
Andrew Smith is an Assistant Professor of Bioengineering, Materials Science & Engineering, and Technology Entrepreneurship at the University of Illinois at Urbana-Champaign and the Carle Illinois College of Medicine. He joined the Illinois faculty in 2012 after receiving a B.S. in Chemistry and a Ph.D. in Bioengineering, both from the Georgia Institute of Technology, followed by postdoctoral training at Emory University. He has authored 51 publications, and has 7 patents granted or pending in the fields of nanomaterials engineering, single-molecule imaging, and molecular pathology.
Dr. Utkan Demirci, UofM’99, Stanford’01’05, is a Professor of Radiology with tenure and Electrical Engineering (by courtesy) at the Canary Center at Stanford for Cancer Early Detection, Stanford University School of Medicine where he leads a productive group of 20 researchers. Dr. Demirci’s lab is focused on creating micro- and nano-scale technologies that manipulate cells to enable solutions for real world problems in medicine. His group has pioneering contribution in multiple fields including infectious diseases, fertility, cancer diagnostics, cell encapsulation, cryobiology, and biofabrication. His research interests involve the application of microfluidics, nanoscale technologies and acoustics in medicine as it pertains to portable, inexpensive, disposable viral load technology platforms for HIV in resource-constrained settings for global health problems, as well as 3-D bioprinting and tissue models, including 3-D cancer and neural cultures. He has earned many awards including IEEE EMBS Early Career, NSF Career, MIT TR-35, and fellow-elect AIMBE. He holds over 20 patents, provisional, and disclosures and his patents have been translated into products through multiple start-up companies including DxNOW, Koek Biotechnology and LEVITAS. Some of the technologies developed in his lab are now clinically available across the globe, with over 10,000 live births in the US, Europe and Turkey being attributed to the sperm selection technology that came out of Dr. Demirci’s lab.

Prof. Brian Cunningham completed his Ph.D. at the University of Illinois at Urbana-Champaign in May 1990. He joined the Research Division of Raytheon, in Lexington, MA from 1991–1995, where he was the Group Leader for Infrared Sensors Fabrication. He joined the Micromachined Sensors Group at the Charles Stark Draper Laboratory in Cambridge, MA in 1995 as a senior member of the technical staff, where he later served in management roles that included Group Leader for MEMS Sensors, and Technical Director for Bioengineering Programs. At Draper Laboratory, Dr. Cunningham initiated efforts in biosensors, microfluidics, and tissue engineering. In 2000, he became the Founder and CTO of SRU Biosystems, a company established to commercialize Photonic Crystal (PC) biosensors, detection instruments, and assays for applications in drug discovery and diagnostics. Dr. Cunningham joined the faculty of the ECE Department at Illinois in 2004 as an Associate Professor, where he established the Nanosensors Group at the Micro and Nanotechnology Laboratory (MNTL). At Illinois, Prof. Cunningham served as the Director of the NSF-funded Center for Innovative Instrumentation Technology (CiiT), the first Industry/University Cooperative Research Center at MNTL, and served among the initial faculty to join the newly-formed Bioengineering Department, where he was the founding Director of the Bioengineering Graduate Program. Prof. Cunningham established the first M.Eng. professional master’s program in Bioengineering with strong participation from the UIUC Business School with a specialization in Bioinstrumentation. Prof. Cunningham was appointed as Interim Director of the MNTL in 2013, as was selected as Director of MNTL in 2014. He was named as the Donald Biggar Willett Professor of Engineering in 2015.

Prof. Cunningham has authored or co-authored >166 peer-reviewed journal papers, >84 issued US patents, >133 conference talks, and has delivered >117 invited lectures. He is a Fellow of IEEE, AAAS, NAI, OSA, and AIMBE. His work has been recognized through the IEEE Sensors Council Technical Achievement Award (2010) the Engineering in Medicine and Biology Society (EMBS) Technical Achievement Award (2014), and the IEEE Sensors Council Distinguished Lectureship (2013). His research interests include biophotonics, bionanophotonics, micro/nanofabrication processes & materials, BioMEMS, lab-on-a-chip, microfluidics, biosensing, and applications in drug discovery, health diagnostics, mobile point-of-use detection systems, life science research, environmental monitoring, animal health, and food safety. Prof. Cunningham’s key technical contributions and achievements stem from his invention and application of nanostructured photonic surfaces that efficiently couple electromagnetic energy into biological analytes, enabling high signal-to-noise sensing of materials that include small molecules, nucleic acids, proteins, virus particles, cells, and tissues. He has made key foundational contributions to the application of mobile devices (such as smartphones) to point-of-use detection systems that provide equivalent capabilities to laboratory-based instruments.
References
- 1.Brooks JD. Translational genomics: the challenge of developing cancer biomarkers. Genome Res. 2012 Feb;22:183–7. doi: 10.1101/gr.124347.111. [DOI] [PMC free article] [PubMed] [Google Scholar]
- 2.Wu L, Qu X. Cancer biomarker detection: recent achievements and challenges. Chem Soc Rev. 2015 May 21;44:2963–97. doi: 10.1039/c4cs00370e. [DOI] [PubMed] [Google Scholar]
- 3.Rusling JF, Kumar CV, Gutkind JS, Patel V. Measurement of biomarker proteins for point-of-care early detection and monitoring of cancer. Analyst. 2010 Oct;135:2496–511. doi: 10.1039/c0an00204f. [DOI] [PMC free article] [PubMed] [Google Scholar]
- 4.Brock G, Castellanos-Rizaldos E, Hu L, Coticchia C, Skog J. Liquid biopsy for cancer screening, patient stratification and monitoring. Translational Cancer Research. 2015 Jun;4:280–290. [Google Scholar]
- 5.Cree IA. Liquid biopsy for cancer patients: Principles and practice. Pathogenesis. 2015;2:1–4. [Google Scholar]
- 6.Karachaliou N, Mayo-de-Las-Casas C, Molina-Vila MA, Rosell R. Real-time liquid biopsies become a reality in cancer treatment. Ann Transl Med. 2015 Mar;3:36. doi: 10.3978/j.issn.2305-5839.2015.01.16. [DOI] [PMC free article] [PubMed] [Google Scholar]
- 7.Anderson KS, Wong J, D’Souza G, Riemer AB, Lorch J, Haddad R, et al. Serum antibodies to the HPV16 proteome as biomarkers for head and neck cancer. Br J Cancer. 2011 Jun 7;104:1896–905. doi: 10.1038/bjc.2011.171. [DOI] [PMC free article] [PubMed] [Google Scholar]
- 8.Ewaisha R, Meshay I, Resnik J, Katchman BA, Anderson KS. Programmable protein arrays for immunoprofiling HPV-associated cancers. Proteomics. 2016 Apr;16:1215–24. doi: 10.1002/pmic.201500376. [DOI] [PMC free article] [PubMed] [Google Scholar]
- 9.Huang CS, George S, Lu M, Chaudhery V, Tan R, Zangar RC, et al. Application of photonic crystal enhanced fluorescence to cancer biomarker microarrays. Anal Chem. 2011 Feb 15;83:1425–30. doi: 10.1021/ac102989n. [DOI] [PMC free article] [PubMed] [Google Scholar]
- 10.Jackson CE, Haig C, Welsh P, Dalzell JR, Tsorlalis IK, McConnachie A, et al. The incremental prognostic and clinical value of multiple novel biomarkers in heart failure. Eur J Heart Fail. 2016 Apr 25; doi: 10.1002/ejhf.543. [DOI] [PubMed] [Google Scholar]
- 11.Lawrenson K, Mhawech-Fauceglia P, Worthington J, Spindler TJ, O’Brien D, Lee JM, et al. Identification of novel candidate biomarkers of epithelial ovarian cancer by profiling the secretomes of three-dimensional genetic models of ovarian carcinogenesis. Int J Cancer. 2015 Oct 15;137:1806–17. doi: 10.1002/ijc.29197. [DOI] [PubMed] [Google Scholar]
- 12.Bettegowda C, Sausen M, Leary RJ, Kinde I, Wang Y, Agrawal N, et al. Detection of circulating tumor DNA in early- and late-stage human malignancies. Sci Transl Med. 2014 Feb 19;6:224ra24. doi: 10.1126/scitranslmed.3007094. [DOI] [PMC free article] [PubMed] [Google Scholar]
- 13.Dawson SJ, Tsui DW, Murtaza M, Biggs H, Rueda OM, Chin SF, et al. Analysis of circulating tumor DNA to monitor metastatic breast cancer. N Engl J Med. 2013 Mar 28;368:1199–209. doi: 10.1056/NEJMoa1213261. [DOI] [PubMed] [Google Scholar]
- 14.Kichukova TM, Popov NT, Ivanov HY, Vachev TI. Circulating microRNAs as a Novel Class of Potential Diagnostic Biomarkers in Neuropsychiatric Disorders. Folia Med (Plovdiv) 2015 Jul-Dec;57:159–72. doi: 10.1515/folmed-2015-0035. [DOI] [PubMed] [Google Scholar]
- 15.Nilsson RJ, Balaj L, Hulleman E, Rijn Svan, Pegtel DM, Walraven M, et al. Blood platelets contain tumor-derived RNA biomarkers. Blood. 2011 Sep 29;118:3680–3. doi: 10.1182/blood-2011-03-344408. [DOI] [PMC free article] [PubMed] [Google Scholar]
- 16.Vatandoost N, Ghanbari J, Mojaver M, Avan A, Ghayour-Mobarhan M, Nedaeinia R, et al. Early detection of colorectal cancer: from conventional methods to novel biomarkers. J Cancer Res Clin Oncol. 2016 Feb;142:341–51. doi: 10.1007/s00432-015-1928-z. [DOI] [PMC free article] [PubMed] [Google Scholar]
- 17.Alva A, Friedlander T, Clark M, Huebner T, Daignault S, Hussain M, et al. Circulating Tumor Cells as Potential Biomarkers in Bladder Cancer. J Urol. 2015 Sep;194:790–8. doi: 10.1016/j.juro.2015.02.2951. [DOI] [PMC free article] [PubMed] [Google Scholar]
- 18.Ilie M, Hofman V, Long-Mira E, Selva E, Vignaud JM, Padovani B, et al. “Sentinel” circulating tumor cells allow early diagnosis of lung cancer in patients with chronic obstructive pulmonary disease. PLoS One. 2014;9:e111597. doi: 10.1371/journal.pone.0111597. [DOI] [PMC free article] [PubMed] [Google Scholar]
- 19.Mathias PC, Jones SI, Wu HY, Yang F, Ganesh N, Gonzalez DO, et al. Improved sensitivity of DNA microarrays using photonic crystal enhanced fluorescence. Anal Chem. 2010 Aug 15;82:6854–61. doi: 10.1021/ac100841d. [DOI] [PMC free article] [PubMed] [Google Scholar]
- 20.George S, Chaudhery V, Lu M, Takagi M, Amro N, Pokhriyal A, et al. Sensitive detection of protein and miRNA cancer biomarkers using silicon-based photonic crystals and a resonance coupling laser scanning platform. Lab Chip. 2013 Oct 21;13:4053–64. doi: 10.1039/c3lc50579k. [DOI] [PMC free article] [PubMed] [Google Scholar]
- 21.Jones SI, Tan Y, Shamimuzzaman M, George S, Cunningham BT, Vodkin L. Direct detection of transcription factors in cotyledons during seedling development using sensitive silicon-substrate photonic crystal protein arrays. Plant Physiol. 2015 Mar;167:639–49. doi: 10.1104/pp.114.253666. [DOI] [PMC free article] [PubMed] [Google Scholar]
- 22.Tan Y, Tang T, Xu H, Zhu C, Cunningham BT. High sensitivity automated multiplexed immunoassays using photonic crystal enhanced fluorescence microfluidic system. Biosens Bioelectron. 2015 Nov 15;73:32–40. doi: 10.1016/j.bios.2015.05.041. [DOI] [PMC free article] [PubMed] [Google Scholar]
- 23.Mathias PC, Ganesh N, Cunningham BT. Application of photonic crystal enhanced fluorescence to a cytokine immunoassay. Anal Chem. 2008 Dec 1;80:9013–20. doi: 10.1021/ac801377k. [DOI] [PubMed] [Google Scholar]
- 24.Ganesh N, Mathias PC, Zhang W, Cunningham BT. Distance dependence of fluorescence enhancement from photonic crystal surfaces. Journal of Applied Physics. 2008 Apr 15;103 [Google Scholar]
- 25.Mathias PC, Wu HY, Cunningham BT. Employing two distinct photonic crystal resonances to improve fluorescence enhancement. Applied Physics Letters. 2009 Jul 13;95 doi: 10.1063/1.3184573. [DOI] [PMC free article] [PubMed] [Google Scholar]
- 26.Zhang W, Ganesh N, Mathias PC, Cunningham BT. Enhanced fluorescence on a photonic crystal surface incorporating nanorod structures. Small. 2008;4:2199–2203. doi: 10.1002/smll.200800367. [DOI] [PubMed] [Google Scholar]
- 27.Kim SM, Zhang W, Cunningham BT. Coupling discrete metal nanoparticles to photonic crystal surface resonant modes and application to Raman spectroscopy. Opt Express. 2010 Mar 01;18:4300–9. doi: 10.1364/OE.18.004300. [DOI] [PubMed] [Google Scholar]
- 28.Race CM, Kwon L, Cunningham BT. Achieving Uniformity and Reproducibility for Photonic Crystal Fluorescence Enhanced Disease Diagnostic Microarrays. 2016 Ieee Sensors. 2016 [Google Scholar]
- 29.Kwon L, Race C, Foreman M, Cunningham B. An automated microfluidic assay for the detection of cancer biomarkers in serum using photonic crystal enhanced fluorescence. 2016 Ieee Sensors. 2016 [Google Scholar]
- 30.Moody CA, Laimins LA. Human papillomavirus oncoproteins: pathways to transformation. Nat Rev Cancer. 2010 Aug;10:550–60. doi: 10.1038/nrc2886. [DOI] [PubMed] [Google Scholar]
- 31.Marur S, D’Souza G, Westra WH, Forastiere AA. HPV-associated head and neck cancer: a virus-related cancer epidemic. Lancet Oncol. 2010 Aug;11:781–9. doi: 10.1016/S1470-2045(10)70017-6. [DOI] [PMC free article] [PubMed] [Google Scholar]
- 32.D’Souza G, Gross ND, Pai SI, Haddad R, Anderson KS, Rajan S, et al. Oral human papillomavirus (HPV) infection in HPV-positive patients with oropharyngeal cancer and their partners. J Clin Oncol. 2014 Aug 10;32:2408–15. doi: 10.1200/JCO.2014.55.1341. [DOI] [PMC free article] [PubMed] [Google Scholar]
- 33.D’Souza G, Kreimer AR, Viscidi R, Pawlita M, Fakhry C, Koch WM, et al. Case-control study of human papillomavirus and oropharyngeal cancer. N Engl J Med. 2007 May 10;356:1944–56. doi: 10.1056/NEJMoa065497. [DOI] [PubMed] [Google Scholar]
- 34.Inan H, Wang S, Inci F, Baday M, Zangar R, Kesiraju S, et al. Isolation, Detection, and Quantification of Cancer Biomarkers in HPV-Associated Malignancies. Sci Rep. 2017 Jun 12;7:3322. doi: 10.1038/s41598-017-02672-6. [DOI] [PMC free article] [PubMed] [Google Scholar]
- 35.Anderson KS, Gerber JE, D’Souza G, Pai SI, Cheng JN, Alam R, et al. Biologic predictors of serologic responses to HPV in oropharyngeal cancer: The HOTSPOT study. Oral Oncol. 2015 Aug;51:751–758. doi: 10.1016/j.oraloncology.2015.05.007. 2015. [DOI] [PMC free article] [PubMed] [Google Scholar]
- 36.Bernsen J. Dynamic Thresholding of Grey-level Images. Proceedings-International Conference on Pattern Recognition. 1986:1251–1255. [Google Scholar]
- 37.White AM, Daly DS, Zangar RC. Analysis of high-throughput ELISA microarray data. Methods Mol Biol. 2011;694:191–211. doi: 10.1007/978-1-60761-977-2_13. [DOI] [PubMed] [Google Scholar]
- 38.Wu X, Liu H, Liu J, Haley KN, Treadway JA, Larson JP, et al. Immunofluorescent labeling of cancer marker Her2 and other cellular targets with semiconductor quantum dots. Nat Biotechnol. 2003 Jan;21:41–6. doi: 10.1038/nbt764. [DOI] [PubMed] [Google Scholar]
- 39.White AM, Daly DS, Varnum SM, Anderson KK, Bollinger N, Zangar RC. ProMAT: protein microarray analysis tool. Bioinformatics. 2006 May 15;22:1278–9. doi: 10.1093/bioinformatics/btl093. [DOI] [PubMed] [Google Scholar]
Associated Data
This section collects any data citations, data availability statements, or supplementary materials included in this article.