

Abstract
Background:
Glypican-3 (GPC3) has been widely recognized in the progression of liver tumors for several years. The relationship between overexpression of GPC3 and the poorer prognosis of patients with hepatocellular carcinoma (HCC) was performed by 2 meta-analyses. However, there were also some latest literatures that indicated different conclusions distinctly. It is necessary for us to carry out a meta-analysis by adding the latest data from current studies to explore the correlation between GPC3 and prognostic value in HCC.
Methods:
We conducted a meta-analysis including a total of 14 studies to assess the potential prognostic significance of GPC3 expression for overall survival (OS) and disease-free survival (DFS). The expression of GPC3 was assessed by immunohistochemistry.
Results:
Fourteen studies with 2364 patients were incorporated in the meta-analysis. The combined hazard ratios (HRs) revealed that the overexpression of GPC3 could forecast a poor OS [n = 2233 in 12 studies, HR = 1.40, 95% confidence interval (95% CI): 1.07–1.85, Z = 2.42, P = .02] and DFS (n = 1308 in 10 studies, HR = 1.61, 95% CI: 1.13–2.30, Z = 2.63, P = .008) in HCC patients. Subgroup treated by hepatectomy indicated that the pooled HR of OS was 1.43 (95% CI: 1.01–2.01, P = .04) and the combined HR of DFS was 1.59 (95% CI: 1.09–2.31, P = .02). The pooled odds ratios (ORs) showed that high GPC3 expression was also extensively associated with worse tumor differentiation, later tumor stage, presence of vascular invasion, and hepatitis B virus (HBV) infection. Subgroup analyses for GPC3 on HCC OS based on the studies categorized by regions, follow-up period, and sample size were also conducted.
Conclusion:
The meta-analysis indicated that overexpression of GPC3 was significantly associated with poor prognosis in patients with HCC.
Keywords: clinicopathological parameter, glypican-3, hepatocellular carcinoma, meta-analysis, prognosis
1. Introduction
Hepatocellular carcinoma (HCC) is the leading lethal common malignancy that is the third reason of cancer-associated death worldwide.[1,2] Surgical resection combined with liver transplantation is considered to be an effective therapeutic method for HCC. However, it is frustrated that the prognosis of patients with HCC still be dissatisfactory due to high recurrence rate after surgical excision.[3] Therefore, it is urgently to identify novel and precise biological markers, which can not only diagnose HCC in its early stage but also predict outcome of patients with HCC after clinical treatments.
Glypican-3 (GPC3), a heparin sulfate proteoglycan, is a member of the heparan sulfate proteoglycans family. It locates external surface of cell membrane and also plays an essential role in cell modulation, proliferation, and differentiation.[4–9] A large number of literatures reported that the expression of GPC3 was lower or even absent in the normal tissue compared with malignant specimen and it distinctly expressed in HCC.[10–13] In the recent years, numerous immunohistochemical studies indicated that GPC3 could be used as a potential diagnostic marker for HCC generally.[14–16] What is more, GPC3 can facilitate cellular growth, adhesion, and migration by upregulating autocrine/paracrine canonical Wnt signaling and insulin-like growth factor-2 in vitro.[17] Therefore, GPC3 brought us to the forefront about its implication in HCC patients and it may be considered as a potential predicted factor in pathology.
The data of 6 retrospective studies and 2 meta-analyses have performed that high GPC3 expression was associated with poor prognosis in patients who suffered with HCC.[18–25] However, there were also some latest literatures indicating different conclusions distinctly.[26–31] It is essential for us to carry out a meta-analysis by adding the latest data from current studies to explore the correlation between GPC3 and prognostic value in HCC.
2. Materials and methods
2.1. Literature search and selection of studies
The databases of PubMed, EMBASE, Web of Science, the Chinese Biomedical Literature Database (CBM), and the Cochrane Library were searched systematically in September 2017 without time limitation. The search strategy was performed using the following keywords [GPC3 protein or glypican-3, human (MESH)] AND (carcinoma, hepatocellular or liver cancer or hepatoma (MESH)].
Eligible studies had to meet the following criteria: the research methods of included studies is cohort study; included patients with HCC who underwent liver resection or liver transplantation and the level of GPC3 was measured by immunohistochemistry (IHC); all studies must provide hazard ratio (HR) and 95% confidence interval (CI) for overall survival (OS) and disease-free survival (DFS) or give available information calculating HR and 95% CI; studies that described a relationship between the expression of GPC3 and clinicopathological features; the sample size was preferably greater than 20; and the studies must be published in English with full-text paper available;
2.2. Data extraction
We had adopted the standard form to extract the relevant information. The literature selection and data extraction were accomplished independently by 2 reviewers. All authors of the paper discuss the difference if the 2 reviewers have divergences. If the results provided by a literature are analyzed by both univariate and multivariate methods, we chose the latter. The raw data included the name of first author, following-up periods, sample size, publication year of studies, method of clinical treatment, patient basic features, cut-out level, vascular invasion, hepatic cirrhosis, the differentiation and stage of tumor, HR and OR and its 95% CI. We referred to the original article to define the high and low expression of GPC3.
2.3. Assessment of study quality
Quality assessment was performed by 2 independent reviewers who used the standard Newcastle–Ottawa quality assessment scale. Numbers from 0 to 9 (labeled as stars) represent different quality of each article. Studies marked 6 or more stars were regarded as high quality. An article can be given a maximum of 1 star (∗) for each numbered item within the Selection and Outcome categories. A maximum of 2 stars can be awarded for Comparability. After all the stars were summed, the article with more stars was thought as higher quality article.
2.4. Statistical analysis
In this study, all the data were analyzed by Review Manager Version 5.0 software (Copenhagen: The Nordic Cochrane Centre; The Cochrane Collaboration, 2008). All statistical data were pooled to analyze prognostic value to forecast the OS and DFS of patients with HCC. HRs and their 95% CIs had been extracted from each study and pooled to estimate the correlation between overexpression of GPC3 and the survival results of patients with HCC. If the HRs and statistical variables were not provided directly in a study, they were indirectly calculated from available data by methods introduced by Tierney et al[32] or obtained from Kaplan–Meier survival curve using Engauge Digitizer version 4.1 software (Mark Mitchell, Boston). To analyze the relationship between GPC3 overexpression and tumor pathological parameters, pooled odds ratios (ORs) and its 95% CIs were calculated to provide the effective value.
In the group with high GPC3 expression, HR >1 indicated a worse prognosis and OR>1 represents significantly vascular invasion, later stage, and high tumor grade when the P value less than .05 level or the 95% CI excluded the value 1. If the 95% CI did not include the value 1, the point estimate of the HRs or ORs was thought statistically significant at the P < .05 level. The degree of statistical heterogeneity was assessed by Q and I2 values. When I2 < 50% , a fixed-effect model can be performed; otherwise, a random-effect model was used. I2 exceeding 50% can be seen as a pointer of significant heterogeneity.[21] Publication bias of articles were checked by Begg funnel plot.
3. Results
3.1. Selection and characteristics of literature
In the initial literature retrieval process, we identified 349 articles regarding the relation of GPC3 and HCC by the above keywords. Three hundred nine studies were excluded first by filtering the titles and abstracts because they were reported in other language, case reports, or reviews. After full text was reviewed and assessed, 4 literatures were further excluded, as they lack relevant survival data. In 2 studies,[24,30] patients recruited were overlapping. In order to avoid double counting, only 1 of them with more available data was selected. Finally, 14 articles with 2364 patients that met our inclusion criteria were included in the present meta-analysis (Fig. 1).[18–22,26–31,33–35] Among the 14 articles, 7 literature were based on China,[18,21,28–30,33,35] 4 performed in Japan,[19,20,22,26] 1 in Taiwan,[31] 1 in Korea,[27] and 1 in USA.[34] All articles used the method of IHC to detect GPC3 expression in tissues. The results of immunohistochemical were shown by expression intensity and positive area in 2 studies, percentage of GPC3-positive staining cells in 9 studies, and image system analysis in 2 papers. The cut-off value that was used to evaluate “high or low” GPC3 expression was determined by investigators of each study. A unified of “high ” GPC3 cut-off value was not enacted in this study. The expression of GPC3 was mostly in the cytoplasm but some also existed on cell membranes in included studies. HRs and its 95% CIs of OS and DFS were extracted from all included articles or calculated indirectly by the methods described above. Initial treatment for patients with HCC with surgical resection was performed in 11 studies[18–22,26–29,31,35] and liver transplantation (LT) in 1 article.[30] The scope of sample size in all studies varies from 31 to 362. The number of patients with high expression of GPC3 varied from 20 to 270. Mean or median age varied from 43 to 69 years and the number of male population from 29 to 324. The follow-up period of all studies exceeded 3 years. The quality of the studies assessed by the Newcastle–Ottawa quality assessment scale was from 5 to 8 (with a mean of 6.4). The basic parameters of the 11 studies and clinicopathological characteristics are summarized in Table 1.
Figure 1.
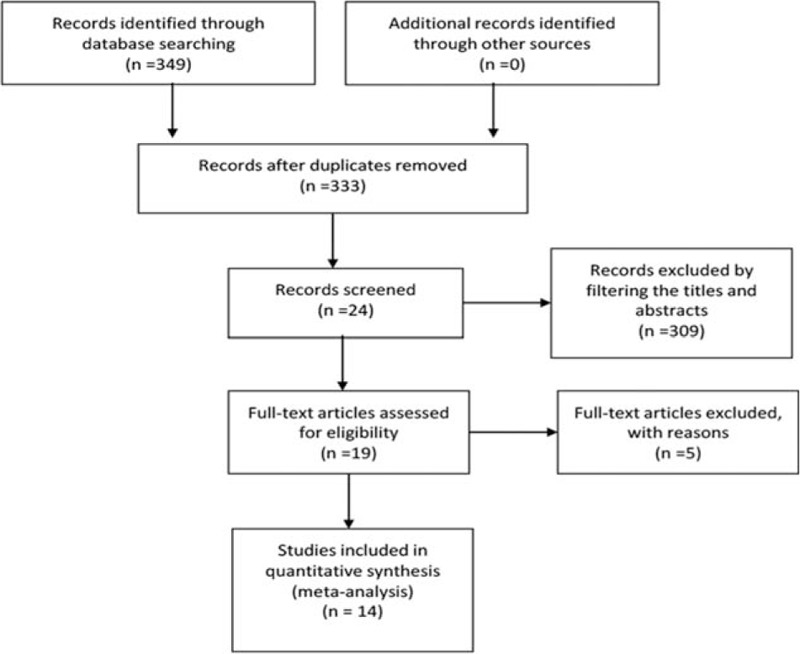
Flow chart of the study selection process.
Table 1.
Characteristics of studies enrolled.

3.2. Relevance between GPC3 overexpression and OS in patients with HCC
Twelve studies[18–22,26–29,33–35] demonstrated the relevance between GPC3 expression and OS in patients with HCC treated initially by surgical operation resection. Combined analysis from all 9 studies revealed that high GPC3 levels were significantly associated with poorer OS. The pooled HR was 1.40 (95% CI: 1.07–1.85, Z = 2.42, P = .02; Fig. 2A). However, high expression of GPC3 was markedly correlated with poor OS in all studies except Pan et al.[29] Low expression of GPC3 was indicated with poor OS in Chenwei pan. There were some moderate evidence for heterogeneity (Chi2 = 36.07, I2 = 70%, P < .001). To further validate the analysis, we divided all the literatures into 2 subgroups: China and Japan. Six original studies from China demonstrated strongly that there was no relevance between high GPC3 expression and OS. The pooled HR is 1.20 (95% CI: 0.82–1.76, Z = 0.95, P = .34; Fig. 2B) and indicated that heterogeneity was mainly caused by the data of the article by Pan et al.[29] Four articles from Japan indicated that high GPC3 expression was correlated with poorer OS. The pooled HR is 1.99 (95%CI: 1.43–2.77, Z = 4.11, P < .001; Fig. 2C).
Figure 2.

The correlation between glypican-3 (GPC3) overexpression and overall survival (OS) of patients with HCC (A); Subgroup analyses were performed by regions: China (B) and Japan (C), respectively.
We further analyzed the relationship between expression of GPC3 and OS based on studies treated by hepatectomy. The results indicated that there was significant association of high GPC3 expression with lower OS with a pooled HR of 1.43 (95% CI: 1.01–2.01, P = .04) (Fig. 3).
Figure 3.

The correlation between glypican-3 (GPC3) overexpression and overall survival (OS) based on studies treated by hepatectomy.
3.3. Relevance between GPC3 overexpression and DFS in patients with HCC
Nine studies demonstrated data on GPC3 expression and DFS in patients with HCC. Pooled data from all studies indicated that overexpression of GPC3 was significantly correlated with poor DFS because a combined HR value was 1.61 (95% CI: 1.13–2.30, Z = 2.63, P = .008; Fig. 4A). Eight studies showed that high GPC3 expression was markedly correlated with poor DFS. Low expression of GPC3 was indicated with poor DFS in the study by Pan et al.[29] There were some moderate evidence for heterogeneity (Chi2 = 26.05, I2 = 69%, P = .001). To further validate the analysis, we divided all the literatures into 2 subgroups: China and Japan. Five original studies from China demonstrated strongly that there was no relevance between high GPC3 expression and DFS. The combined HR is 1.59 (95% CI: 0.86–2.95, Z = 1.48, P = .14; Fig. 4B). Three articles from Japan indicated that high GPC3 expression was correlated with poorer DFS. The combined HR is 1.64 (95% CI: 1.02–2.64, Z = 2.06, P = .04; Fig. 4C). As described above, the presence of the study by Pan et al[29] partly leads to heterogeneity.
Figure 4.
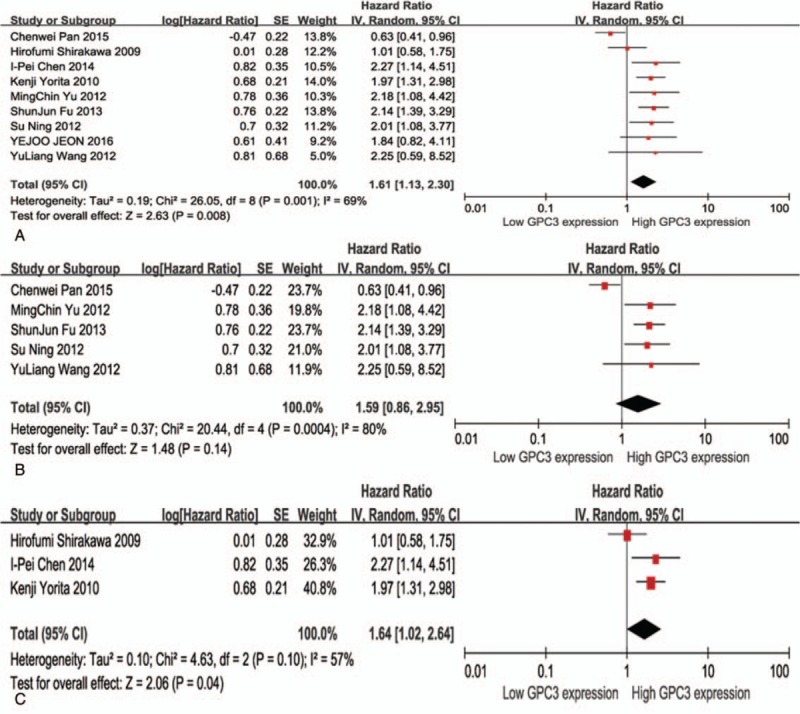
Meta-analysis of the correlation between glypican-3 (GPC3) overexpression and disease-free survival (DFS) of patients with HCC (A); Subgroup analyses were performed by region: China (B) and Japan (C), respectively.
We further analyzed the relationship between expression of GPC3 and disease-free survival according to studies treated by hepatectomy. The results indicated that there was significant association of high GPC3 expression with poor DFS with a pooled HR of 1.59 (95% CI: 1.09–2.31, P = .02) (Fig. 5).
Figure 5.
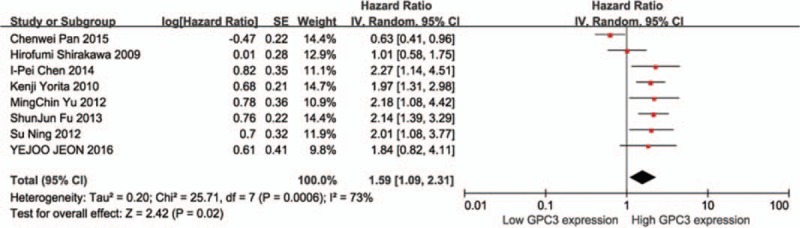
The correlation between glypican-3 (GPC3) overexpression and disease-free survival (DFS) based on studies treated by hepatectomy.
3.4. Relevance between GPC3 overexpression and clinicopathological features
To further investigate the effect of GPC3 on the prognosis of HCC, we analyzed the clinicopathological features.
Eight studies revealed that high expression of GPC3 seemed to be associated with vascular invasion in patients with HCC,[19–22,27,29,30,34] but statistical significance was provided in 2 studies. Pooled OR from all data indicated that high expression of GPC3 tended to be correlated with vascular invasion (OR: 1.69, 95% CI: 1.07–2.67, P = .02; Fig. 6A).
Figure 6.

Meta-analysis of the relationship between GPC3 expression and vascular invasion (A), tumor cirrhosis (B), tumor TNM stage (C), tumor grade (D), tumor size ≥ 5 cm (E), tumor multifocality (F), HBV infection (G), and HCV infection (H) in HCC. Results are shown as individual and pooled odds ratio (OR), and 95% confidence interval (CI).
The correlation between GPC3 expression and hepatic cirrhosis was provided in 9 articles,[18,20–22,26,27,29,31,33] but only 1 of the literature was statistically significant. Combined data from all 7 studies did not not show a trend between high expression of GPC3 with the presence of hepatic cirrhosis (OR: 1.21, 95% CI: 0.94–1.56, P = .14; Fig. 6B).
Eight studies also reported data on GPC3 expression and tumor TNM stage,[18–20,22,27,29,30,33] and the statistical significant relation was performed in 2 studies. High GPC3 expression was correlated with late tumor stage (III + IV) in 3 studies. Combined data from all 8 studies showed that high GPC3 expression tended to be correlated with the late TNM stage (OR: 1.69, 95% CI: 1.01–2.83, P = .04; Fig. 6C).
Seven studies also evaluated the relationship of GPC3 expression with tumor grade.[19–22,29,30,34] Two studies only provided a significant result. However, by pooling the data from the 5 papers, we discovered a significant correlation between high GPC3 expression and the poorer tumor grade (OR: 1.97, 95% CI: 1.02–3.83, P = .04; Fig. 6D).
The correlation between GPC3 expression and tumor size ≥ 5 cm in patients with HCC was supplied in 7 articles.[18,20–22,27,29,30] And all of them did not have statistical significant correlation. Combining the data from 7 studies also showed a trend that high GPC3 expression was not associated with the tumor size ≥ 5 cm (OR: 1.08, 95% CI: 0.80–1.47, P = .61; Fig. 6E).
A obvious correlation between GPC3 expression and tumor multifocality in patients with HCC was observed in all 8 studies,[19–22,26,27,29,34] but only 2 studies present statistical significant difference. Pooled data did not reveal a trend that high GPC3 expression was associated with the tumor multifocality (OR: 1.26, 95% CI: 0.67–2.34, P = .47; Fig. 6F).
Nine studies also reported data on GPC3 expression and hepatitis B virus (HBV) infection in patients with HCC. [19–22,26,27,29,33] Just 1 study presented statistical significance difference. Combining the data from 8 studies showed that high GPC3 expression was correlated with the HBV infection (OR: 1.45, 95% CI: 1.07–1.96, P = .02; Fig. 6G).
Five studies showed the association of GPC3 expression with HCV infection in patients with HCC.[19,20,22,26,27] The pooled data from 5 studies indicated that high GPC3 expression was not associated with HCV infection (OR: 1.34, 95% CI: 0.59–3.03, P = .48; Fig. 6H).
In conclusion, the results showed that high GPC3 expression was correlated with the HBV infection, worse tumor differentiation, later tumor stage, and presence of vascular invasion. The correlation between GPC3 overexpression and clinicopathological features is summarized in Table 2.
Table 2.
Association between GPC3 high expression and clinicopathological features.

3.5. Subgroup analysis
Subgroup analyses for the association between GPC3 and OS, based on regions, follow-up period, sample size, were performed to increase the homogeneity in the revised manuscript (Table 3). In the subgroup analysis based on original country, the pooled HR of the studies from China was 1.20 (95% CI: 0.82–1.76, P = .34). However, the combined HR was 1.99 (95% CI: 1.43– 2.77, P < .001) according to studies originated from Japan. When aggregating the studies separately based on the sample size, the tight association between GPC3 and poor OS was found only for studies with 200 or fewer cases (HR = 1.79, 95% CI: 1.44–2.22, P < .001). Furthermore, subgroup analysis was also conducted to assess whether the combined estimate of OS was different based on the follow-up period showed in the included studies.
Table 3.
Subgroup analyses for GPC3 on HCC overall survival.

3.6. Publication bias
The results showed that there was no evidence of publication bias detected in the OS studies or DFS studies, with no funnel plot asymmetry found in either study (Fig. 7).
Figure 7.

Begg funnel plots used to detect publication bias in overall survival (A) and disease-free survival (B) studies.
4. Discussion
HCC is a common malignancy that is related with poor prognosis as the high rate of recurrence and metastasis in patients with HCC after operation resection.[21] For several years, many investigators have been devoted to discover molecular markers associated with recurrence and metastasis of HCC, which will guide the clinical treatment and improve the prognosis of patients. GPC3 is significantly expressed in 70% to 100% of HCC cases, which manifest its function as a diagnostic marker of HCC according to a series of immunohistochemical studies.[15,36] Nevertheless, the prognosis utilities of GPC3 are still controversial. Meta-analysis is a valuable approach that pools the included studies and has been widely employed to assess the prognostic biomarkers in patients with malignant tumors.[37,38] Therefore, it is appropriate to perform a meta-analysis to systematically assess the correlation between GPC3 expression and HCC prognosis.
The previous meta-analysis indicated that high GPC3 expression was tightly correlated with poor prognosis in patients with HCC who received surgery, which was consistent with previous results conducted by Xiao et al[25] and Li et al.[23] In the present meta-analysis, not only several new literatures were added but also OS and DFS were firstly evaluated by pooling the data of eligible studies. The results demonstrated that GPC3 overexpression was associated firmly with poor OS and DFS in HCC patients (P = .02, P = .008, respectively). We researched the relationship between high GPC3 expression and clinicopathologic features and discovered that GPC3 overexpression was associated closely with later tumor stage, presence of vascular invasion, high tumor grade, and HBV infection. The research conducted by Sun et al[39] showed that the cellular proliferation and cycle progression in Huh7 and HepG2 cells would be influenced by suppressing GPC3, which also promoted the expression of TGF-β2 and enhanced apoptosis. Ruan et al[40] represented that suppress expression of glypican-3 may reduce that ability of growth and invasiveness in MHCC97-H human HCC cell line. These evidences explained the reason why GPC3 could facilitate the aggressive ability of HCC.
In this meta-analysis, the issue of heterogeneity is also urgent to explore and subgroup analyses for the association between GPC3 and OS, based on regions, follow-up period, sample size, were performed to increase the homogeneity. The results of subgroup analysis showed that the association was significant for studies with follow-up period ≤60 months and studies with 200 or fewer cases. When regions of studies were taken into account, we found that the association was significant for studies originated from Japan, while no significant association was observed for studies in China, which indicated that heterogeneity may be caused by Pan et al[29] and that the GPC3 expression status might be more valuable on predicting short-term and small-sample outcome of HCC. Therefore, more prospective studies are needed to verify the exact value of GPC3 for predicting HCC OS. Regarding OS and DFS, the data of the article of Pan et al[29] are different to other studies included in the meta-analysis, which may be caused by clinical heterogeneity such as different clinical stage, age, antibody type and source, physical condition, and analysis methods. Moreover, heterogeneity was also discovered when we analyzed the correction between GPC3 expression and tumor differentiation, HCV infection, vascular invasion, multifocality of tumor, and TNM stage. The main reasons may include different clinical treatments, various periods of follow-up, diverse detection methods, and the inconsistency of clinicopathological parameters. Therefore, random-effect model was carried out in the circumstances.
Compared with previous meta-analysis, novel findings were shown in this study. When treatment methods were taken into account, the results indicated that there was a significant association of high GPC3 expression with lower OS and poor DFS based on studies treated by hepatectomy. Due to the lack of sufficient data, subgroup analysis cannot be performed to assess whether the pooled estimate of OS and DFS was different according to the different therapy methods (hepatectomy, LT, RFA) reported in the included studies. Therefore, more prospective studies should be designed to verify the exact value of GPC3 for predicting HCC OS.
Fourteen articles with 2364 patients were included in the revised manuscript, which is more than the one reported by Li et al.[23] Furthermore, the results of patients with high GPC3 expression showed that pooled HR for OS and DFS was lower than that in the study by Li et al.[23] Several reasons may explain this discrepancy. First, the meta-analysis included more studies than Li et al,[23] which may provide more reliable and powerful statistics. Second, after a systematic search, patients originated from more regions with diverse backgrounds than Li et al,[23] which may draw a more conclusive result.
There are a number of limitations in this meta-analysis that should be discussed seriously. First, if HRs and its 95% CIs cannot be obtained directly from the studies, we indirectly extrapolate the data by using the available data provided by the article to or Kaplan–Meier survival curve using Engauge Digitizer version 4.1 software mentioned above, which may lack reliability than the data obtained directly from published statistics. Second, all patients enrolled in these studies were Asian population (China, Japan, and Korea). In Asia, most of HCC is related with hepatitis B (Chinese population) or C (Japanese population) virus infection. However, the predominant reason of HCC is correlated with alcohol or hepatitis C virus infection. So, whether the status of GPC3 expression and its function in western patients with HCC are same with Asian ones is still not clear, because there are no available data about western populations till now. Third, all literatures selected in this analysis were positive for GPC3 expression in tissues, but GPC3 expression levels in serum could be measured by a simple method. Whether serum-based GPC3 expression levels were more suitable to measurement than tissue-based levels remains unclear. Lastly, the follow-up periods in included studies were different.
5. Conclusion
Despite the limitations of the present study and heterogeneity across the included studies, the meta-analysis indicated that overexpression of GPC3 was significantly associated with poor prognosis in patients with HCC.
Author contributions
Conceptualization: xiaohui Ye.
Data curation: manka Zhang, xincheng Song.
Formal analysis: lingling He.
Investigation: jian zhang.
Supervision: xiaohui Ye.
Visualization: huimin Ma.
Writing – original draft: jian zhang.
Writing – review & editing: xin Li.
Footnotes
Abbreviations: GPC3 = glypican-3, CI = confidence interval, DFS = disease-free survival, HBV = hepatitis B virus, HCC = hepatocellular carcinoma, HCV = hepatitis C virus, HR = hazard ratio, IHC = immunohistochemistry, LT = liver transplantation, NA = not available, OR = odds ratio, OS = overall survival, SR = surgical resection.
Funding/support: Funding was provided by the National Major Scientific and Technological Project during the Twelfth 5-year Plan Period (No 2014ZX10005002–002) and Special Research Project of Traditional Chinese Medicine Industry (No 201507005).
The author reports no conflicts of interest in this work.
References
- [1].Mazzanti R, Gramantieri L, Bolondi L. Hepatocellular carcinoma: epidemiology and clinical aspects. Mol Aspects Med 2008;29:130–43. [DOI] [PubMed] [Google Scholar]
- [2].Sherman M. Hepatocellular carcinoma: epidemiology, surveillance, and diagnosis. Semin Liver Dis 2010;30:3–16. [DOI] [PubMed] [Google Scholar]
- [3].Tang Z-Y, Ye S-L, Liu Y-K, et al. A decade's studies on metastasis of hepatocellular carcinoma. J Cancer Res Clin Oncol 2004;130:187–96. [DOI] [PMC free article] [PubMed] [Google Scholar]
- [4].Avielronen S, Lau SK, Pintilie M, et al. Glypican-3 is overexpressed in lung squamous cell carcinoma, but not in adenocarcinoma. Mod Pathol 2008;21:817–25. [DOI] [PubMed] [Google Scholar]
- [5].Chen M, Li G, Yan J, et al. Reevaluation of glypican-3 as a serological marker for hepatocellular carcinoma. Clin Chim Acta 2013;423:105–11. [DOI] [PubMed] [Google Scholar]
- [6].Filmus J. The contribution of in vivo manipulation of gene expression to the understanding of the function of glypicans. Glycoconj J 2002;19:319–23. [DOI] [PubMed] [Google Scholar]
- [7].Filmus J, Capurro M, Rast J. Glypicans. Genome Biol 2008;9:224–1224. [DOI] [PMC free article] [PubMed] [Google Scholar]
- [8].Filmus J, Selleck SB. Glypicans: proteoglycans with a surprise. J Clin Invest 2001;108:497–501. [DOI] [PMC free article] [PubMed] [Google Scholar]
- [9].Thway K, Selfe J, Missiaglia E, et al. Glypican-3 is expressed in rhabdomyosarcomas but not adult spindle cell and pleomorphic sarcomas. J Clin Pathol 2011;64:587–91. [DOI] [PubMed] [Google Scholar]
- [10].Hsu HC, Cheng W, Lai PL. Cloning and expression of a developmentally regulated transcript MXR7 in hepatocellular carcinoma: biological significance and temporospatial distribution. Cancer Res 1997;57:5179–84. [PubMed] [Google Scholar]
- [11].Jakubovic BD, Jothy S. Glypican-3: from the mutations of Simpson-Golabi-Behmel genetic syndrome to a tumor marker for hepatocellular carcinoma. Exp Mol Pathol 2007;82:184–9. [DOI] [PubMed] [Google Scholar]
- [12].Kandil DH, Cooper K. Glypican-3: a novel diagnostic marker for hepatocellular carcinoma and more. Adv Anat Pathol 2009;16:125–9. [DOI] [PubMed] [Google Scholar]
- [13].Lage H, Dietel M. Cloning and characterization of human cDNAs encoding a protein with high homology to rat intestinal development protein OCI-5. Gene 1997;188:151–6. [DOI] [PubMed] [Google Scholar]
- [14].Capurro M, Wanless IR, Sherman M, et al. Glypican-3: a novel serum and histochemical marker for hepatocellular carcinoma. Gastroenterology 2003;125:89–97. [DOI] [PubMed] [Google Scholar]
- [15].Libbrecht L, Severi T, Cassiman D, et al. Glypican-3 expression distinguishes small hepatocellular carcinomas from cirrhosis, dysplastic nodules, and focal nodular hyperplasia-like nodules. Am J Surg Pathol 2006;30:1405–11. [DOI] [PubMed] [Google Scholar]
- [16].Wang HL, Anatelli F, Zhai QJ, et al. Glypican-3 as a useful diagnostic marker that distinguishes hepatocellular carcinoma from benign hepatocellular mass lesions. Arch Pathol Lab Med 2008;132:1723–8. [DOI] [PubMed] [Google Scholar]
- [17].Midorikawa Y, Ishikawa S, Iwanari H, et al. Glypican-3, overexpressed in hepatocellular carcinoma, modulates FGF2 and BMP-7 signaling. Int J Cancer 2003;103:455–65. [DOI] [PubMed] [Google Scholar]
- [18].Ning S, Bin C, Na H, et al. Glypican-3, a novel prognostic marker of hepatocellular cancer, is related with postoperative metastasis and recurrence in hepatocellular cancer patients. Mol Biol Rep 2012;39:351–7. [DOI] [PubMed] [Google Scholar]
- [19].Shirakawa H, Suzuki H, Shimomura M, et al. Glypican-3 expression is correlated with poor prognosis in hepatocellular carcinoma. Cancer Sci 2009;100:1403–7. [DOI] [PMC free article] [PubMed] [Google Scholar]
- [20].Yorita K, Takahashi N, Takai H, et al. Prognostic significance of circumferential cell surface immunoreactivity of glypican-3 in hepatocellular carcinoma. Liver Int 2011;31:120–31. [DOI] [PubMed] [Google Scholar]
- [21].Fu SJ, Qi CY, Xiao WK, et al. Glypican-3 is a potential prognostic biomarker for hepatocellular carcinoma after curative resection. Surgery 2013;154:536–44. [DOI] [PubMed] [Google Scholar]
- [22].Haruyama Y, Yorita K, Yamaguchi T, et al. High preoperative levels of serum glypican-3 containing N-terminal subunit are associated with poor prognosis in patients with hepatocellular carcinoma after partial hepatectomy. Int J Cancer 2015;137:1643–51. [DOI] [PubMed] [Google Scholar]
- [23].Li J, Gao JZ, Du JL, Wei LX. Prognostic and clinicopathological significance of glypican-3 overexpression in hepatocellular carcinoma: a meta-analysis. World J Gastroenterol 2014;20:6336–44. [DOI] [PMC free article] [PubMed] [Google Scholar]
- [24].Wang Y, Shen Z, Zhu Z, et al. Clinical values of AFP, GPC3 mRNA in peripheral blood for prediction of hepatocellular carcinoma recurrence following OLT: AFP, GPC3 mRNA for prediction of HCC. Hepat Mon 2011;11:195–9. [PMC free article] [PubMed] [Google Scholar]
- [25].Xiao WK, Qi CY, Chen D, et al. Prognostic significance of glypican-3 in hepatocellular carcinoma: a meta-analysis. BMC Cancer 2014;14:104. [DOI] [PMC free article] [PubMed] [Google Scholar]
- [26].Chen I, Ariizumi S, Nakano M, et al. Positive glypican-3 expression in early hepatocellular carcinoma predicts recurrence after hepatectomy. J Gastroenterol 2014;49:117–25. [DOI] [PMC free article] [PubMed] [Google Scholar]
- [27].Jeon Y, Kim H, Jang ES, et al. Expression profile and prognostic value of glypican-3 in post-operative South Korean hepatocellular carcinoma patients. APMIS 2016;124:208–15. [DOI] [PubMed] [Google Scholar]
- [28].Liang J, Ding T, Guo ZW, et al. Expression pattern of tumour-associated antigens in hepatocellular carcinoma: association with immune infiltration and disease progression. Br J Cancer 2013;109:1031–9. [DOI] [PMC free article] [PubMed] [Google Scholar]
- [29].Pan C, Wang X, Chen W, et al. Reevaluation of glypican-3 as a prognostic marker in HCC using X-tile software. Med Oncol 2015;32:359. [DOI] [PubMed] [Google Scholar]
- [30].Wang YL, Zhu ZJ, Teng DH, et al. Glypican-3 expression and its relationship with recurrence of HCC after liver transplantation. World J Gastroenterol 2012;18:2408–14. [DOI] [PMC free article] [PubMed] [Google Scholar]
- [31].Yu MC, Lee YS, Lin SE, et al. Recurrence and poor prognosis following resection of small hepatitis b-related hepatocellular carcinoma lesions are associated with aberrant tumor expression profiles of glypican 3 and osteopontin. Ann Surg Oncol 2012;19(suppl 3):S455–63. [DOI] [PubMed] [Google Scholar]
- [32].Tierney JF, Stewart LA, Ghersi D, et al. Practical methods for incorporating summary time-to-event data into meta-analysis. Trials 2007;8:16. [DOI] [PMC free article] [PubMed] [Google Scholar]
- [33].Xue R, Feng J, Meng Q, et al. The significance of glypican-3 expression profiling in the tumor cellular origin theoretical system for hepatocellular carcinoma progression. J Gastroenterol Hepatol 2017;32:1503–11. [DOI] [PubMed] [Google Scholar]
- [34].Kaseb AO, Hassan M, Lacin S, et al. Evaluating clinical and prognostic implications of Glypican-3 in hepatocellular carcinoma. Oncotarget 2016;7:69916–26. [DOI] [PMC free article] [PubMed] [Google Scholar]
- [35].Feng J, Zhu R, Chang C, et al. CK19 and glypican 3 expression profiling in the prognostic indication for patients with HCC after surgical resection. PLoS One 2016;11:e0151501. [DOI] [PMC free article] [PubMed] [Google Scholar]
- [36].Xiao YW, Degos F, Dubois S, et al. Glypican-3 expression in hepatocellular tumors: diagnostic value for preneoplastic lesions and hepatocellular carcinomas. Hum Pathol 2006;37:1435. [DOI] [PubMed] [Google Scholar]
- [37].Li C, Li Z, Zhu M, et al. Clinicopathological and prognostic significance of survivin over-expression in patients with esophageal squamous cell carcinoma: a meta-analysis. Plos One 2012;7:e44764. [DOI] [PMC free article] [PubMed] [Google Scholar]
- [38].Zhang CH, Xu GL, Jia WD, et al. Prognostic significance of osteopontin in hepatocellular carcinoma: a meta-analysis. Int J Cancer 2012;130:2685–92. [DOI] [PubMed] [Google Scholar]
- [39].Sun CK, Chua MS, He J, et al. Suppression of glypican 3 inhibits growth of hepatocellular carcinoma cells through up-regulation of TGF-β2. Neoplasia 2011;13:735–47. [DOI] [PMC free article] [PubMed] [Google Scholar]
- [40].Ruan J, Liu F, Chen X, et al. Inhibition of glypican-3 expression via RNA interference influences the growth and invasive ability of the MHCC97-H human hepatocellular carcinoma cell line. Int J Mol Med 2011;28:497–503. [DOI] [PubMed] [Google Scholar]