

Abstract
Systematic experimental approaches have led to construction of comprehensive genetic and protein-protein interaction networks for the budding yeast, Saccharomyces cerevisiae. Genetic interactions capture functional relationships between genes using phenotypic readouts, while protein-protein interactions identify physical connections between gene products. These complementary, and largely non-overlapping, networks provide a global view of the functional architecture of a cell, revealing general organizing principles, many of which appear to be evolutionarily conserved. Here, we focus on insights derived from the integration of large-scale genetic and protein-protein interaction networks, highlighting principles that apply to both unicellular and more complex systems, including human cells. Network integration reveals fundamental connections involving key functional modules of eukaryotic cells, defining a core network of cellular function, which could be elaborated to explore cell-type specificity in metazoans.
Mapping the global yeast genetic interaction network
Genetic interactions (GIs) appear to be important for understanding the relationship between genotype and phenotype. Although technological advances have enabled large-scale, whole genome sequencing, our ability to use this growing wealth of data to predict most inherited phenotypes, remains limited. Several explanations for this underlying “missing heritability” have been proposed, and evidence suggests that a failure to account for epistasis or GIs may be a significant component [1,2]. Originally, the term epistasis was coined to describe how the presence of a mutation can mask the effects of an allele at another locus. The term subsequently evolved to include GIs, in which a combination of two or more mutations yields an unexpected phenotype. In particular, GI analysis has been used productively in model system biology to provide a functional context for interpretation of biochemical experiments (reviewed in[3]).
The approach to exploration of GI networks in a particular model system depends on the ease of genetic manipulation, availability of mutant collections in a defined genetic background, and the ability to assay a phenotype in a systematic and scalable manner. GIs have been explored experimentally in several model microbial systems, including the budding yeast Saccharomyces cerevisiae (ref), Escherichia coli [4,5] and the fission yeast Schizosaccharomyces pombe [6,7], as well as in the Caenorhabditis elegans metazoan model system [8,9], cultured Drosophila melanogaster [10] and human cell lines [11–15]. However, the most extensive genetic network mapping experiments have used the S. cerevisiae model system, which has numerous large-scale collections of gene-specific mutants as well as high-throughput genetic methodologies that enable systematic exploration of GIs (reviewed in [16]). Indeed, a global yeast network provides a general view of the vast extent to which complex GIs can influence phenotypes and the relationship between genotype and phenotype (Fig. 1)[17,18].
Figure 1. Global yeast genetic interaction profiles similarity network.
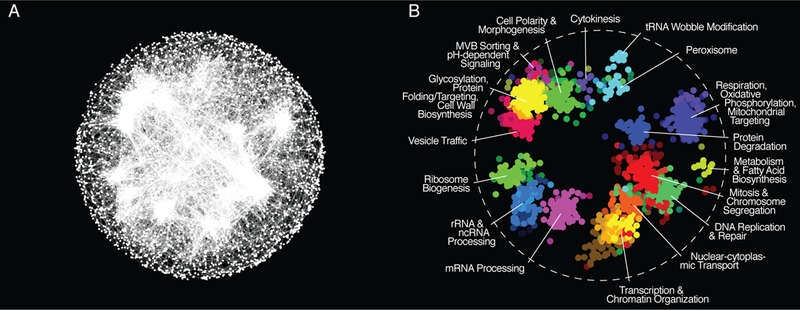
(A) A global genetic profile similarity network encompassing all nonessential and essential genes was constructed by computing Pearson correlation coefficients (PCCs) for genetic interaction profiles of all pairs of genes (nodes). Gene pairs whose profile similarity exceeded a PCC > 0.2 were connected and graphed using a spring-embedded layout algorithm. Genes sharing similar genetic interactions profiles map proximal to each other, whereas genes with less similar genetic interaction profiles are positioned further apart. (B) Network regions enriched for specific GO biological process terms are colored. Adapted from [18].
A widely used method for assaying yeast GIs is Synthetic Genetic Array (SGA) analysis [19]. SGA automates yeast genetics and enables large-scale construction and selection of yeast double-mutant strains carrying precise mutations, including double-mutant combinations of deletion alleles involving nonessential genes or hypomorphic, or partially functional, alleles of essential genes. GIs are subsequently identified by measuring double mutant fitness from high-density arrays of yeast colonies [20], and quantitative analysis enables the discovery of both positive and negative GIs. Negative GIs correspond to synthetic lethal or sick interactions, where a double mutant shows a fitness defect greater than the expected multiplicative effect of the combined single mutant fitness phenotypes (Fig. 2A). Alternatively, positive GIs, which include masking or suppression interactions, are scored for double mutants that grow better than the expected model (Fig. 2A)(reviewed in [16]). Large-scale SGA analysis of the majority of all possible yeast gene pairs (~18 million) enabled the construction of the first comprehensive GI network for any organism, a global network consisting of nearly one million GIs (~550,000 negative and ~350,000 positive) [18,21].
Figure 2. Quantitative definition of a genetic interaction.
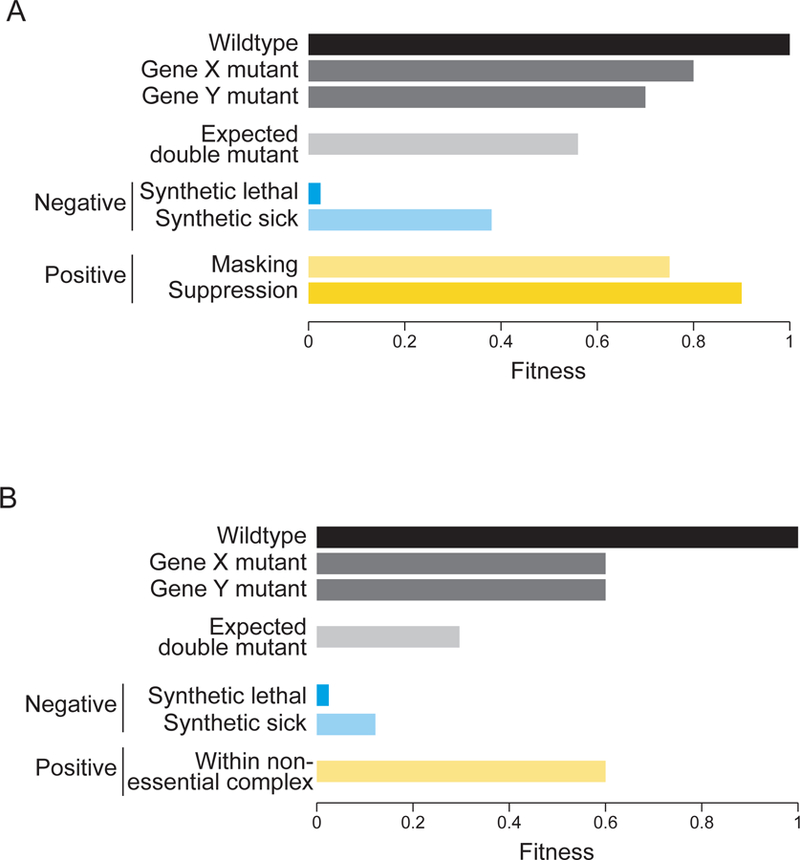
Under a multiplicative model, the expected fitness of a double mutant (relative to wild-type) is the product of the fitness of each single mutant. If the observe fitness of the double mutant falls below this expectation, genes X and Y share a negative GI (blue), while if double mutant fitness exceeds expectation, the interaction is positive GI (yellow). (A) Negative GIs include synthetic lethal or synthetic sick interactions. Positive GIs include masking or suppression GIs. (B) If the two single mutants (X and Y) exhibit the same defect in and the resultant double mutant shows the same fitness defect as the two single mutants, it is scored as a positive genetic interaction, which is often the case for nonessential genes in the same protein complex.
A global genetic profile similarity network defines a functional map of a yeast cell
The set of negative and positive GIs for a given gene, called a GI profile, provides a quantitative phenotypic signature that is indicative of gene function. Genes belonging to similar biological processes tend to share numerous GIs in common, and genes encoding proteins that function together in the same pathway or protein complex often display highly similar GI profiles. A comprehensive network of genes connected by edges reflecting the similarity of their GI profiles predicts gene function and serves as a powerful, unbiased data-driven resource for organizing genes into functional modules (Fig. 3) [17,18,22]. For example, at the most detailed level of network resolution, genes sharing many GIs in common are grouped together into relatively small, densely connected modules, which correspond to known protein complexes and biological pathways. At an intermediate level of network resolution, functionally-related pathway and protein complex modules are grouped together to highlight distinct biological processes. At the most general level of network resolution, bioprocess gene clusters group together into larger modules corresponding to specific cellular compartments. Thus, a global profile similarity network derived from fitness-based GIs can be used to infer protein-protein interactions (PPIs) and functional relationships between protein complexes to reveal a hierarchical model of yeast cell function (Fig. 3)[18].
Figure 3. A functional map of a yeast cell.
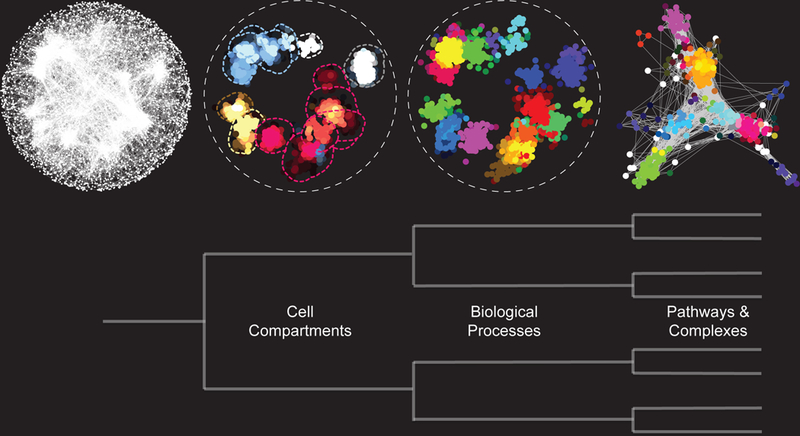
The global yeast genetic interaction profile similarity network, in which genes are linked closely to one another if they share a highly similar genetic interaction profile is organized as a hierarchy of functional modules, enriched for specific cellular compartments, biological processes or protein complexes.
General overlap between global genetic and physical interaction networks
The genetic accessibility of the budding yeast enables not only construction of arrays of yeast mutants, but also arrays of strains carrying tagged alleles, which allowed for systematic analysis of physical interactions, including protein-protein interactions (PPIs) [23–26] or protein-DNA interactions [27]. Because GIs capture the functional consequences of combining genetic perturbations, they are highly complementary to information derived from PPIs, which identify physical interactions among gene products. However, since the phenotypic consequence of a mutation is not constrained by physical connections, not only is the global GI network much larger than the global PPI network but the direct overlap between the two networks is modest. In fact, less than 0.4% of directly interacting pairs from the global GI network also show a corresponding PPI [17,18]. Nonetheless, as described below, examining the genetic networks connecting protein complexes and pathways has revealed fundamental, composite network principles and functional information that could not have been deduced from either network alone.
Gene essentiality impacts the relationship between genetic and physical interactions
Essential genes provide important insight into the relationship between GIs and PPIs [17,18,28]. The GIs for essential yeast genes were largely mapped using conditional, temperature-sensitive (TS) alleles, scoring double mutants for GIs at a semi-permissive temperature [17,18]. The essential gene GI network displays a number of unique features. For example, essential genes participate in ~5-fold more negative and positive GIs than nonessential genes, and GIs tend to occur most frequently between pairs of essential genes [18]. Thus, just as essential proteins are often hubs in PPI networks [29], essential genes tend to be hubs in the GI network [18]. Importantly, since essential genes are more conserved than non-essential genes [30], and participate in a large fraction of the interactions on the global yeast genetic network, they may define a GI network that is generally conserved.
Negative GIs involving essential genes often occur among genes within a specific protein complex or pathway (Fig. 4)[18]. In fact, ~50% (~10-fold enrichment) of essential gene pairs that encode physically interacting proteins are connected by a negative GI (Fig. 4A). In contrast, only ~5% (~2-fold enrichment) of nonessential gene pairs whose products physically interact also show a negative GI (Fig. 4A) [18]. This enrichment for negative GIs among essential gene pairs that overlap PPIs is even more striking when only interactions between genes encoding proteins within the same essential protein complex are considered (Fig. 4B). In fact, ~80% of essential protein complexes are enriched for negative GIs among their members [18]. This remarkable relationship suggests that PPIs encoded by essential gene pairs and essential protein complex membership in yeast should be highly predictive of GIs among orthologous genes in other cells.
Figure 4. Relationship between GIs and protein complexes.
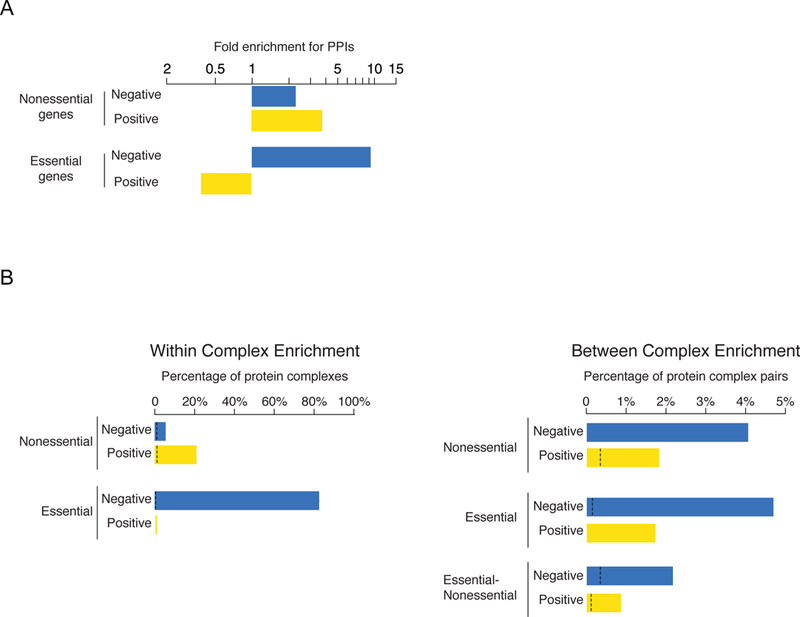
(A) Fold enrichment for physically interacting proteins (PPIs) among negative (blue) and positive (yellow) GIs connecting pairs of nonessential or essential genes. (B) (Left panel) The percentage of nonessential and essential complexes enriched for GIs within a complex. GIs are biased towards negative (blue) or positive (yellow) interactions. Black dashed lines indicate the background rate of coherent genetic interaction enrichment within individual complexes or between pairs of complexes. (Center panel). GI enrichment evaluated on complex-complex pairs. (Right panel) Schematic summary of GIs occurring within and between essential and nonessential protein complexes. Adapted from [18].
Unlike negative GIs, positive GIs associated with yeast essential gene pairs appear to capture more general regulatory relationships related to cell cycle progression, or mRNA and protein turnover [18]. For example, TS alleles, which may lower protein levels or reduce protein activity, often show positive GIs with genes involved in protein degradation [18]. In addition, so-called DAmP alleles of essential genes, which contain an insertion in 3’UTR regions that can lower mRNA levels [31], tend to share many of their positive GIs with genes involved in mRNA turnover. Moreover, a recent comprehensive study of the yeast chaperone system found a significant bias toward positive GIs between essential genes and a specific subset of chaperone genes [32]. These more general regulatory connections translate to relatively few overlapping connections between PPIs and the positive GIs among essential gene pairs (Fig. 4).
However, while a positive GI involving essential genes does not typically overlap with a PPI (Fig. 4) [18], a relatively small subclass of the strongest positive GIs, known as genetic suppression interactions, are enriched for genes encoding interacting proteins. Genetic suppression occurs when the phenotype associated with one mutation is rescued by mutation of a second gene (Fig. 2A). Importantly, these specific suppression interactions often involve precise alleles rather than relatively severe loss-of-function alleles, although these interactions can happen and represent a few of the extreme SGA positive interactions. Systematic analysis of suppressors of yeast fitness defects identified a subset of strong positive genetic suppressor interactions that was highly enriched for genes encoding proteins in the same pathway or complex [33]. In fact, apparent causal suppressive mutations occurred at a PPI interface nearly half the time [33].
Unlike essential gene pairs, nonessential gene pairs whose products exhibit a PPI often exhibit a positive GI (Figs. 4–5)[18]. However, the underpinnings of this relationship are quite distinct - the enrichment of PPIs among non-essential gene pairs that have a positive GI reflects the fact that deleting a gene within a nonessential complex usually leads to a null phenotype for that complex. As a result, a double mutant that is deleted for two genes within the same complex fails to show a more exaggerated phenotype than the corresponding single mutants and is scored as a positive GI under the multiplicative model (Fig. 2B)[16]. Notably, while PPIs between nonessential proteins are significantly enriched for overlap with positive GIs, these account for only a small fraction of all positive GIs in the nonessential gene network [17,18].
Figure 5. Within- and Between-Pathway Models of GIs.
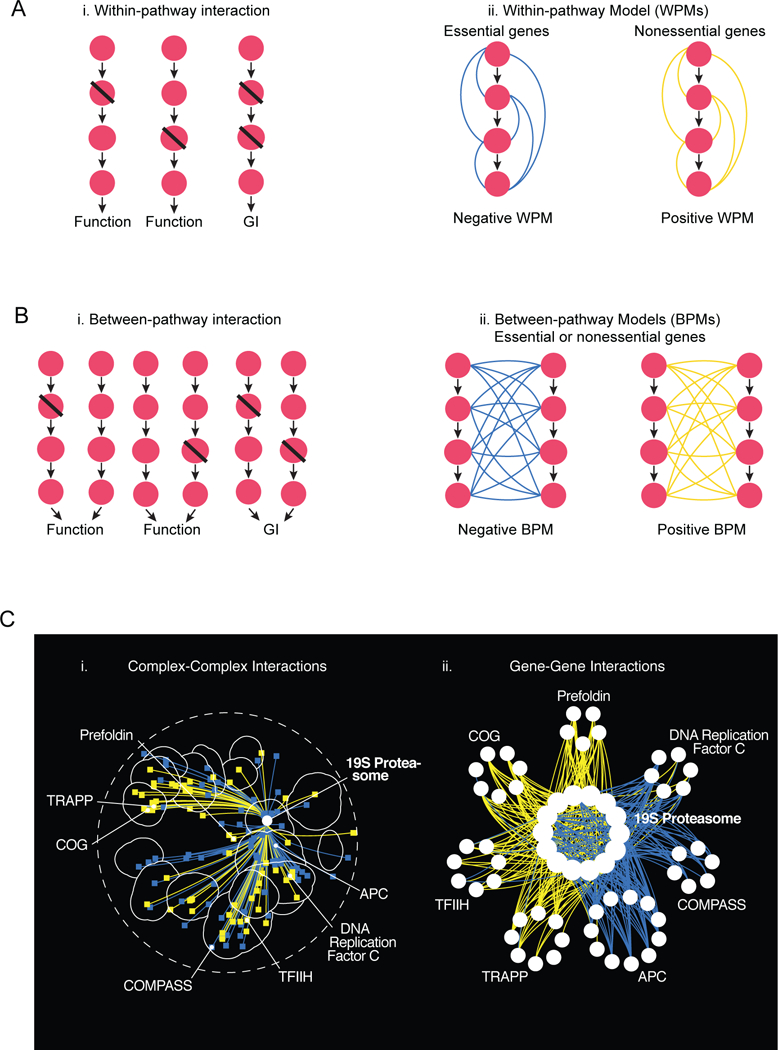
(A) Within-pathway model (WPM). (i) A single mutation in a pathway (or complex) does not result in an extensive phenotype, but simultaneous mutation of two genes within the same pathway results in an extreme GI. Perturbation of any pair of genes within the same pathway results in e similar GI phenotype. (ii) Negative WPMs identify genes that belong to same essential pathway or complex while positive WPMs often identify nonessential pathways or complexes. (B) Between-pathway model (BPM). (i) Two biological pathways (or protein complexes) impinge on the same cellular function. Mutations in individual pathways do not result in a phenotype, but mutations in both pathways result in a GI. (ii) Any combination of mutations in both pathways will result in the same type of GI, either negative or positive. (C) Coherent WPM and BPM genetic interactions involving the 19S proteasome. (i) Protein complexes that show coherent negative or positive WPM or BPM GIs with the 19S proteasome are placed on a schematic representation of the global GI profile similarity network based on the average genetic interaction profile similarity of the complex and connected with negative (blue) or positive (yellow) edges, respectively. (ii) Genes belonging to a subset of protein complexes that showed coherent negative (blue) or positive (yellow) GIs with genes encoding the 19S proteasome. Adapted from [18].
Genetic interactions occur within and between functional modules
GIs are often organized by into clear coherent subsets of interactions, either all positive or all negative, that connect gene pairs within functional units. In particular, genes encoding proteins within the same complex tend to be connected to one another by a single type of GI, positive or negative, forming a network structure referred to as a “within pathway” model or module (WPM) (Fig. 5A)[18]. Alternatively, genes within the same pathway or complex can also be connected to genes belonging to another complex or pathway by a single type of GI, positive or negative, a network structure referred to as a “between pathway” model or module (BPM) (Fig. 5B). These general observations validate theoretical studies predicting that GIs within the same functional module or biological process would commonly be connected by coherent subsets of GIs, a network property termed “monochromaticity” [34]. Indeed, within the global yeast genetic network, genes encoding hundreds of different pairs of protein complexes are connected by coherent sets of negative or positive GIs organized into WPMs and BPMs [18]. Similar to the relationship observed with protein complexes, the type of genetic interactions that comprise a WPM depends, in part, on whether genes in the functional module are essential or nonessential [17,18,20,28]. Indeed, members of a WPM comprised of mostly essential genes tend to be connected by negative GIs, emphasizing a cell’s inability to tolerate multiple perturbations in the same essential functional module [17,18]. Importantly, because the structure and essentiality of fundamental functional modules (e.g. the proteasome) is highly conserved, WPM negative GIs will often be conserved from yeast to human cells [35].
A network comprised of both negative and positive BPMs maps a highly organized functional wiring diagram of a cell or organism. A BPM connected by negative GIs identifies pairs of modules that are functionally connected and impinge on a common essential cellular role. A BPM connected by positive GIs often identifies sets of masking or suppressor interactions, in which mutations in genes in one module bypass the growth defect associated with mutations in genes in another module [18,33]. BPMs are observed among functional modules that can be composed of both essential and nonessential genes, and a global network of BPMs maps biologically relevant functional connections between these units. From an integrated network perspective, the BPM structure identifies GIs that do not overlap with PPIs, which encompass the vast majority of GIs on the global yeast genetic network (Fig. 5).
The WPMs and BPMs associated with the 19S proteasome provide clear examples. Genes encoding the 19S proteasome components are essential and connected to each other by a coherent set of WPM negative GIs. Moreover, the 19S proteasome genes are connected through BPM negative GIs to the APC (anaphase promoting complex), and through BPM positive GIs with the COG (conserved oligomeric Golgi) complex genes (Fig. 5C)[18]. Across the global yeast genetic network, one study estimated that as many as ~70% of negative GIs occur as WPMs or BPMs, suggesting that this type of local clustering of GIs is the rule rather than the exception [36]. Another probabilistic approach that integrated PPI data assigned ~40% of negative interactions to WPM and BPM structures [37]. Taken together, these observations support the idea that PPIs capture specific biochemical relationships that define the physical architecture of functional modules, while GIs identify functional relationships between them [38].
Intriguingly, the general WPM and BPM genetic network structure may be relevant to the study of GIs underlying genotype to phenotype relationships in human population data, including genome-wide association studies. For example, the prevalence of GIs occurring in WPM or BPM structures can been used as prior knowledge to improve the statistical sensitivity of approaches for measuring potential GI maps from human population genetic data [39]. Thus, with the knowledge of pathways and complexes in human cells, often largely defined as PPIs and other biochemical connections, it may be possible to trace natural genetic variation bridging subsets of genes, corresponding to a specific WPMs or BPMs, to disease risk or protection.
The conserved relationships between genetic and physical interactions
Comparative analyses have uncovered some GIs that are conserved from yeast to higher organisms [6,7,9,35], typically in highly conserved WPM or BPM structures, such as those associated with DNA replication and chromosome integrity [40,41]. However, the global extent of this conservation of individual GIs remains unclear, and phenotypes assayed for interactions in higher organisms may not be directly comparable to those used in single-celled organisms and in cell culture systems.
However, both computational and experimental studies have revealed that the general properties of GIs are conserved at the level of network structure and topology. For example, several physiological and evolutionary properties associated with gene connectivity in the global budding yeast genetic network were predictive of GIs in the fission yeast genetic network [42]. Extensive mapping of GIs in S pombe revealed that GIs found in WPMs and BPMs are more highly conserved from budding to fission yeast [43,44]. Similarly, a comparison of functional networks derived from S. cerevisiae, S. pombe, C. elegans and D. melanogaster demonstrated that conservation of biological interactions detected between species is more significant at the level of WPMs and BPMs, as compared to conservation at the level of individual genes or proteins [45].
The ability to predict functional relationships and protein complex membership based on GI profile similarity also appears to be a general feature of genetic networks. For example, GI analysis involving ~1,400 Drosophila genes spanning core cellular processes such as transcription, translation, protein degradation and cell cycle control showed that GI profile similarity between gene pairs encoding physically products was higher than between gene pairs encoding non-interacting proteins [10]. Another study examined GIs between ~80 human genes implicated in ricin resistance and found that, similar to studies in yeast, GI profiles were predictive of PPIs [12]. Finally, genes within the same module corresponding to a stimulated cell communication pathway appear to share more similar GI profiles than genes belonging to different modules [46]; however, more systematic comparisons with physical interactions requires more complete PPI data.
Integrating genetic and protein-protein interaction networks in human cells
Recent technological developments, including transposon-mutagenesis combined with human haploid cell lines [47] and CRISPR (clustered regularly interspaced short palindromic repeats)-based gene editing methods [48], have enabled large-scale, systematic GI studies in a number of different organisms and human cell model systems, which could only have been imagined a few years ago. At the level of a single genetic perturbation, genome-wide, loss-of-function genetic screens have defined both a “core” set of ~1500 genes that are each essential for viability across all human cell lines tested as well as genes specifically required for viability in only a few cancer cell lines [11,49–53]. These “context-specific” essential genes may result from negative GIs that illuminate cancer cell line-specific dependencies on certain functional modules, signaling pathways or biological processes. Thus, due to cell line-specific GIs, genes belonging to the same pathway may show similar patterns of essentiality in the same subset of cell lines [49,50,53]. For example, comparison of gene essentiality profiles showed that three genes, NFE2L1, NGLY1 and DDI2, were required for viability of the same set of cancer cell lines, suggesting that these genes share similar genetic interactions and may work together as part of the same functional module [52]. Similarly, studies in C. elegans showed that NGLY1, NRF1 and DDI2 work together as part of a proteasome recovery response (PRR) pathway that functions to transcriptionally upregulate the bounce-back response of genes encoding proteasome components in response to proteotoxic stress [54].
More recently, strategies for CRISPR-based combinatorial loss-of-function screens have also been developed to facilitate GI analysis in human cells by targeting pairs of genes simultaneously. While genome-scale application remains technically challenging, most analyses to date have focused on relatively small subsets of genes to: [1] identify GIs among panels of cancer genes revealing potential targets for synthetic lethal-based cancer therapy [13,15]; [2] explore genes encoding known drug targets to identify opportunities for combinatorial therapies [12] and; [3] chromatin regulatory factors, which provided preliminary evidence to suggest that, similar to yeast, human protein complexes also appear to be connected by coherent sets of either negative or positive interactions [14].
Genome-scale CRISPR-Cas9-based GI mapping strategies will ultimately enable the integration of comprehensive GI and PPI networks in human cells. While there are many different human cell types, and their specific biology will undoubtedly lead to cell-type specific GIs, we anticipate that an extensive core GI network will be common to all cell types, just as there appears to be a common set of core essential genes [11,49–51]. Thus, at the GI network level, cell-type specificity could be viewed as an elaboration of a core genetic network. The comprehensive mapping of the core GI network and the integration of this information with large-scale proteomic [55,56] and other biologically relevant networks [57,58] should reveal the most basic functional wiring diagram of a human cell, organizing the fundamental connections among key functional modules, which could be further expanded upon for a detailed analysis of cell-type specificity.
Acknowledgements
Work in the Andrews, Boone and Myers labs is supported by the National Institutes of Health [grant numbers R01HG005853 to C.B., B.J.A., and C.L.M. and R01HG005084 to C.L.M.]; the Canadian Institutes of Health Research (grant numbers FDN-143264 to B.J.A. and FDN-143265 to C.B.); the National Science Foundation (grant number DBI\0953881 to C.L.M.). C.L.M, B.J.A., and C.B. are fellows of the Canadian Institute for Advanced Research.
References
- 1.Zuk O, Hechter E, Sunyaev SR, Lander ES: The mystery of missing heritability: Genetic interactions create phantom heritability. Proc Natl Acad Sci U S A 2012, 109:1193–1198. [DOI] [PMC free article] [PubMed] [Google Scholar]
- 2.Forsberg SK, Bloom JS, Sadhu MJ, Kruglyak L, Carlborg O: Accounting for genetic interactions improves modeling of individual quantitative trait phenotypes in yeast. Nat Genet 2017, 49:497–503.*This study shows that genetic interactions contribute to many quantitative traits in yeast.
- 3.Baryshnikova A, Costanzo M, Myers CL, Andrews B, Boone C: Genetic interaction networks: toward an understanding of heritability. Annu Rev Genomics Hum Genet 2013, 14:111–133. [DOI] [PubMed] [Google Scholar]
- 4.Typas A, Nichols RJ, Siegele DA, Shales M, Collins SR, Lim B, Braberg H, Yamamoto N, Takeuchi R, Wanner BL, et al. : High-throughput, quantitative analyses of genetic interactions in E. coli. Nat Methods 2008, 5:781–787. [DOI] [PMC free article] [PubMed] [Google Scholar]
- 5.Butland G, Babu M, Diaz-Mejia JJ, Bohdana F, Phanse S, Gold B, Yang W, Li J, Gagarinova AG, Pogoutse O, et al. : eSGA: E. coli synthetic genetic array analysis. Nat Methods 2008, 5:789–795. [DOI] [PubMed] [Google Scholar]
- 6.Roguev A, Bandyopadhyay S, Zofall M, Zhang K, Fischer T, Collins SR, Qu H, Shales M, Park HO, Hayles J, et al. : Conservation and rewiring of functional modules revealed by an epistasis map in fission yeast. Science 2008, 322:405–410. [DOI] [PMC free article] [PubMed] [Google Scholar]
- 7.Dixon SJ, Fedyshyn Y, Koh JL, Prasad TS, Chahwan C, Chua G, Toufighi K, Baryshnikova A, Hayles J, Hoe KL, et al. : Significant conservation of synthetic lethal genetic interaction networks between distantly related eukaryotes. Proc Natl Acad Sci U S A 2008, 105:16653–16658. [DOI] [PMC free article] [PubMed] [Google Scholar]
- 8.Lehner B, Crombie C, Tischler J, Fortunato A, Fraser AG: Systematic mapping of genetic interactions in Caenorhabditis elegans identifies common modifiers of diverse signaling pathways. Nat Genet 2006, 38:896–903. [DOI] [PubMed] [Google Scholar]
- 9.Byrne AB, Weirauch MT, Wong V, Koeva M, Dixon SJ, Stuart JM, Roy PJ: A global analysis of genetic interactions in Caenorhabditis elegans. J Biol 2007, 6:8. [DOI] [PMC free article] [PubMed] [Google Scholar]
- 10.Fischer B, Sandmann T, Horn T, Billmann M, Chaudhary V, Huber W, Boutros M: A map of directional genetic interactions in a metazoan cell. Elife 2015, 4. [DOI] [PMC free article] [PubMed] [Google Scholar]
- 11.Blomen VA, Majek P, Jae LT, Bigenzahn JW, Nieuwenhuis J, Staring J, Sacco R, van Diemen FR, Olk N, Stukalov A, et al. : Gene essentiality and synthetic lethality in haploid human cells. Science 2015, 350:1092–1096. [DOI] [PubMed] [Google Scholar]
- 12.Han K, Jeng EE, Hess GT, Morgens DW, Li A, Bassik MC: Synergistic drug combinations for cancer identified in a CRISPR screen for pairwise genetic interactions. Nat Biotechnol 2017, 35:463–474. [DOI] [PMC free article] [PubMed] [Google Scholar]
- 13.Shen JP, Zhao D, Sasik R, Luebeck J, Birmingham A, Bojorquez-Gomez A, Licon K, Klepper K, Pekin D, Beckett AN, et al. : Combinatorial CRISPR-Cas9 screens for de novo mapping of genetic interactions. Nat Methods 2017, 14:573–576. [DOI] [PMC free article] [PubMed] [Google Scholar]
- 14.Du D, Roguev A, Gordon DE, Chen M, Chen SH, Shales M, Shen JP, Ideker T, Mali P, Qi LS, et al. : Genetic interaction mapping in mammalian cells using CRISPR interference. Nat Methods 2017, 14:577–580. [DOI] [PMC free article] [PubMed] [Google Scholar]
- 15.Najm FJ, Strand C, Donovan KF, Hegde M, Sanson KR, Vaimberg EW, Sullender ME, Hartenian E, Kalani Z, Fusi N, et al. : Orthologous CRISPR-Cas9 enzymes for combinatorial genetic screens. Nat Biotechnol 2018, 36:179–189. [DOI] [PMC free article] [PubMed] [Google Scholar]
- 16.Costanzo M, Baryshnikova A, Myers CL, Andrews B, Boone C: Charting the genetic interaction map of a cell. Current Opinion in Biotechnology 2011, 22:66–74. [DOI] [PubMed] [Google Scholar]
- 17.Costanzo M, Baryshnikova A, Bellay J, Kim Y, Spear ED, Sevier CS, Ding H, Koh JL, Toufighi K, Mostafavi S, et al. : The genetic landscape of a cell. Science 2010, 327:425–431. [DOI] [PMC free article] [PubMed] [Google Scholar]
- 18.Costanzo M, VanderSluis B, Koch EN, Baryshnikova A, Pons C, Tan G, Wang W, Usaj M, Hanchard J, Lee SD, et al. : A global genetic interaction network maps a wiring diagram of cellular function. Science 2016, 353.**This study describes the first comprehensive genome-scale genetic interaction network for a eukaryotic cell.
- 19.Tong AH, Evangelista M, Parsons AB, Xu H, Bader GD, Page N, Robinson M, Raghibizadeh S, Hogue CW, Bussey H, et al. : Systematic genetic analysis with ordered arrays of yeast deletion mutants. Science 2001, 294:2364–2368. [DOI] [PubMed] [Google Scholar]
- 20.Baryshnikova A, Costanzo M, Kim Y, Ding H, Koh J, Toufighi K, Youn JY, Ou J, San Luis BJ, Bandyopadhyay S, et al. : Quantitative analysis of fitness and genetic interactions in yeast on a genome scale. Nat Methods 2010, 7:1017–1024. [DOI] [PMC free article] [PubMed] [Google Scholar]
- 21.Kuzmin E, VanderSluis B, Wang W, Tan G, Deshpande R, Chen Y, Usaj M, Balint A, Mattiazzi Usaj M, van Leeuwen J, et al. : Systematic analysis of complex genetic interactions. Science 2018, 360. [DOI] [PMC free article] [PubMed] [Google Scholar]
- 22.Ma J, Yu MK, Fong S, Ono K, Sage E, Demchak B, Sharan R, Ideker T: Using deep learning to model the hierarchical structure and function of a cell. Nat Methods 2018. [DOI] [PMC free article] [PubMed]
- 23.Gavin AC, Aloy P, Grandi P, Krause R, Boesche M, Marzioch M, Rau C, Jensen LJ, Bastuck S, Dumpelfeld B, et al. : Proteome survey reveals modularity of the yeast cell machinery. Nature 2006, 440:631–636. [DOI] [PubMed] [Google Scholar]
- 24.Krogan NJ, Cagney G, Yu H, Zhong G, Guo X, Ignatchenko A, Li J, Pu S, Datta N, Tikuisis AP, et al. : Global landscape of protein complexes in the yeast Saccharomyces cerevisiae. Nature 2006, 440:637–643. [DOI] [PubMed] [Google Scholar]
- 25.Yu H, Braun P, Yildirim MA, Lemmens I, Venkatesan K, Sahalie J, Hirozane-Kishikawa T, Gebreab F, Li N, Simonis N, et al. : High-quality binary protein interaction map of the yeast interactome network. Science 2008, 322:104–110. [DOI] [PMC free article] [PubMed] [Google Scholar]
- 26.Yofe I, Weill U, Meurer M, Chuartzman S, Zalckvar E, Goldman O, Ben-Dor S, Schutze C, Wiedemann N, Knop M, et al. : One library to make them all: streamlining the creation of yeast libraries via a SWAp-Tag strategy. Nat Methods 2016, 13:371–378.*This paper describes a method for efficient creation of arrays of tagged yeast strains for systematic functional genomics analysis.
- 27.Rhee HS, Pugh BF: Comprehensive genome-wide protein-DNA interactions detected at single-nucleotide resolution. Cell 2011, 147:1408–1419. [DOI] [PMC free article] [PubMed] [Google Scholar]
- 28.Bandyopadhyay S, Kelley R, Krogan NJ, Ideker T: Functional maps of protein complexes from quantitative genetic interaction data. PLoS Comput Biol 2008, 4:e1000065. [DOI] [PMC free article] [PubMed] [Google Scholar]
- 29.Hahn MW, Kern AD: Comparative genomics of centrality and essentiality in three eukaryotic protein-interaction networks. Mol Biol Evol 2005, 22:803–806. [DOI] [PubMed] [Google Scholar]
- 30.Hirsh AE, Fraser HB: Protein dispensability and rate of evolution. Nature 2001, 411:1046–1049. [DOI] [PubMed] [Google Scholar]
- 31.Schuldiner M, Collins SR, Thompson NJ, Denic V, Bhamidipati A, Punna T, Ihmels J, Andrews B, Boone C, Greenblatt JF, et al. : Exploration of the function and organization of the yeast early secretory pathway through an epistatic miniarray profile. Cell 2005, 123:507–519. [DOI] [PubMed] [Google Scholar]
- 32.Rizzolo K, Huen J, Kumar A, Phanse S, Vlasblom J, Kakihara Y, Zeineddine HA, Minic Z, Snider J, Wang W, et al. : Features of the Chaperone Cellular Network Revealed through Systematic Interaction Mapping. Cell Rep 2017, 20:2735–2748.*Mapping of genetic interactions involving yeast chaperones supports a significant role for chaperones as hubs on the genetic interaction network
- 33.van Leeuwen J, Pons C, Mellor JC, Yamaguchi TN, Friesen H, Koschwanez J, Usaj MM, Pechlaner M, Takar M, Usaj M, et al. : Exploring genetic suppression interactions on a global scale. Science 2016, 354.**This study maps global genetic suppression networks in yeast, using both experimental and literature curation approaches.
- 34.Segre D, Deluna A, Church GM, Kishony R: Modular epistasis in yeast metabolism. Nat Genet 2005, 37:77–83. [DOI] [PubMed] [Google Scholar]
- 35.Deshpande R, Asiedu MK, Klebig M, Sutor S, Kuzmin E, Nelson J, Piotrowski J, Ho Shin S, Yoshida M, Costanzo M, et al. : A comparative genomic approach for identifying synthetic lethal interactions in human cancer. Cancer research 2013, 73:6128–6136. [DOI] [PMC free article] [PubMed] [Google Scholar]
- 36.Bellay J, Atluri G, Sing TL, Toufighi K, Costanzo M, Ribeiro PS, Pandey G, Baller J, VanderSluis B, Michaut M, et al. : Putting genetic interactions in context through a global modular decomposition. Genome Research 2011, 21:1375–1387. [DOI] [PMC free article] [PubMed] [Google Scholar]
- 37.Kelley R, Ideker T: Systematic interpretation of genetic interactions using protein networks. Nat Biotechnol 2005, 23:561–566. [DOI] [PMC free article] [PubMed] [Google Scholar]
- 38.Boucher B, Lee AY, Hallett M, Jenna S: Structural and Functional Characterization of a Caenorhabditis elegans Genetic Interaction Network within Pathways. PLoS Comput Biol 2016, 12:e1004738. [DOI] [PMC free article] [PubMed] [Google Scholar]
- 39.Wang W, Xu ZZ, Costanzo M, Boone C, Lange CA, Myers CL: Pathway-based discovery of genetic interactions in breast cancer. PLoS Genet 2017, 13:e1006973. [DOI] [PMC free article] [PubMed] [Google Scholar]
- 40.van Pel DM, Barrett IJ, Shimizu Y, Sajesh BV, Guppy BJ, Pfeifer T, McManus KJ, Hieter P: An evolutionarily conserved synthetic lethal interaction network identifies FEN1 as a broad-spectrum target for anticancer therapeutic development. PLoS Genet 2013, 9:e1003254. [DOI] [PMC free article] [PubMed] [Google Scholar]
- 41.Tarailo M, Tarailo S, Rose AM: Synthetic lethal interactions identify phenotypic “interologs” of the spindle assembly checkpoint components. Genetics 2007, 177:2525–2530. [DOI] [PMC free article] [PubMed] [Google Scholar]
- 42.Koch EN, Costanzo M, Bellay J, Deshpande R, Chatfield-Reed K, Chua G, D’Urso G, Andrews BJ, Boone C, Myers CL: Conserved rules govern genetic interaction degree across species. Genome biology 2012, 13:R57. [DOI] [PMC free article] [PubMed] [Google Scholar]
- 43.Ryan CJ, Roguev A, Patrick K, Xu J, Jahari H, Tong Z, Beltrao P, Shales M, Qu H, Collins SR, et al. : Hierarchical modularity and the evolution of genetic interactomes across species. Molecular cell 2012, 46:691–704. [DOI] [PMC free article] [PubMed] [Google Scholar]
- 44.Frost A, Elgort MG, Brandman O, Ives C, Collins SR, Miller-Vedam L, Weibezahn J, Hein MY, Poser I, Mann M, et al. : Functional repurposing revealed by comparing S. pombe and S. cerevisiae genetic interactions. Cell 2012, 149:1339–1352. [DOI] [PMC free article] [PubMed] [Google Scholar]
- 45.Zinman GE, Zhong S, Bar-Joseph Z: Biological interaction networks are conserved at the module level. BMC systems biology 2011, 5:134. [DOI] [PMC free article] [PubMed] [Google Scholar]
- 46.Billmann M, Chaudhary V, ElMaghraby MF, Fischer B, Boutros M: Widespread Rewiring of Genetic Networks upon Cancer Signaling Pathway Activation. Cell Syst 2018, 6:52–64 e54. [DOI] [PMC free article] [PubMed] [Google Scholar]
- 47.Burckstummer T, Banning C, Hainzl P, Schobesberger R, Kerzendorfer C, Pauler FM, Chen D, Them N, Schischlik F, Rebsamen M, et al. : A reversible gene trap collection empowers haploid genetics in human cells. Nat Methods 2013, 10:965–971. [DOI] [PMC free article] [PubMed] [Google Scholar]
- 48.Cong L, Ran FA, Cox D, Lin S, Barretto R, Habib N, Hsu PD, Wu X, Jiang W, Marraffini LA, et al. : Multiplex genome engineering using CRISPR/Cas systems. Science 2013, 339:819–823. [DOI] [PMC free article] [PubMed] [Google Scholar]
- 49.Hart T, Chandrashekhar M, Aregger M, Steinhart Z, Brown KR, MacLeod G, Mis M, Zimmermann M, Fradet-Turcotte A, Sun S, et al. : High-Resolution CRISPR Screens Reveal Fitness Genes and Genotype-Specific Cancer Liabilities. Cell 2015, 163:1515–1526. [DOI] [PubMed] [Google Scholar]
- 50.Wang T, Wei JJ, Sabatini DM, Lander ES: Genetic Screens in Human Cells Using the CRISPR/Cas9 System. Science 2013. [DOI] [PMC free article] [PubMed]
- 51.Bertomeu T, Coulombe-Huntington J, Chatr-Aryamontri A, Bourdages KG, Coyaud E, Raught B, Xia Y, Tyers M: A High-Resolution Genome-Wide CRISPR/Cas9 Viability Screen Reveals Structural Features and Contextual Diversity of the Human Cell-Essential Proteome. Mol Cell Biol 2018, 38. [DOI] [PMC free article] [PubMed] [Google Scholar]
- 52.Wang T, Yu H, Hughes NW, Liu B, Kendirli A, Klein K, Chen WW, Lander ES, Sabatini DM: Gene Essentiality Profiling Reveals Gene Networks and Synthetic Lethal Interactions with Oncogenic Ras. Cell 2017. [DOI] [PMC free article] [PubMed]
- 53.Tsherniak A, Vazquez F, Montgomery PG, Weir BA, Kryukov G, Cowley GS, Gill S, Harrington WF, Pantel S, Krill-Burger JM, et al. : Defining a Cancer Dependency Map. Cell 2017, 170:564–576 e516. [DOI] [PMC free article] [PubMed] [Google Scholar]
- 54.Lehrbach NJ, Ruvkun G: Proteasome dysfunction triggers activation of SKN-1A/Nrf1 by the aspartic protease DDI-1. Elife 2016, 5. [DOI] [PMC free article] [PubMed] [Google Scholar]
- 55.Huttlin EL, Bruckner RJ, Paulo JA, Cannon JR, Ting L, Baltier K, Colby G, Gebreab F, Gygi MP, Parzen H, et al. : Architecture of the human interactome defines protein communities and disease networks. Nature 2017, 545:505–509. [DOI] [PMC free article] [PubMed] [Google Scholar]
- 56.Rolland T, Tasan M, Charloteaux B, Pevzner SJ, Zhong Q, Sahni N, Yi S, Lemmens I, Fontanillo C, Mosca R, et al. : A proteome-scale map of the human interactome network. Cell 2014, 159:1212–1226. [DOI] [PMC free article] [PubMed] [Google Scholar]
- 57.Wong AK, Krishnan A, Troyanskaya OG: GIANT 2.0: genome-scale integrated analysis of gene networks in tissues. Nucleic Acids Res 2018. [DOI] [PMC free article] [PubMed]
- 58.Huang JK, Carlin DE, Yu MK, Zhang W, Kreisberg JF, Tamayo P, Ideker T: Systematic Evaluation of Molecular Networks for Discovery of Disease Genes. Cell Syst 2018, 6:484–495 e485. [DOI] [PMC free article] [PubMed] [Google Scholar]