

Abstract
A human brain has separate left and right cerebral cortices, each of which must be continuously structurally maintained during adulthood. There is no understanding of how ongoing structural maintenances of separate parts of a mature individual brain, including the 2 cortices, are related. To explore this issue, this study used an unconventional N-of-1 magnetic resonance imaging time-series paradigm to identify relationships between maintenances of structural thicknesses of the 2 cortices in an adult human brain over week intervals for 6 months. The results suggest that maintenances of left and right cortical thicknesses were symmetrically related in some, but asymmetrically related in other, respects. For matched times, thickness magnitudes and variations on the 2 sides were positively correlated and appeared to reflect maintenance symmetry. Maintenance relationships also extended from earlier to later times with temporal continuity and apparent “if-then” contingencies which were reflected in symmetry and asymmetry dynamics spanning 1- to 2-week periods. The findings suggest concepts of individual brain cortical maintenance symmetry, asymmetry, and temporal continuity dynamics that have not been previously recognized. They have implications for defining cortical maintenance traits or states and for development of N-of-1 precision medicine paradigms that can contribute to understanding individual brain health.
Keywords: Brain maintenance, cortical symmetry/asymmetry, cortical thickness, MRI N-of-1 time series, precision medicine
Introduction
A distinctive feature of the human nervous system is that upper levels of the brain are bilaterally separated into distinct left and right cerebral hemispheres. The 2 hemispheres, in turn, have structurally separate cerebral cortices, arranged as 2- to 4-mm-thick outside coverings.
Much is known about relationships in structural development of different parts of the developing human brain. In contrast, little is known about relationships in subsequent structural maintenances of different parts of the mature human brain, including the 2 cortices. The mature structures of the 2 cortices must be maintained from week-week across adulthood. Maintenance mechanisms are active continuously and ubiquitously across all locations of each cortex. This is apparent from the fact that ongoing maintenance requires a continuous flow of blood and accompanying glucose and oxygen, and that maintenance becomes disrupted and structural deterioration rapidly begins at any cortical location within minutes after interruption of blood flow. Under healthy adult conditions, continuously ongoing and separate maintenances ensure structural viabilities of the 2 cortices.
In considering cortical maintenance, a key question is: how are ongoing structural maintenances of the 2 cortices in an individual brain related? From indirect considerations, different relationships are possible. For example, left and right cortices normally continuously integrate mental and cognitive functions through commissural connections and serve as one unified brain. This bilateral integration could suggest that maintenances of the 2 cortical structures are mutually unified and, perhaps, symmetrically related. Alternatively, the brain has lateralized circulations which commonly differ across the 2 sides in terms of vascular structure and blood flow1–6; in addition, there is evidence for left vs right differences in cortical predispositions to a spectrum of neurodegenerative diseases.7 Given relationships between circulation and maintenance, and between disease and maintenance failure, these differences could suggest that ongoing structural maintenances of the 2 cortices are independent and, perhaps, asymmetric.
Study of concurrently ongoing maintenances of left and right cortical structures in an individual brain is needed to distinguish between the above possibilities. This has not been done, largely because direct assessment requires application of a resource intensive, N-of-1 longitudinal test paradigm, ie, a time-series paradigm employing analyses of regularly spaced, prospective left and right cortical structural measurements from a substantial sample of consecutive short time intervals in the same brain. Although challenging, increased interest in this type of paradigm is emerging from recent discussions of the need for precision medicine, N-of-1 approaches to explore basic concepts of brain and body health at an individual level.8–12
This study used magnetic resonance imaging (MRI) and an N-of-1 time series paradigm to define mean structural thicknesses of the 2 cortices in an adult man at week intervals over 6 months. A recent report explored whether cortical thickness in this individual’s brain was statically maintained. The results led to the hypothesis that ongoing maintenance was not static but, instead, involved reversing incremental and decremental fluctuations in thickness over week and multiweek periods.13 This study uses cortical thickness measures from this man to examine the further issue of how maintenances of the left and right cortical structures in an individual brain are related from week-week. Thickness was used as an index because it is a useful structural indicator of cortical health and disease.14–17 Hemispheric mean cortical thicknesses and their variations were used as measures because they were considered appropriate to analyze the spatially ubiquitous nature of ongoing maintenance across each cortical hemisphere.
The above question, as indicated, has received no previous study but we felt (1) its significance for understanding cortical maintenances in an individual brain and (2) the availability of the necessary but rare N-of-1 time series measures, justified an exploratory investigation. The results provide initial insights into dynamics of maintenance relationships of the 2 cortices in an individual brain that have not been previously recognized and that have interesting implications.
Materials and Methods
Studied individual
The subject was a 66-year-old man whose health history has been previously described.13 He was selected based on active willingness to undergo weekly MRI scanning and daily health monitoring for the 6-month study period and because he had a good health history. From longstanding direct knowledge about the individual and self-report, he has not used tobacco since 1980 or alcohol since 2000; prior to those times, he was a sporadic pipe smoker for several years during the 1970s and a minimal alcohol consumer. At no age has he used recreational or other drugs and has no early life experience of child abuse. He has been physically active across life (eg, regular bicycling, jogging, hiking). From direct knowledge and self-report, he has no history of psychiatric illness, concussion, or head trauma. The MRI scans indicated no brain abnormalities. Beck Anxiety Inventory (BAI) and Beck Depression Inventory (BDI-II) questionnaires, with reference time period modified to that day, were taken each evening over the study period. Daily scores were within normal anxiety (BAI mean [SD] = 0.01 [0.108]) and no depression (BDI-II mean [SD] = 0.04 [0.200]) ranges. He experienced no illnesses or trauma during the study, and day-to-day activities involved usual work and home routines with no travel, training, medical, or other unusual interventions. These activities were considered consistent with usual daily maintenance of brain and body.
Regular health monitoring was done over the study including daily measures of pulse, blood pressure, blood glucose, oral temperature, weight, activity (steps/day), and sleep; in addition, hemoglobin A1c (HbA1c) and lipid measures were determined at the end of the study period. These measures have been reported previously.13 Metabolic syndrome risk was assessed according to accepted standard criteria (ie, ⩾3 measures above cut-point criteria for waist circumference, triglycerides, high-density lipoprotein, blood pressure, and fasting glucose).18 Three physicians who were not involved in the study independently reviewed body measures from the study period and rated these measures to be within, or approximate healthy ranges (marginally low pulse [57 ± 3 bpm] and marginally high systolic pressure [124 ± 7 mm Hg] on arising in mornings). In accordance with the Declaration of Helsinki and national ethics guidelines, the study was done after review and approval by the University of Toledo Institutional Review Board and with subject informed written consent.
Longitudinal N-of-1 time series paradigm
As described previously,13 brain scans were made on 22 dates across a 25-week period. Except for missed scans at weeks 2, 6, and 7, scans were taken at 1-week intervals on the same day of the week. On each date, 2 scans were completed in 1 session, with removal from the scanner between the first (scan A) and second (scan B) scans. Scanning on each date required 11.2 minutes for each scan with ≈5 minutes between scans for removal from the scanner, repositioning, and scan setup. This paradigm provided a total brain sample time of 8.2 hours in this person.
Scan and scan processing procedures
The procedures have been previously described.13 In brief, all scans were made with the same 3T GE Signa scanner, 8-channel head coil, and T1-weighted scan protocol (Fast Spoiled Gradient Recall Echo, repetition time = 7.8 ms, echo time = 3 ms, inversion time = 650 ms, flip angle = 9°, bandwidth = 31.25 kHz, field of view = 256 × 256 mm, voxel size = 1 × 1 × 1 mm, 164 axial slices bracketing entire brain with no gaps between slices). During the study, regular scanner quality assurance tests identified no problems and scanner upgrades were not done.
Scanning was done at similar mid-day times (start time mean ± SD: 1:55 pm ± 2.1 hours). Stimulants/diuretics, eg, caffeine-containing beverages and chocolate, were not taken 12 hours before scanning, otherwise drinking, eating, and physical activity prior to scans were within day-to-day normal ranges. For each scan, the body was comfortably supine and the head was positioned with consistent orthogonal laser beam alignment on the face midline and outer canthus of each eye. Snug insertion of earplugs and padding around the head were used to minimize scanner sound and thickness biasing due to movement. To further minimize movement, the individual remained attentive during scans by visually focusing on a point in the scanner and counting seconds of scan time. Continuous attentiveness was affirmed by reaching an appropriate total count at scan end for each scan. Scan A and B images were visually checked at scanning to rule out motion and other artifacts and to assure that continuous bilaterally symmetric axial slices were taken of the entire medulla to cortex neuraxis.
To ensure uniform processing and as a blind control during the study, all scans were processed at one time after completion of all scans. All processing was done with one workstation, operating system, and FreeSurfer program, using automated FreeSurfer procedures which provided reliable measures of cortical thickness (http://surfer.nmr.mgh.harvard.edu).19 As part of the design to treat data from all dates as equal and independent measures, thickness measures were taken in native space without transformation to a template. The FreeSurfer longitudinal pipeline was not used and all scans were processed independently to preserve variation at each time point. During processing, cortical borders for all slices of all scans were visually checked by an experienced FreeSurfer imaging specialist and were judged to be accurate and to not require manual correction. FreeSurfer defined cortical thicknesses at ≈150 000 vertex locations per hemisphere. For each scan, mean cortical thickness was determined for each hemisphere using all vertex measures from that hemisphere.
Thickness maintenance analyses
Two properties of structural maintenance were assessed for the right and left cortices: hemispheric mean thickness magnitudes measured at single time points and hemispheric mean thickness variations over week intervals between 2 successive time points. Thickness magnitudes were expressed in millimeters. For thickness variations, thickness at the earlier time was subtracted from thickness at the later time to indicate thickness increments over time as positive variations and thickness decrements over time as negative variations, which were expressed as percent changes [(later-earlier)/earlier × 100].
Analyses of maintenance of thickness magnitudes
Initial analyses used nonparametric Kolmogorov-Smirnov (K-S) tests to compare the distributions of thickness magnitudes of left and right sides and the scan A and scan B results. A nonparametric test was applied because data came from 1 subject. The K-S test was used because it provided the advantages of making no assumptions about the compared distributions and of having sensitivity to differences in multiple distribution properties including variation, skewness, kurtosis, and central tendency.20
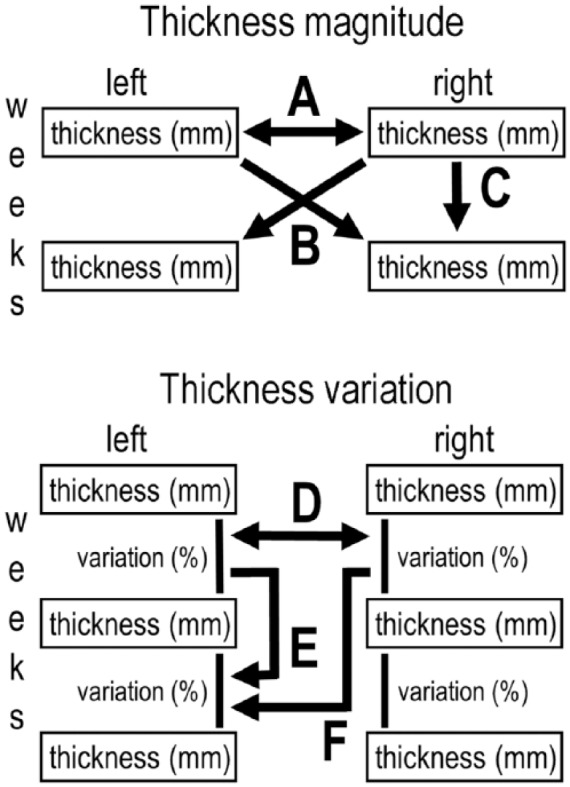
Subsequent analyses assessed time-related relationships in maintenances of thickness magnitudes of the 2 cortices, using bivariate correlation tests (Pearson r). Relationships were first examined for matched weeks to test whether thickness magnitudes on the 2 sides were related at corresponding times. We refer to these as matched time maintenance relationships. Given that maintenance continues from 1 week to the next, correlation analyses also examined potential relationships between previous vs subsequent week thickness magnitudes. We refer to these as shifted time maintenance relationships. In an N-of-1 time series design, shifted time analyses can potentially provide interesting advantages for examining maintenance dynamics. First, they had the capacity to define a temporal direction to any observed relationship; that is, shifted time analyses could assess “if-then” temporal maintenance contingencies between earlier vs later (ie, “if” earlier “then” later) thickness magnitudes. Second, by comparing thickness magnitudes of opposite left vs right sides, and of the same left vs left or right vs right side, shifted time analyses could assess potential symmetries/asymmetries in “if-then” temporal maintenance contingencies. In addition, by comparing outcomes of matched time and shifted time analyses, it was possible to examine whether and how maintenance relationships of thickness magnitudes at matched times extended forward in time. Together, the matched and shifted time analyses provided useful ways to examine dynamics of maintenances of thickness magnitudes of the 2 cortices.
Analyses of thickness maintenance variations
These analyses examined relationships in percent thickness variations of the 2 cortices with the above procedures used for thickness magnitude analyses. Relationships in percent thickness variations of the 2 cortices were first analyzed for matched time intervals following which relationships were analyzed for shifted time intervals.
Significance levels
An initial significance level of P ⩽ .05 was used. For analyses that required 2 correlation tests due to separate testing of relationships for each side, an adjusted more conservative Bonferroni-corrected P value of ⩽.025 (.05/2) was used to define a significant result, and P values >.025 and ⩽ .05 were considered trends toward significance. Given that maintenance is ongoing continuously, recognition of trends was useful to permit consideration of whether, eg, strong relationships at matched times may have extended forward in time as meaningful but weaker relationships with trends toward significance.
Results
Analyses of maintenance of thickness magnitudes (mm)
Maintenance of right vs left thickness magnitudes across the study
Analysis 1
Thickness magnitudes of right cortex were consistently larger than magnitudes of left cortex across all weeks for both scan A and scan B (Figure 1; scan A, P = .003; scan B, P = .003). This suggests that left and right cortices were continuously asymmetrically maintained at different thicknesses.
Figure 1.
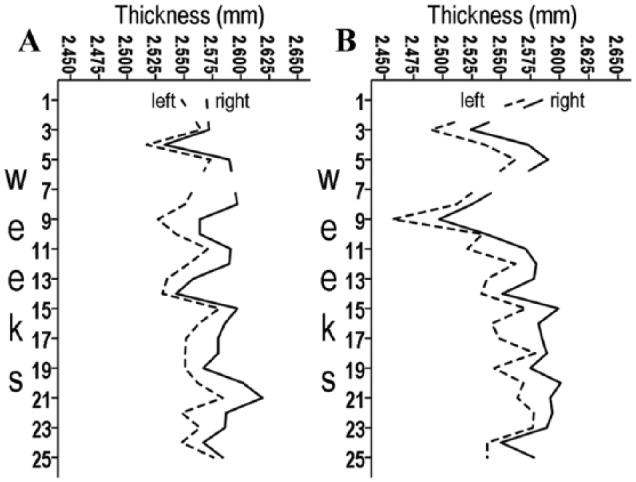
Thicknesses of left and right cortices for (A) scan A and (B) scan B over the 6-month study period. Right thickness was consistently larger than left thickness at each week for both scan series.
In contrast to this right vs left difference, right thickness magnitudes for scan A vs B and left thickness magnitudes for scan A vs B did not significantly differ (right, P = .860; left, P = .215). Previous analyses have further shown that, for both hemispheres, thickness magnitudes from scan A significantly positively correlated with thickness magnitudes from scan B, and thickness magnitudes from each scan series similarly differed from measurement error for both hemispheres.13 Given these similarities in scan A and B results, data on each side from scans A and B were pooled in subsequent analyses.
Matched time relationship in maintenance of thickness magnitudes
Analysis 2
This analysis examined the correlation in maintenances of left vs right thickness magnitudes at matched weeks. The scatterplot for matched weeks revealed clustering that was associated with a positive linear regression line (R2 = 0.785) and significant positive correlation (P < .001) (Figure 2A). This relationship is consistent with a high degree of correspondence and symmetry in maintenance dynamics of thickness magnitudes of opposite cortices at matched times.
Figure 2.

Thickness magnitude (mm) analyses. For A to E, upper part indicates matched or shifted time relationship that was tested and lower part indicates corresponding scatterplot and linear regression line for that relationship. (A) Matched time analysis 2. (B, C) Shifted time analysis 3. (D, E) Shifted time analysis 4. See text for findings.
Shifted time relationships in maintenance of thickness magnitudes
Thickness maintenance is continuous from 1 week to the next. This raises the possibility that maintenance dynamics of thickness magnitudes at earlier and later times may be related. To examine this possibility, shifted time analyses focused on how thickness magnitude of the preceding week related to thickness magnitude of the subsequent week.
Analysis 3
Extending the above comparison of opposite side thicknesses at matched weeks forward in time, this analysis examined whether the preceding week thickness magnitude on one side was related to the subsequent week thickness magnitude on the opposite side. The scatterplot of preceding week right thicknesses vs the subsequent week left thicknesses revealed clustering associated with a moderately positive linear regression line (R2 = 0.102) and trend toward positive correlation (P = .051) (Figure 2B). The scatterplot of preceding week left thicknesses vs the subsequent week right thicknesses revealed clustering associated with a similar moderately positive linear regression line (R2 = 0.106) and trend toward positive correlation (P = .046) (Figure 2C).
Given these trends at 1-week separation, we extended separation by a further week in post hoc examinations of 2-week periods between early and later thickness measures. These examinations revealed flat linear regression lines and no significant correlations or correlation trends (right vs left: R2 = 0.006, P = .649; left vs right: R2 = 0.0006, P = .882).
Analysis 3 results are suggestive of trends toward bilateral correspondence or symmetry in maintenance dynamics between opposite side thickness magnitudes for preceding vs subsequent periods of 1, but not 2, weeks. These forward-going positive relationship trends between opposite sides were weaker than the significant positive relationship between opposite sides at matched weeks (compare Figure 2B and C with Figure 2A).
Analysis 4
This analysis examined whether the preceding week thickness magnitudes on one side were related to the subsequent week thickness magnitudes on the same side. The plot of preceding week right thicknesses vs subsequent week right thicknesses showed clustering associated with a positive linear regression line (R2 = 0.148) and significant positive correlation (P = .017) (Figure 2D). The plot of preceding week left thicknesses vs subsequent week left thicknesses showed clustering associated with a relatively flat linear regression line (R2 = 0.058) and nonsignificant correlation (P = .145) (Figure 2E).
Given the significant correlation on the right side at 1-week separation, we extended separation by a further week in post hoc examinations of 2-week separations between early and later thickness measures. These examinations revealed flat linear regression lines and no significant correlations or correlation trends (right vs right: R2 = 0.00005, P = .967; left vs left: R2 = 0.007, P = .631).
The analysis 4 difference in right vs left side correlations suggests an asymmetry in the maintenance dynamics of preceding vs subsequent week thickness magnitudes on the same side, with stronger influence on the right side. This held for 1, but not 2, week periods. The forward going positive relationship on the right side was weaker than the relationship between the right and left sides at matched weeks (compare Figure 2D with Figure 2A).
Analyses of thickness maintenance variations (%)
The above analyses focused on maintenance of thickness magnitudes taken at individual time points. The next analyses focused on thickness maintenance variations over week intervals. These analyses followed the above approach of examining relationship dynamics for matched and shifted times.
Matched time relationship in thickness maintenance variations
Analysis 5
The scatterplot comparing opposite right vs left maintenance variations for matched intervals revealed clustering associated with a positive linear regression line (R2 = 0.717) and significant positive correlation (P < .001) (Figure 3A). This relationship is consistent with a high degree of correspondence and symmetry in maintenance variation dynamics of opposite right and left thickness variations for matched intervals.
Figure 3.

Thickness maintenance variation (%) analyses. Conventions for upper and lower parts of A to E as in Figure 2. (A) Matched time analysis 5. (B, C) Shifted time analysis 6. (D, E) Shifted time analysis 7. See text for findings.
Shifted time relationships in thickness maintenance variations
Analysis 6
Extending the above analysis 5 comparisons of opposite side maintenance variations for matched intervals, this analysis examined if maintenance variation over the preceding week interval on one side was related to maintenance variation during the subsequent week interval on the opposite side. The scatterplot of preceding week right vs subsequent week left maintenance variations revealed clustering associated with a negative linear regression line (R2 = 0.136) and trend toward negative correlation (P = .032) (Figure 3B). The scatterplot of preceding week left vs subsequent week right maintenance variations revealed clustering associated with a relatively flat linear regression line (R2 = 0.044) and nonsignificant correlation (P = .234) (Figure 3C).
Given the above right vs left correlation trend for successive 1-week intervals with first and last thickness measures separated by 2 weeks (Figure 3B), separations were extended in post hoc examinations to the next earlier interval, thus involving nonsuccessive 1-week intervals with 3-week separation between first and last measures. These examinations revealed relatively flat linear regression lines and no significant correlations or correlation trends (right vs left: R2 = 0.017, P = .497; left vs right: R2 = 0.061, P = .188).
The analysis 6 trend toward negative correlation between preceding right and subsequent left maintenance variation vs no correlation between the preceding left and subsequent right maintenance variation suggests a trend toward asymmetric maintenance dynamics, with a larger opposite side influence directed from the right to the left side (Figure 3B and C). This was seen for maintenance variations involving thickness measures spanning 2, but not 3, weeks. The forward-going negative trend between right vs left side variations is weaker and differs in direction from the significant positive correlation between the right vs left side variations for preceding matched intervals (compare Figure 3B with Figure 3A).
Analysis 7
This analysis tested whether maintenance variations over the preceding week interval on one side were related to the subsequent week interval maintenance variations on the same side. The plot of preceding week right variations vs the subsequent week right variations revealed clustering associated with a relatively flat linear regression line (R2 = 0.080) and nonsignificant correlation (P = .106) (Figure 3D). In contrast, the plot of preceding week left variations vs the subsequent week left variations revealed clustering associated with a negative linear regression line (R2 = 0.268) and significant negative correlation (P = .002) (Figure 3E).
Given the significant left side correlation for successive 1-week intervals with thickness measures separated by 2 weeks (Figure 3E), separations were extended in post hoc examinations to the next earlier 1-week interval and a 3-week separation between thickness measures. These examinations revealed relatively flat linear regression lines and no significant correlations or correlation trends (right vs right: R2 = 0.086, P = .115; left vs left: R2 = 0.004, P = .737).
The difference in analysis 7 right vs left relationships is consistent with asymmetry of maintenance variation dynamics across periods between early and later thickness measures of 2, but not 3, weeks. The forward-going significant negative relationship on the left side differed in direction from the significant positive relationship between the left and right sides for preceding matched intervals (compare Figure 3E with Figure 3A).
Discussion
Much work has gone into understanding relationships in structural development of distinct parts of the developing human brain. In contrast, little is known about relationships in subsequent structural maintenances of distinct parts of the mature human brain, including the 2 separate cortices. This lack of knowledge particularly applies at the individual brain level. In an effort to increase understanding of relationships in structural maintenances of the 2 cortices in an individual brain, this study used, for the first time, an N-of-1 paradigm to define how maintenances of the mean thicknesses of the 2 cortices in an individual brain were related from week-week over a several month period. There are 3 findings.
First, structural maintenances of the 2 cortices appeared to be symmetric in some respects. Indications of maintenance symmetry included significant positive correlations for matched times between opposite left and right maintenance magnitudes (Figure 4A) and variations (Figure 4D). Symmetry was also suggested by bilateral correlation trends between thickness magnitudes of each side with the opposite side at the preceding vs subsequent week (Figure 4B). Possible interpretations of these symmetries include, eg, that thickness maintenance factors within each cortex influenced the other cortex in a mutually balanced way and/or that maintenances of both cortices were influenced by outside factors that affected both cortices in a balanced way. Whether these or other interpretations apply, the observed symmetries suggest a concept that the 2 cortices of this brain were, in some respects, dynamically maintained from week-week in a bilaterally related fashion.
Figure 4.
Summary of relationships in maintenance of thickness magnitudes (top) and thickness maintenance variations (bottom) that reached significant (A, C, D, and E) and trend (B and F) levels of significance.
Second, in other respects, structural maintenances of the 2 cortices appeared to be asymmetric. Indications of maintenance asymmetry included a significant (1) difference between right vs left thickness magnitudes from week-week (Figure 1); (2) unilateral correlation between thickness magnitudes at preceding vs subsequent weeks for right, but not left, cortex (Figure 4C); and (3) unilateral correlation between preceding vs subsequent week left maintenance variations that was not seen on the right side (Figure 4E). Beyond these asymmetries that reached significance, there was also (4) a correlation trend between preceding week right vs subsequent week left maintenance variations, which was not replicated between the preceding left vs subsequent right maintenance variations (Figure 4F). Potential interpretations of these asymmetries include, eg, that week-week maintenance factors operating within each cortex and/or from outside cortex differ for the 2 cortices. These or other interpretations aside, these asymmetries suggest a concept that, in some respects, the 2 cortices of this brain were dynamically maintained from week-week with lateralized differences.
Third, structural maintenances of the 2 cortices showed temporal continuity whereby maintenance relationships between left and right thicknesses at matched weeks extended forward as preceding to subsequent week maintenance relationships that were positive or negative, with the opposite or same side, and of variable correlation strengths. Continuity dynamics were suggested by a significant positive correlation between thickness magnitudes of left vs right sides for the same week (Figure 4A) which extended forward, first, as a significant positive correlation between thickness magnitude on the right side and subsequent week right thickness magnitude (Figure 4C) and, second, as weaker bilateral positive correlation trends with thickness magnitudes of the opposite sides for the subsequent week (Figure 4B). Temporal continuity dynamics were further suggested by a significant positive correlation between maintenance variations of left vs right sides for the same week (Figure 4D) which extended forward, first, as a significant negative correlation between maintenance variation on the left side with subsequent week left maintenance variation (Figure 4E) and, second, as a negative correlation trend between the maintenance variation on the right side with subsequent week left maintenance variation (Figure 4F). Continuity dynamics were seen for initial and later thickness measures that spanned 1 or 2, but not 3, weeks. These results indicate that thickness maintenance dynamics at earlier times influenced maintenance dynamics on the same and/or opposite side at later times and suggest a concept of temporal continuity whereby thickness at any particular time not only reflects maintenance at that time but, in addition, influences future maintenance.
We note that results that reached significance and results that reached trend levels of significance are clearly distinguished. We would argue that this is useful for the present time-series analyses. For example, the significant strong correlations at matched times may, as seen in shifted time analyses, have forward going correlation trends that are weaker, but still potentially meaningful. Identification of trends permitted transparent consideration of this possibility without either exaggerating or overlooking these potentially meaningful relationships. We also note that each of the above 3 concepts was supported by more than one relationship that reached significance. These concepts of maintenance dynamics in an individual brain have not been previously recognized.
How did symmetry, asymmetry, and temporal continuity dynamics work together to maintain the 2 cortices in this brain?
This study examined an individual brain’s relationships in left and right cortical maintenance without assessing factors that might influence these relationships. It is known from group studies that cortical thickness is influenced by experience/environmental factors including, eg, age, language, handedness, intelligence, and hormonal levels.21–23 In addition, studies of groups of twins show that genetic factors also make contributions to adult thickness magnitudes of each cortex.22–26 There appears to be less consensus on whether symmetry/asymmetry between the 2 cortices is genetically determined, and recent studies suggest that further investigations are needed to determine how the nature and timing of specific genetic and nongenetic factors influence side-side thickness relationships.21,22,26
Mechanisms for thickness fluctuations also need to be considered. The reversible incremental and decremental fluctuations in hemispheric thickness maintenance in the presently studied individual have been proposed to result from mechanisms that underlie normally ongoing maintenance remodeling/turnover in the cortical substrates that contribute to thickness.13 These substrates include neurons with their neuropil, glia and associated processes, arterial-capillary-venous vasculature cells, and extracellular-glymphatic-vascular fluid spaces. In adult animals, these substrates can reversibly remodel or turnover during short intervals of days to weeks as a result, eg, of extensions/retractions of axonal branches and boutons,27–29 spines and dendrites,30–33 and glial processes,34–36 over distances of a few micrometers for spines,37 and several, tens, or more micrometers for cell processes.27,35,38,39 Turnover can also include cell loss, angiogenesis,40,41 gliogenesis,42,43 and fluxes in volumes of cells44,45 and intravascular and extravascular spaces.46,47 Given these ongoing changes and high substrate densities, related thickness fluctuations are arguably quite plausible.13 It also appears reasonable to extend this proposal by suggesting that genetic and environmental/experience factors influence cortical thickness by affecting these continuously ongoing maintenance remodeling/turnover mechanisms.
Study of the above factors and mechanisms was beyond the scope of this work; however, it seems obvious that the observed symmetry, asymmetry, and temporal continuity dynamics were influenced by the studied individual’s genetic and/or environmental/experience factors. It also seems likely that the observed range of strong and weaker and positive and negative correlations in the presently studied individual reflected influences of multiple factors. Given these possibilities, it is difficult to suggest a unifying proposal for how the observed maintenance symmetry, asymmetry, and temporal continuity dynamics worked together without having a better understanding of how genetic and/or experience/environmental factors affected maintenance remodeling/turnover mechanisms in the studied individual.
The above caveat aside, one suggestion seems reasonable. Concepts of side-side maintenance symmetry, asymmetry, and temporal continuity as occurred in the present individual are presumably generalizable to other individual brains. However, the particular ways these concepts become expressed, eg, whether symmetries apply at matched or shifted times, whether thicknesses of the 2 cortices are equal or unequal, and whether asymmetries occur on one or the other side, may partly reflect individual-specific maintenance traits or states that emerge from individuality in genetic and/or experience/environmental influences and their play on maintenance remodeling/turnover mechanisms. This merits further study at an individual level.
Current concepts of side-side cortical thickness relationships
To our knowledge, no previous work has examined relationships in ongoing maintenance dynamics of the 2 cortices in an individual brain. Previous work has, however, examined thickness magnitudes of left and right cortices in other ways.
Individual-focused analyses
One study used longitudinal MRI scans from each of 5 healthy adults to compare within-individual relationships of thickness magnitudes of left vs right postcentral and precentral cortical areas.48 In each individual, left vs right thickness magnitudes of each area either differed or were equal at matched times. Interestingly, although sampling in each individual was limited to 3 to 5 scans at irregular 2- to 24-week intervals, each individual’s particular different or equal left vs right thickness relationship for each area was consistent across time. Conceptually, the individuals who had a consistent side-side difference in thickness magnitudes resemble the finding in the present individual that right thickness magnitude was consistently larger than left thickness magnitude across all times.
Group analyses paradigms
Elegant adult work on thickness symmetry/asymmetry has employed group analysis paradigms using single time hemispheric and/or regional measures to define group average left vs right thickness magnitudes that were then compared.49–53 Although findings vary regarding extents and lateralities of side-side symmetry or asymmetry, this work clearly indicates that concepts of symmetry and asymmetry apply to group average thickness magnitudes.
Group-based concepts of symmetry and asymmetry differ in important respects from concepts of symmetry and asymmetry derived with the present individual brain paradigm. For example, group-based work averages across, and does not distinguish, individuals who, eg, have greater right than left, greater left than right, or equal right and left thicknesses and, as a consequence, defines concepts of symmetry and asymmetry that are group average, not individual, focused. In addition, differing from the concepts of symmetry and asymmetry defined in the present individual brain, group-based concepts of symmetry/asymmetry are more influenced by between-individual, rather than within-individual, variation. For these and other reasons, it is presently difficult to relate our findings to available group results.
Just as group-based findings are not necessarily representative of an individual, findings in an individual are not necessarily representative of group-based findings; thus, concepts arising from each level of analyses need to be understood. Given the above and other differences in concepts of symmetry/asymmetry at group and individual levels, we suggest an individual-focused N-of-1 time series provides a useful paradigm that can supplement group-based paradigms in resolving concepts of side-side cortical maintenance relationships and dynamics that apply to individual brains.
Implications
Development of precision medicine N-of-1 paradigms for assessing cortical thickness maintenance in health and disease
There is increasing interest in how side-side symmetries/asymmetries in cortical structure contribute to brain and body disorders.54 Recent group studies suggest cortical thickness asymmetries play a role in a diverse range of disorders including, eg, carotid occlusive disease,55 obsessive-compulsive disorder,56 multiple sclerosis,57 Parkinson disease,7 Alzheimer disease,58 schizophrenia,59,60 anorexia nervosa,61 and irritable bowel syndrome.62 Converging with these findings, there is also growing interest in developing precision medicine N-of-1 approaches that can contribute to a knowledge base for understanding disease prevention and treatment at an individual level8–11; however, needed research using individual brain study paradigms is only just beginning.
The present findings can contribute to identification of concepts of side-side cortical structural maintenance that are pertinent to development of precision medicine N-of-1 paradigms. In this regard, this study repeatedly tracked side-side thickness maintenance for matched and preceding vs subsequent times. Side-side correlations at matched times (Figure 4A and D) do not have a cause-effect direction or vector; that is, these correlations are observational and do not distinguish whether, for example, left side effects affect the right side, right side effects affect the left side, or both sides have mutually reciprocal impacts. In contrast, correlations between measures from preceding to subsequent weeks have earlier to later temporal directions or vectors (Figure 4B,C,E,F). Although these vectors do not demonstrate cause-effect, they arguably indicate “if-then” contingencies, ie, “if” this occurred earlier, “then” this followed.
Identification of “if-then” contingencies is interesting in the following respects. (1) For cortex to remain viable, thickness maintenance must be continuously ongoing, and the present findings provide evidence that cortical thickness maintenances at an earlier time (in the case of thickness magnitudes) or over an earlier period (in the case of thickness variations) influence thickness maintenance at later times. From the studied individual’s brain, it appears these “if-then” temporal contingencies can involve 1- to 2-week periods, both hemispheres, and positive and negative relationships in thickness maintenance from preceding to following times. (2) To our knowledge, the present results provide the first evidence for “if-then” temporal contingencies in thickness maintenance. It seems likely that maintenance contingencies are, to some degree, individual brain specific. If this proves to be true, thickness analyses at a group level may not have adequate resolution to define thickness maintenance contingencies, and N-of-1 analyses may be needed. This may explain why these contingencies have not been previously recognized. (3) “If-then” contingencies do not establish maintenance mechanisms per se, but they may be useful to study cortical maintenance mechanism chronologies. For example, it may be useful to examine temporal relationships between “if-then” contingencies in thickness maintenance and concurrent systemic body measures to define temporal sequences of brain/body homeostasis mechanisms in an individual. (4) Finally, “if-then” thickness maintenance contingencies during periods of normal health may, during cortical disorders, become disrupted in ways that can be clinically defined with MRI using N-of-1 paradigms. In the studied individual, disruptions might be defined, eg, by loss or changes in one or more of the observed week-week temporal contingencies. From this view, cortical disorders involving thickness changes may be partly envisioned as disruptions in ongoing temporal continuity dynamics of thickness maintenance.
Limitations
This work has clear limitations. The N-of-1 time series paradigm needed to address the question of interest was resource intensive in requiring repetitive sampling at regular short intervals of one brain over a substantial period. Although it appears unlikely that maintenance concepts from the present analyses only apply to this individual, further work using N-of-1 paradigms in other individuals is needed to test this claim. In addition, this exploratory study focused on hemispheric mean thickness maintenance because maintenance is spatially ubiquitous and continuously ongoing across the entire cortical hemisphere. Further work focusing on thicknesses in cortical regions of interest would be useful to test side-side maintenance homogeneity and heterogeneity for different cortical locations in an individual brain.
Conclusions
This study used an MRI N-of-1 time series paradigm to study relationships in ongoing maintenances of the thicknesses of the left and right cortices of an individual brain at week intervals over 6 months. The results suggest side-side maintenance relationships which reflect concepts of symmetry, asymmetry, and “if-then” contingencies in temporal continuity that are novel and have not been previously recognized. The findings require confirmation in other intensively studied individuals, and merit attention because they have implications for identifying maintenance states/traits, and for development of N-of-1 precision medicine paradigms, which can contribute to understanding cortical health maintenance at an individual person level.
Acknowledgments
The authors are very grateful to Cindy Grey, Sue Yeager, Michelle Hanus, and Lindsey Katschke for their technical expertise and to Drs William Bauer, Hongyan Li, and Mischka Gerken for generous assistance.
Footnotes
Funding:The author(s) disclosed receipt of the following financial support for the research, authorship and/or publication of this article: This work was supported by University Research Incentive Funding.
Declaration of conflicting interests:The author(s) declared no potential conflicts of interest with respect to the research, authorship, and/or publication of this article.
Author Contributions: HX, JW, and XW conceived and designed the experiment. JW and XW contributed to data acquisition. HX and JW analyzed the data, wrote the manuscript, and jointly developed the structure and arguments for the paper. All authors reviewed and approved the final version.
ORCID iD: John Wall  https://orcid.org/0000-0003-0947-2162
References
- 1. Vrselja Z, Brkic H, Curic G. Arterial tree asymmetry reduces cerebral pulsatility. Med Hypotheses. 2015;85:622–627. [DOI] [PubMed] [Google Scholar]
- 2. Amin-Hanjani S, Du X, Pandey DK, Thulborn KR, Charbel FT. Effect of age and vascular anatomy on blood flow in major cerebral vessels. J Cereb Blood Flow Metab. 2015;35:312–318. [DOI] [PMC free article] [PubMed] [Google Scholar]
- 3. Zarrinkoob L, Ambarki K, Wahlin A, Birgander R, Eklund A, Malm J. Blood flow distribution in cerebral arteries. J Cereb Blood Flow Metab. 2015;35:648–654. [DOI] [PMC free article] [PubMed] [Google Scholar]
- 4. Amin FM, Lundholm E, Hougaard A, et al. Measurement precision and biological variation of cranial arteries using automated analysis of 3 T magnetic resonance angiography. J Headache Pain. 2014;15:25. [DOI] [PMC free article] [PubMed] [Google Scholar]
- 5. Wentland AL, Rowley HA, Vigen KK, Field AS. Fetal origin of the posterior cerebral artery produces left-right asymmetry on perfusion imaging. AJNR Am J Neuroradiol. 2010;31:448–453. [DOI] [PMC free article] [PubMed] [Google Scholar]
- 6. Dimmick SJ, Faulder KC. Normal variants of the cerebral circulation at multidetector CT angiography. Radiographics. 2009;29:1027–1043. [DOI] [PubMed] [Google Scholar]
- 7. Claassen DO, McDonell KE, Donahue M, et al. Cortical asymmetry in Parkinson’s disease: early susceptibility of the left hemisphere. Brain Behav. 2016;6:e00573. [DOI] [PMC free article] [PubMed] [Google Scholar]
- 8. Schork NJ. Personalized medicine: time for one-person trials. Nature. 2015;520:609–611. [DOI] [PubMed] [Google Scholar]
- 9. Insel TR, Cuthbert BN. Medicine. Brain disorders? Precisely. Science. 2015;348:499–500. [DOI] [PubMed] [Google Scholar]
- 10. Collins FS, Varmus H. A new initiative on precision medicine. N Engl J Med. 2015;372:793–795. [DOI] [PMC free article] [PubMed] [Google Scholar]
- 11. van der Stel JC. Precision in psychiatry. Acta Psychiatr Scand. 2015;132:310–311. [DOI] [PubMed] [Google Scholar]
- 12. Barth C, Steele CJ, Mueller K, et al. In-vivo dynamics of the human hippocampus across the menstrual cycle. Sci Rep. 2016;6:32833. [DOI] [PMC free article] [PubMed] [Google Scholar]
- 13. Wall J, Xie H, Wang X. An exploration into short-interval maintenance of adult hemispheric cortical thickness at an individual brain level. J Exp Neurosci. 2017;11:1–14. [DOI] [PMC free article] [PubMed] [Google Scholar]
- 14. Pereira JB, Ibarretxe-Bilbao N, Marti MJ, et al. Assessment of cortical degeneration in patients with Parkinson’s disease by voxel-based morphometry, cortical folding, and cortical thickness. Hum Brain Mapp. 2012;33:2521–2534. [DOI] [PMC free article] [PubMed] [Google Scholar]
- 15. Kumar R, Yadav SK, Palomares JA, et al. Reduced regional brain cortical thickness in patients with heart failure. PLoS ONE. 2015;10:e0126595. [DOI] [PMC free article] [PubMed] [Google Scholar]
- 16. Chiappelli J, Kochunov P, Savransky A, et al. Allostatic load and reduced cortical thickness in schizophrenia. Psychoneuroendocrinology. 2017;77:105–111. [DOI] [PMC free article] [PubMed] [Google Scholar]
- 17. Reavis EA, Lee J, Wynn JK, Engel SA, Jimenez AM, Green MF. Cortical thickness of functionally defined visual areas in schizophrenia and bipolar disorder. Cereb Cortex. 2017;27:2984–2993. [DOI] [PMC free article] [PubMed] [Google Scholar]
- 18. Alberti KG, Eckel RH, Grundy SM, et al. Harmonizing the metabolic syndrome: a joint interim statement of the International Diabetes Federation Task Force on Epidemiology and Prevention; National Heart, Lung, and Blood Institute; American Heart Association; World Heart Federation; International Atherosclerosis Society; and International Association for the Study of Obesity. Circulation. 2009;120:1640–1645. [DOI] [PubMed] [Google Scholar]
- 19. Fischl B. FreeSurfer. Neuroimage. 2012;62:774–781. [DOI] [PMC free article] [PubMed] [Google Scholar]
- 20. Sokal RR, Rohlf FJ. Biometry: The Principles and Practice of Statistics in Biological Research. 4th ed. New York: W. H. Freeman; 2012. [Google Scholar]
- 21. Bishop DVM. Cerebral asymmetry and language development: cause, correlate or consequence? Science. 2013;340:1230531. [DOI] [PMC free article] [PubMed] [Google Scholar]
- 22. Eyler LT, Vuoksimaa E, Panizzon MS, et al. Conceptual and data-based investigation of genetic influences and brain asymmetry: a twin study of multiple structural phenotypes. J Cogn Neurosci. 2014;26:1100–1117. [DOI] [PMC free article] [PubMed] [Google Scholar]
- 23. Kremen WS, Prom-Wormley E, Panizzon MS, et al. Genetic and environmental influences on the size of specific brain regions in midlife: the VETSA MRI study. Neuroimage. 2010;49:1213–1223. [DOI] [PMC free article] [PubMed] [Google Scholar]
- 24. Panizzon MS, Fennema-Notestine C, Eyler LT, et al. Distinct genetic influences on cortical surface area and cortical thickness. Cereb Cortex. 2009;19:2728–2735. [DOI] [PMC free article] [PubMed] [Google Scholar]
- 25. Blokland GAM, de Zubicaray GI, McMahon KL, Wright MJ. Genetic and environmental influences on neuroimaging phenotypes: a meta-analytical perspective on twin imaging studies. Twin Res Hum Genet. 2012;15:351–371. [DOI] [PMC free article] [PubMed] [Google Scholar]
- 26. Jansen AG, Mous SE, White T, Posthuma D, Polderman TJC. What twin studies tell us about the heritability of brain development, morphology, and function: a review. Neuropsychol Rev. 2015;25:27–46. [DOI] [PMC free article] [PubMed] [Google Scholar]
- 27. De Paola V, Holtmaat A, Knott G, et al. Cell type-specific structural plasticity of axonal branches and boutons in the adult neocortex. Neuron. 2006;49:861–875. [DOI] [PubMed] [Google Scholar]
- 28. Stettler DD, Yamahachi H, Li W, Denk W, Gilbert CD. Axons and synaptic boutons are highly dynamic in adult visual cortex. Neuron. 2006;49:877–887. [DOI] [PubMed] [Google Scholar]
- 29. Wimmer VC, Broser PJ, Kuner T, Bruno RM. Experience-induced plasticity of thalamocortical axons in both juveniles and adults. J Comp Neurol. 2010;518:4629–4648. [DOI] [PubMed] [Google Scholar]
- 30. Lee W-CA, Chen JL, Huang H, et al. A dynamic zone defines interneuron remodeling in the adult neocortex. Proc Natl Acad Sci U S A. 2008;105:19968–19973. [DOI] [PMC free article] [PubMed] [Google Scholar]
- 31. Kozorovitskiy Y, Gross CG, Kopil C, et al. Experience induces structural and biochemical changes in the adult primate brain. Proc Natl Acad Sci U S A. 2005;102:17478–17482. [DOI] [PMC free article] [PubMed] [Google Scholar]
- 32. Holtmaat A, Randall J, Cane M. Optical imaging of structural and functional synaptic plasticity in vivo. Eur J Pharmacol. 2013;719:128–136. [DOI] [PubMed] [Google Scholar]
- 33. Perez-Cruz C, Simon M, Flugge G, Fuchs E, Czeh B. Diurnal rhythm and stress regulate dendritic architecture and spine density of pyramidal neurons in the rat infralimbic cortex. Behav Brain Res. 2009;205:406–413. [DOI] [PubMed] [Google Scholar]
- 34. Theodosis DT, Poulain DA, Oliet SH. Activity-dependent structural and functional plasticity of astrocyte-neuron interactions. Physiol Rev. 2008;88:983–1008. [DOI] [PubMed] [Google Scholar]
- 35. Hughes EG, Kang SH, Fukaya M, Bergles DE. Oligodendrocyte progenitors balance growth with self-repulsion to achieve homeostasis in the adult brain. Nat Neurosci. 2013;16:668–676. [DOI] [PMC free article] [PubMed] [Google Scholar]
- 36. Liu J, Dietz K, DeLoyht JM, et al. Impaired adult myelination in the prefrontal cortex of socially isolated mice. Nat Neurosci. 2012;15:1621–1623. [DOI] [PMC free article] [PubMed] [Google Scholar]
- 37. Villa KL, Berry KP, Subramanian J, et al. Inhibitory synapses are repeatedly assembled and removed at persistent sites in vivo. Neuron. 2016;89:756–769. [DOI] [PMC free article] [PubMed] [Google Scholar]
- 38. Lee W-CA, Huang H, Feng G, et al. Dynamic remodeling of dendritic arbors in GABAergic interneurons of adult visual cortex. PLoS Biol. 2006;4:e126. [DOI] [PMC free article] [PubMed] [Google Scholar]
- 39. Bloss EB, Janssen WG, McEwen BS, Morrison JH. Interactive effects of stress and aging on structural plasticity in the prefrontal cortex. J Neurosci. 2010;30:6726–6731. [DOI] [PMC free article] [PubMed] [Google Scholar]
- 40. Huang CX, Qiu X, Wang S, et al. Exercise-induced changes of the capillaries in the cortex of middle-aged rats. Neuroscience. 2013;233:139–145. [DOI] [PubMed] [Google Scholar]
- 41. Ekstrand J, Hellsten J, Tingstrom A. Environmental enrichment, exercise and corticosterone affect endothelial cell proliferation in adult rat hippocampus and prefrontal cortex. Neurosci Lett. 2008;442:203–207. [DOI] [PubMed] [Google Scholar]
- 42. Emsley JG, Macklis JD. Astroglial heterogeneity closely reflects the neuronal-defined anatomy of the adult murine CNS. Neuron Glia Biol. 2006;2:175–186. [DOI] [PMC free article] [PubMed] [Google Scholar]
- 43. Young KM, Psachoulia K, Tripathi RB, et al. Oligodendrocyte dynamics in the healthy adult CNS: evidence for myelin remodeling. Neuron. 2013;77:873–885. [DOI] [PMC free article] [PubMed] [Google Scholar]
- 44. Risher WC, Andrew RD, Kirov SA. Real-time passive volume responses of astrocytes to acute osmotic and ischemic stress in cortical slices and in vivo revealed by two-photon microscopy. Glia. 2009;57:207–221. [DOI] [PMC free article] [PubMed] [Google Scholar]
- 45. Xie L, Kang H, Xu Q, et al. Sleep drives metabolite clearance from the adult brain. Science. 2013;342:373–377. [DOI] [PMC free article] [PubMed] [Google Scholar]
- 46. Ding F, O’Donnell J, Xu Q, Kang N, Goldman N, Nedergaard M. Changes in the composition of brain interstitial ions control the sleep-wake cycle. Science. 2016;352:550–555. [DOI] [PMC free article] [PubMed] [Google Scholar]
- 47. Cho ZH, Kang CK, Han JY, et al. Functional MR angiography with 7.0 T: Is direct observation of arterial response during neural activity possible? Neuroimage. 2008;42:70–75. [DOI] [PubMed] [Google Scholar]
- 48. Wang X, Gerken M, Dennis M, et al. Profiles of precentral and postcentral cortical mean thicknesses in individual subjects over acute and subacute time-scales. Cereb Cortex. 2010;20:1513–1522. [DOI] [PMC free article] [PubMed] [Google Scholar]
- 49. Meyer M, Liem F, Hirsiger S, Jancke L, Hanggi J. Cortical surface area and cortical thickness demonstrate differential structural asymmetry in auditory-related areas of the human cortex. Cereb Cortex. 2014;24:2541–2552. [DOI] [PubMed] [Google Scholar]
- 50. Maingault S, Tzourio-Mazoyer N, Mazoyer B, Crivello F. Regional correlations between cortical thickness and surface area asymmetries: a surface-based morphometry study of 250 adults. Neuropsychologia. 2016;93:350–364. [DOI] [PubMed] [Google Scholar]
- 51. Chiarello C, Vazquez D, Felton A, McDowell A. Structural asymmetry of the human cerebral cortex: regional and between-subject variability of surface area, cortical thickness, and local gyrification. Neuropsychologia. 2016;93:365–379. [DOI] [PMC free article] [PubMed] [Google Scholar]
- 52. Plessen KJ, Hugdahl K, Bansal R, Hao X, Peterson BS. Sex, age, and cognitive correlates of asymmetries in thickness of the cortical mantle across the life span. J Neurosci. 2014;34:6294–6302. [DOI] [PMC free article] [PubMed] [Google Scholar]
- 53. Luders E, Narr KL, Thompson PM, Rex DE, Jancke L, Toga AW. Hemispheric asymmetries in cortical thickness. Cereb Cortex. 2006;16:1232–1238. [DOI] [PubMed] [Google Scholar]
- 54. Gordon HW. Putting hemispheric asymmetry to use in understanding brain diseases. J Syst Integr Neurosci. 2016;3. doi:1015761JSIN1000144. [DOI] [PMC free article] [PubMed] [Google Scholar]
- 55. Asllani I, Slattery P, Fafard A, Pavol M, Lazar RM, Marshall RS. Measurement of cortical thickness asymmetry in carotid occlusive disease. Neuroimage Clin. 2016;12:640–644. [DOI] [PMC free article] [PubMed] [Google Scholar]
- 56. Peng Z, Li G, Shi F, et al. Cortical asymmetries in unaffected siblings of patients with obsessive-compulsive disorder. Psychiatry Res. 2015;234:346–351. [DOI] [PMC free article] [PubMed] [Google Scholar]
- 57. Narayana PA, Govindarajan KA, Goel P, et al. Regional cortical thickness in relapsing remitting multiple sclerosis: a multi-center study. Neuroimage Clin. 2013;2:120–131. [DOI] [PMC free article] [PubMed] [Google Scholar]
- 58. Donix M, Burggren AC, Scharf M, et al. APOE associated hemispheric asymmetry of entorhinal cortical thickness in aging and Alzheimer’s disease. Psychiatry Res. 2013;214:212–220. [DOI] [PMC free article] [PubMed] [Google Scholar]
- 59. Hedman AM, van Haren NEM, van Baal GCM, et al. Heritability of cortical thickness changes over time in twin pairs discordant for schizophrenia. Schizophr Res. 2016;173:192–199. [DOI] [PubMed] [Google Scholar]
- 60. Ehrlich S, Brauns S, Yendiki A, et al. Associations of cortical thickness and cognition in patients with schizophrenia and healthy controls. Schizophr Bull. 2012;38:1050–1062. [DOI] [PMC free article] [PubMed] [Google Scholar]
- 61. King JA, Geisler D, Ritschel F, et al. Global cortical thinning in acute anorexia nervosa normalizes following long-term weight restoration. Biol Psychiatry. 2015;77:624–632. [DOI] [PubMed] [Google Scholar]
- 62. Chua CS, Bai C-H, Shiao C-Y, et al. Negative correlation of cortical thickness with the severity and duration of abdominal pain in Asian women with irritable bowel syndrome. PLoS ONE. 2017;12:e0183960. [DOI] [PMC free article] [PubMed] [Google Scholar]