

One sentence summary:
Different tissue microenvironments differentially refine Treg-cell transcriptional regulatory modules already primed in lymphoid organs.
Abstract
Foxp3+CD4+ regulatory T (Treg) cells accumulate in certain non-lymphoid tissues, where they control diverse aspects of organ homeostasis. Populations of tissue-Tregs, as they have been termed, have transcriptomes distinct from those of their counterparts in lymphoid organs and other non-lymphoid tissues. We examined the diversification of Tregs in visceral-adipose tissue, skeletal muscle and the colon vis-à-vis lymphoid organs from the same individuals. The unique transcriptomes of the various tissue-Treg populations resulted from layering of tissue-restricted open chromatin regions over regions already open in the spleen, the latter tagged by super-enhancers and particular histone marks. The binding motifs for a small number of transcription factor (TF) families were repeatedly enriched within the accessible chromatin stretches of Tregs in the three nonlymphoid tissues. But a bioinformatically and experimentally validated transcriptional network, constructed by integrating chromatin accessibility and single-cell transcriptomic data, predicted reliance on different TF families in the different tissues. The network analysis also revealed that tissue-restricted and broadly acting TFs were integrated into feed-forward loops to enforce tissue-specific gene expression in non-lymphoid-tissue Treg cells. Overall, this study provides a framework for understanding the epigenetic dynamics of T cells operating in non-lymphoid tissues, which should inform strategies for specifically targeting them.
INTRODUCTION
The Foxp3+CD4+ subset of regulatory T (Treg) cells is one of the main elements guarding against runaway immune or inflammatory responses (1). These cells’ importance is underlined by the devastating multi-organ, auto-inflammatory diseases characteristic of IPEX (immune-dysregulation-polyendocrinopathy-enteropathy-X-linked) patients and scurfy mice, both of which bear Foxp3 mutations and consequently lack functional Tregs. Most Treg cells arise as such in the thymus (tTregs), but certain specialized populations derive from conventional CD4+ T cells in the periphery (pTregs), a process that can be partially recapitulated in vitro (iTregs).
Our initial view of Treg phenotype and function was largely focused on the control of effector T lymphocytes by Treg cells circulating through lymphoid organs. However, substantially more complexity soon became apparent [reviewed in (2)]. Tregs can control other adaptive-immune-system cells, a variety of innate immunocytes and even non-lymphoid cells. Moreover, Treg populations with distinguishable phenotypes rein in immune responses of diverse types [for example, driven by T helper (Th)1, Th2, Th17 or B cells], sometimes co-opting transcription factors (TFs) or signaling pathways characteristic of the target populations. Treg cells with even more distinct phenotypes can be found in non-lymphoid tissues – e.g. visceral adipose tissue (VAT), skeletal muscle, skin, or the colonic lamina propria – where they influence the activities of neighboring immune and non-immune cells.
VAT Foxp3+CD4+ T cells (3) are considered to be a paradigmatic “tissue-Treg” population. These cells arise in the thymus during the first week of life, seed VAT sparsely until 10–15 weeks of age, and then gradually dominate the local CD4+ T cell compartment (4). VAT Tregs have a transcriptome strikingly different from those of lymphoid-organ and other non-lymphoid-tissue Treg populations, largely driven by PPARγ, a nuclear receptor family member thought to be the “master-regulator” of adipocyte differentiation (5). They also have a distinct, clonally expanded, repertoire of antigen-specific receptors [T-cell receptors (TCRs)]. VAT Tregs control local (sterile) inflammation, and thereby local and systemic metabolic indices, via influences on both immunocytes and adipocytes (3, 6). Perhaps not surprisingly, they depend on local growth and survival factors distinct from those used by lymphoid-organ Treg cells, notably PPARγ ligands (5) and interleukin (IL)-33 (4, 6). Other tissue-Treg populations appear to be variants on the same theme, with characteristic TF profiles, transcriptomes, TCR specificities, and growth and survival factor dependencies [to the extent that these parameters have been studied [e.g. (7–13)].
Our current understanding of Treg-cell heterogeneity, for non-lymphoid-tissue Tregs in particular, is rather fuzzy. We remain ignorant of how phenotypic diversity at the population level translates to single cells, what epigenetic changes subtend the distinct transcriptomes, and what sets of TFs drive the evolution of transcriptional profiles. These issues were long refractory to analyses because of the specificity of tissue-Treg populations coupled with the insensitivity of the required genomic techniques. We have now exploited existing transcriptome data-sets and recent improvements in the Assay for Transposase-Accessible Chromatin with high-throughput sequencing (ATAC-seq) (14,15) and single-cell RNA sequencing (scRNA-seq) (16–18) that permit explorations of rare populations ex vivo. Integration of ATAC-seq and scRNA-seq data culminated in the elaboration of a transcriptional network proposed to underlie the unique tissue-Treg transcriptomes.
RESULTS
A more nuanced view of non-lymphoid-tissue Treg transcriptomes.
As a first step towards elucidating the architecture and regulation of tissue-Treg transcriptomes, we exploited existing microarray data-sets derived from double-sorted Treg cells from VAT (19), injured skeletal muscle (7) and the colonic lamina propria (9), coupled with corresponding splenic Treg populations from the same mice. These particular non-lymphoid tissues encompass, respectively: a chronic, low-grade sterile-inflammatory state; an acute, intense sterile-inflammatory state; and a state of chronic, innocuous microbiota stimulation. The study design focused on non-lymphoid-tissue:lymphoid-organ fold-changes in Treg gene expression within the same individuals, set at false-discovery rates <10%. This approach side-stepped potential issues related to unavoidable variations in physiological state (e.g. mouse age) or in protocol details. 1,909 genes were either up- or down-regulated at least 2-fold in at least one tissue-Treg population vis-à-vis its splenic counterpart. The sensitivity of these microarrays was similar to or better than recently published RNA-seq datasets on the same tissues – for example, Delacher et al. (20) reported 3,071 differentially expressed genes for VAT, while we found 4,934 genes using the same filtering criteria (p < 0.05). The majority of transcript variation segregated Treg cells by their tissue source, the first three principal components (PCs) accounting for 70% of the variance (Fig. 1A). Muscle-Treg cells were most closely related to splenic Tregs, a finding that concurs with previous functional data demonstrating that muscle (8), but not VAT (4), Treg cells communicate extensively with the circulating Treg pool. Differentially regulated genes could be grouped into several sets according to their patterns of expression in the various non-lymphoid tissues: up- or down-regulated in all three tissues (heretofore referred to as “pan-tissue”), two of them, or just one (“tissue-specific”) (Fig. 1B, Table S1).
Figure 1. Tissue-Treg gene-sets.
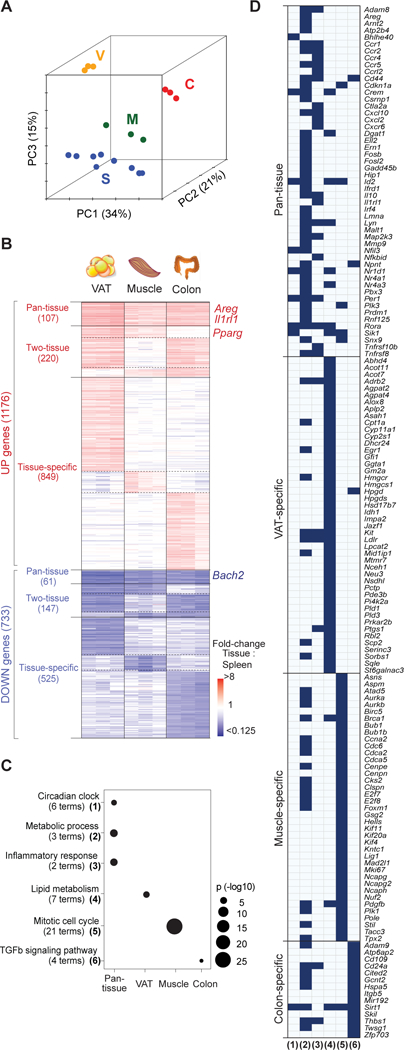
Microarray data-sets for highly purified tissue-Tregs from epididymal VAT (V) (5), injured skeletal muscle (M) (60) and colonic lamina propria (C) (9), as well as from control lymphoid-organ Treg cells (n = 3 for each tissue). (A) Principal components analysis. PC1, 2, and 3, with their proportions of explained variance. (B) Heatmap of up- and down-regulated genes more than two-fold in tissue- versus lymphoid-Tregs: 1,909 genes ordered by gene-set (with numbers of genes in parentheses). (C) Gene Ontology enrichment in the pan-tissue and tissue-specific gene-sets (61). Numbers of terms enriched under each classification are indicated in parentheses. Fischer Exact Test p-values. (D) Highlighted genes. Genes included under the GO terms enriched in the different tissues. Column numbers correspond to the numbered terms in panel C. See also Table S1.
Pathway analysis (Fig. 1C, D) revealed that the genes up-regulated across all three non-lymphoid tissues were enriched for pathways involved in circadian rhythm, metabolism and inflammation. Probably not coincidentally, the first two processes are linked in primary metabolic organs such as adipose tissue and the liver (21). Also noteworthy is that the pan-tissue gene-set included Prdm1, proposed to be a marker of effector Treg cells (22). Not surprisingly, genes specifically up-regulated in VAT-Treg cells were implicated in lipid metabolism processes, consistent with VAT-Treg accumulation of intracellular lipid droplets (5); while transcripts over-represented primarily in muscle Tregs fell within cell-cycle-related pathways, reflecting the comparatively high turnover rates of this population (8). The enrichment for genes encoding proteins involved in transforming growth factor (TGF)-β signaling in the colonic Treg data-set is consistent with this growth factor’s participation in several gut processes (23). Thus, transcriptional control of non-lymphoid-tissue Treg cells appears to be layered, encompassing pan-tissue and tissue-specific elements.
Tissue-associated variability in Treg chromatin accessibility.
It seemed likely that the layered tissue-Treg transcriptional profiles described above were established and/or maintained via progressive, regulated accessibility of genomic control elements. Thus, using ATAC-seq (14,15), we performed genome-wide chromatin-accessibility profiling on tissue-Treg and contemporaneously harvested splenic Treg populations from the same mice. Again, the data were explored as non-lymphoid-tissue:lymphoid-organ fold-changes within the same individuals to avoid issues related to unavoidable variations in mouse physiology or experimental protocol.
First, we examined general features of the chromatin landscapes of non-lymphoid-tissue Treg cells (Fig. 2). After cataloguing each sample’s peaks of sequencing reads, and verifying that there were strong inter-replicate correlations (Fig. S1A), we merged the “high-confidence” peaks for Treg cells derived from the three non-lymphoid tissues and corresponding spleens (see Methods for details), resulting in a total of 75,363 open chromatin regions (OCRs). Comparing the normalized signal intensity in these regions across the various Treg populations confirmed that the biological replicates clustered together, and that all non-lymphoid-tissue-Treg populations separated from their splenic-Treg counterparts (Fig. 2A). Again, muscle-Treg cells were the most closely related to splenic Tregs, and VAT and colon Treg cells were more similar to each other than to muscle Tregs. Consistent with studies on other hematopoietic (24,25) and non-hematopoietic (26) cell-types, OCRs were most common in intergenic regions, transcriptional start sites (TSSs) and introns; and these distributions did not vary much across the different Treg populations (Fig. S1B). Correlation of OCR accessibility across the populations was by far the strongest at TSS regions, with much weaker associations, hence most of the variation, occurring at intergenic and intronic regions (Fig. 2B).
Figure 2. Tissue-associated variation in chromatin accessibility is concentrated at TSS-distal regions.
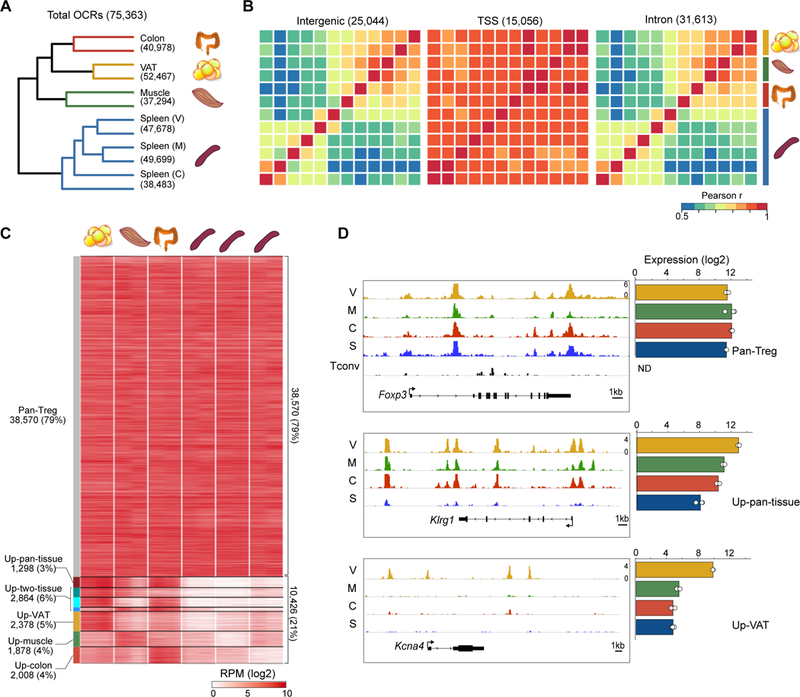
(A) Hierarchical clustering of Tregs by their pair-wise Pearson correlation values for all 75,363 OCRs. (B) Heatmaps of Pearson pair-wise correlation scores for Treg OCRs located within various functional genomic elements. Treg populations were clustered as in A, with the color bar at right demarcating biological replicates. (C) Classification of OCRs. Those OCRs with ATAC signal ≥ 3-fold higher in each non-lymphoid-tissue:splenic Treg pairing were clustered by whether their “up” status was shared across all three, two, or only one non-lymphoid tissue. Pan-Treg OCRs were not differentially accessible in any of the pairings. Heatmap shows the ATAC signal (in reads per million) in different OCR classes. (D) ATAC-seq reads (left) for example genes whose OCR patterns matched their mRNA expression patterns (right) across the Treg subsets. The Tconv track shows minimal accessibility at Foxp3 in non-Treg CD4+ splenic T cells.
To classify the regions of differential chromatin accessibility in a more discriminating manner, we first performed pair-wise comparisons between the three non-lymphoid-tissue:spleen couples, revealing ~10–13,000 differentially accessible regions per tissue (Fig. S1C). As performed above to define non-lymphoid-tissue-Treg gene-sets (Fig. 1B), we segregated OCRs into different classes based on whether their tissue:spleen differential appeared in all non-lymphoid tissues (“pan-tissue”), two of them or only one (“tissue-specific”) (Fig. 2C). An additional class where there was no non-lymphoid-tissue:spleen differential was termed “pan-Treg.” But, as discussed below, it is important to keep in mind that this designation does not mean to imply that the nearby genes are expressed only in Treg cells. Examination of raw ATAC-seq read distributions verified these OCR class designations, and showed that, for some loci, the transcript and accessibility patterns matched. For instance, pan-Treg OCRs constituted the majority of accessible regions around Foxp3, expressed in all Treg, but not Tconv, cells, consistent with its lack of accessibility in Tconv cells (Fig. 2D, top); the preponderance of pan-tissue OCRs corresponded well with the high expression of Klrg1 in non-lymphoid-tissue, but not lymphoid-organ, Tregs; and VAT-specific OCRs mirrored the VAT-specific expression of Kcna4 (Fig. 2D). These data indicate that tissue-associated variation in chromatin accessibility, located primarily at promoter-distal regions, was a property of non-lymphoid-tissue Treg populations.
OCRs shared between non-lymphoid-tissue and lymphoid-organ Treg cells (i.e. “pan-Treg” OCRs) were by far the most common (Fig. 2C). We expected to find them near genes transcribed in a pan-Treg manner, but many were proximal to tissue-restricted genes (a designation henceforth used to encompass both the pan-tissue and tissue-specific gene-sets of non-lymphoid-tissue Tregs, i.e. those loci under-represented in the spleen). Typical examples are Fosl2 and Irf4 (Fig. 3A). This observation suggested that “priming” of the chromatin landscape in splenic Treg cells might be a common feature of loci whose expression was specifically up-regulated in non-lymphoid tissues. Importantly, as the Fosl2 and Irf4 tracings show, primed OCRs were both proximal and distal to TSSs (Fig. 3A). To estimate the degree of such priming, we calculated, for each tissue-restricted gene, the fraction of OCRs ±10kb of its TSS that were accessible in the spleen. For both the pan-tissue and tissue-specific gene-sets, the majority of OCRs for the majority of loci were indeed already open in the spleen (Fig. 3B). Similar results were obtained using windows of ±100kb or 500kb around the TSS (Fig. S2A), indicating that priming was not exclusively a TSS-proximal regulatory feature.
Figure 3. Priming of tissue-restricted genes by widespread open chromatin, super-enhancers and bivalent TSSs.
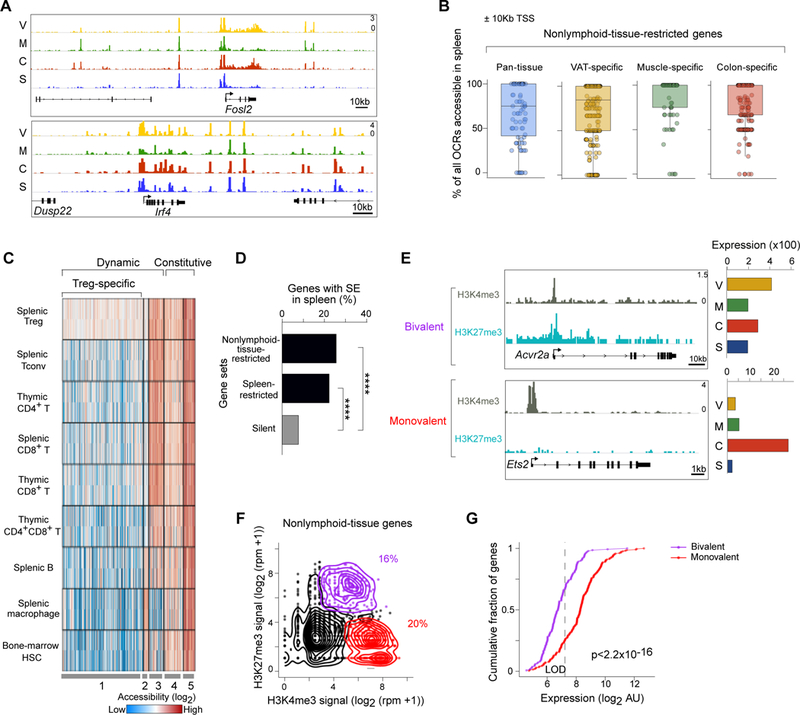
(A) ATAC-seq reads for two tissue-restricted genes with prominent OCRs in the spleen. (B) Quantification of OCR priming in the spleen for tissue-restricted genes. For each pan-tissue or tissue-specific up-regulated gene (dots), all OCRs were identified within 10Kb of its TSS, and the fraction open in the spleen are plotted. See also Figure S2. (C) Heatmap shows accessibility of the top quartile of primed OCRs (~2,100) across T cell, myeloid and progenitor cell types. Data are from the ImmGen ATAC-seq resource. (D) The association of super-enhancers in splenic Tregs with genes whose expression is either spleen- or tissue-restricted, compared with the background association of SEs with silent genes. Binomal test **** p<0.0001. See also Figure S3. (E) Examples of tissue-restricted genes whose TSSs are either mono- or bivalently marked by histone modifications in splenic Tregs. Note the minimal expression of these genes in splenic Tregs (according to microarray data). (F) Histone modifications at the TSSs of tissue-restricted genes in splenic Tregs (n=1,135 genes). For each gene, the levels of H3K4me3 and H3K27me3 within 1Kb of its TSS are shown, derived from re-analysis of published ChIP-seq data (30). Colors represent TSSs passing cutoffs for monovalency (H3K4me3 alone, red), bivalency (H3K4me3 + H3K27me3, purple) or TSSs below both cutoffs (black). (G) Expression differences in splenic Tregs between mono- and bi-valently marked tissue-restricted genes. p-value is from a two-sided K-S test. LOD, level of detection.
Since the ATAC-seq analyses were performed on bulk splenic Treg populations, it is possible that what we have termed priming of OCRs in splenic Treg cells represented ATAC signal from a small population of non-lymphoid-tissue Tregs that re-circulated back to the spleen. However, at least for VAT, trafficking between tissues and the spleen is rare (4). Moreover, even if re-circulation were to occur, we would expect these “contaminating” non-lymphoid-tissue Tregs to comprise a minority of cells in our spleen samples, and would therefore expect the unanticipated ATAC signal at these OCRs to be lower in splenic Tregs than in the tissue-Treg populations. But this was not the case (Fig. S2B).
Hence, most of the loci expressed in a tissue-restricted manner, and thus turned off or down in the lymphoid organs, already had a quite accessible, or “primed,” chromatin landscape in the spleen. We wondered whether the accessibility of these elements extended back through the T-cell lineage, or even beyond it. So we employed the ImmGen ATAC-seq resource (www.immgen.org) to analyze the most strongly primed OCRs (the top quartile based on their accessibility in the spleen) in several immune-cell types. The majority of these OCRs fell into one of three dynamic clusters whose accessibility exhibited variations in at least one hematopoietic lineage, while a minority was universally open across all of the T, B, myeloid and progenitor cell-types examined (Fig. 3C). The largest cluster of dynamic OCRs showed the highest accessibility in splenic Treg cells, decreasing openness within the T lineage, and even less accessibility in more distantly related lineages like macrophages and hematopoietic stem cells. Thus, the priming of non-lymphoid-tissue Treg gene expression did not merely reflect pan-hematopoietic or T-lineage-specifying OCRs, instead showing a high degree of specificity for Treg cells.
Priming was often not focal; rather these OCRs occurred in clusters, encompassing both the TSS and TSS-distal regions [e.g. Irf4, (Fig. 3A)], similar to what has been described for peaks of Mediator occupancy and particular histone modifications at super-enhancers (SEs) in many cell types, including CD4+ T cell subsets (27,28). Given the association between SEs and the expression of cell-fate genes (29), as well as the recent identification of SEs in Treg cells (30), we asked whether this chromatin element might regulate geographic or functional diversification within the Treg lineage. In prelude to evaluating this hypothesis, we determined how well SEs delineated by our ATAC-seq data correlated with those previously defined using the enhancer mark H3K27ac (30), possible because both data-sets issued from splenic Tregs. Whether SEs were defined on the basis of clustered H3K27ac (Fig. S3A) or ATAC (Fig. S3B) peaks, there was a strong correlation between ATAC and H3K27ac signals (respectively) within the delineated stretches.
Using the well-established ROSE algorithm (29, 31), we found 600–1000 SEs in each of the Treg populations (Fig. S3C), yielding a total of 1,698 distinct SEs across them all. Comparison of these SE’s average ATAC signal for non-lymphoid-tissue vs lymphoid-organ Treg cells revealed very few with differential accessibility (at least 2-fold tissue:spleen difference) (Fig. S3D). This strong degree of SE concordance was surprising, but suggested that SEs might contribute to the priming of loci encoding tissue-restricted genes in lymphoid-organ Tregs. Therefore, we calculated the frequency of tissue-restricted genes with an associated SE in splenic Treg cells (±100Kb of the TSS), and compared this value with the frequencies of spleen-specific or silent genes with an associated SE (Fig. 3D). As expected, compared with silent loci, genes expressed in the spleen were strongly associated with an SE; interestingly, non-lymphoid-tissue-restricted genes were nearly as likely as spleen-specific genes to have an associated SE. These analyses yielded parallel results when SE ±10 or 500Kb of the TSS were examined, and when H3K27ac-defined SEs were examined (Fig. S3E).
Given the seemingly transcriptionally permissive state of tissue-restricted genes, we wondered whether additional epigenomic mechanisms layered on top of the open chromatin structure were actively restraining their expression in splenic Treg cells. In embryonic stem cells, the promoters of lineage-restricted genes are primed by the accumulation of “bivalent” histone marks that can both promote and inhibit transcription (H3K4me3 and H3K27me3, respectively), which is thought to facilitate the fine-tuning of gene expression during cell differentiation (32, 33). Compared with monovalent (H3K4me3-marked) genes, bivalent loci are expressed at lower levels in ES cells, and are up- or down-regulated depending on the pathway of differentiation eventually followed (32). Using publically available ChIP-seq data-sets on splenic Treg cells (30), we quantified bivalent histone marks associated with the various gene-sets in splenic Tregs. We found examples of tissue-restricted genes whose promoters were tagged either monovalently with the activating H3K4me3 mark [Ets2 (Fig. 3E)], or bivalently with H3K4me3 and the repressive H3K27me3 mark [Acvr2a (Fig. 3E)]. Quantifying levels of these two histone modifications within 1Kb of the TSSs revealed that most loci had nominal levels of the two tags, similar to those for genes silent in all Treg cells (Fig. 3F, black dots and density lines; and data not shown). For those loci with appreciable occupancy by the modified histones, their TSSs were split between those bivalently and monovalently (H3K4me3 only) marked (Fig. 3F, purple and red, respectively). There was a clear separation between the typical expression level of bivalently vs monovalently marked tissue-restricted genes in splenic Treg cells, the former being significantly reduced (Fig. 3G). Moreover, transcript levels for the majority of bivalently marked genes were below, or only slightly above, the limit of detection, suggesting that these genes included those that would be turned on in response to tissue-derived signals, and were perhaps kept nominally transcribed in splenic Tregs by the presence of H3K27me3 and the transcriptional silencing machinery that it recruits.
Predominant enrichment of a small, shared set of transcription factor family motifs in tissue-restricted open chromatin regions.
Having catalogued OCRs near loci co-regulated in Treg cells, we interrogated their DNA sequences for TF-family motifs. A search of the pan-tissue OCRs within 100Kb of the TSSs of the ~100 genes up-regulated in all three non-lymphoid tissues revealed repeated enrichment of the motifs for a small number of TF families, including those for RFX, bZIP, nuclear receptors and ETS (Fig. 4A). bZIP motifs were present along the highest proportion of loci (34%) and in the most instances per gene (mean = 3.5) (Fig. 4B), suggesting that one or more members of this family might be major drivers of the shared tissue-Treg gene-expression signature. The short length (7 nucleotides) of the bZIP motif is unlikely to account for this pattern, since equally short or even shorter sequences (like those bound by ETS, RUNX or GATA family members) were not enriched to the same extent. Overlaying the genomic locations of the motifs most highly represented amongst the pan-tissue gene-set (i.e. the bZIP, RUNT and GATA motifs) revealed, in all three cases, broad peaks at ~10kb from the TSS, hinting that they might work together in cis (Fig. 4C). Indeed, scanning OCRs linked to the pan-tissue gene-set for motifs representing each TF family, and clustering genes by their TF-family profiles revealed that most loci were linked to more than one TF family (Fig. 4D). Interestingly, the motifs of certain families showed preferential co-enrichments, e.g. RFX commonly with RUNT and bZIP, and NR with ETS (Fig. 4D).
Figure 4. A limited number of TF-family motifs are associated with tissue-restricted gene signatures in Tregs.
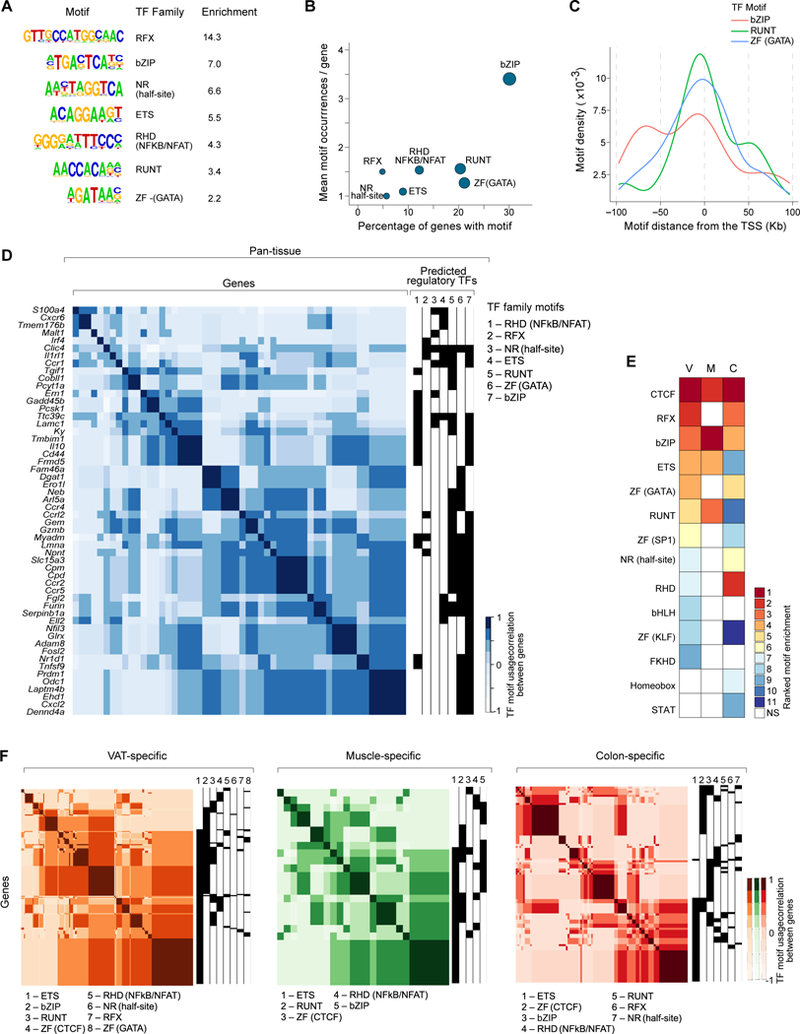
(A) TF family motifs enriched in OCRs within 100kb of the TSS of genes up-regulated in Tregs from all three non-lymphoid tissues. Enrichment represents the fold-change in frequency of the motif in these OCRs vs. control regions and only significantly enriched motifs (p < 0.01) are shown. (B) The percentage of pan-tissue genes containing ≥ 1 instance of each motif within 100kb of its TSS (x-axis) vs. the average number of motif occurrences per gene (y-axis). (C) The positions of bZIP, RUNT, and GATA motifs are shown for the set of pan-tissue OCRs found within 100Kb of pan-tissue-genes. (D) Clustering of pan-tissue genes based on their ATAC-predicted regulatory TF families. TF motifs were linked to each gene based on their presence in an OCR assigned to that gene. Each gene then received a 0 or 1 score for each of the seven TF families shown, and genes were then clustered according to their pair-wise correlation scores. (E) TF-family motifs significantly enriched in OCRs within 100kb of the TSSs of each set of tissue-specific up-regulated genes. Enrichment values within each set are ranked to allow comparison across subsets. (F) As in panel D, except tissue-specific genes were clustered.
A similar analysis using the three sets of tissue-specific Treg OCRs and genes implicated a few additional TF families not enriched in pan-tissue OCRs, most prominently CTCF, whose binding site was among the three most highly enriched motifs for each of the tissue-Treg populations (Fig. 4E). The over-represented CTCF-family motif is bound by only two members: CTCF, itself, and BORIS, a related protein expressed almost exclusively in germ cells (34). Therefore, it is likely that CTCF plays a common role in establishing and/or maintaining tissue-specific OCR landscapes in non-lymphoid-tissue Tregs. To assess the association of highly ranked TFs with tissue-specific loci, we again used the chromatin-accessibility data to construct predicted TF-family:target-gene modules for each tissue (Fig. 4F). Given the far greater number of tissue-specific genes for VAT and colon Treg cells, modules for these tissues were much more robust than those for muscle. In contrast to pan-tissue loci, distinct clusters of VAT- or colon-specific genes were associated with a single TF family, most prominently ETS, bZIP or CTCF.
Representation of tissue-Treg gene-sets in single cells.
For many of the TF families highlighted above, there is a great degree of overlap between the DNA motifs recognized by individual family members (e.g. ETS1 and ETS2; (35)), preventing a rigorous delineation of tissue-specific roles for individual TFs based solely on enrichment of their predicted binding sites within ATAC-seq peaks. Unfortunately, the number of cells available per mouse (usually a few thousand) precludes obtaining robust TF ChIP-seq data for most non-lymphoid tissues. Rather, we reasoned that exploiting scRNA-seq data, correlating expression of individual TF-family members with their predicted target genes in thousands of individual cells, could: first, verify (or not) the regulatory modules predicted by ATAC-seq; second, refine these modules into networks of individual TF-family members and their predicted target genes, and third, determine whether, and to what extent, different members of the same TF family were deployed to drive Treg specialization within tissues.
Therefore, we sorted Treg cells from VAT, skeletal muscle (4 days post-injury) and the colonic lamina propria plus, as controls, splenic Treg and Tconv cells from the same mice, with independent duplicates for each population. Single cells were encapsulated in microfluidic droplets following the inDrops protocol (17). In total, we analyzed 7,455 individual Treg cells. On average, 1,885 unique mRNA molecules transcribed from 759 different genes were sequenced per cell, effectively covering the Treg transcriptome space of 17,841 genes (Fig. S4A). We first displayed the data as a t-SNE (t-distributed Stochastic Neighbor Embedding) plot, which permits dimensionality reduction (Fig. 5A). No major batch effects were observed as the data from the various spleen controls substantially overlapped, as did the duplicate data from the various tissues (Fig. S4B). The cells from each of the three non-lymphoid tissues clustered together on the t-SNE plot, and separately from splenic Treg and Tconv cells. There was very little overlap between the tissues, and no cell clusters that included participants from all three tissues were observed. The spleen hosted a small number of cells that appeared to “reach into” the muscle or colon, but not VAT, Treg-cell space, and vice versa. This finding matches previous observations that muscle (8), but very rarely VAT (4), Tregs exchange with the circulating pool. Foxp3 was expressed throughout the Treg populations but not in Tconv cells, as expected (Fig. 5B). Various TFs have been reported to drive transcriptomic diversification of particular Treg populations. Accordingly, we found Pparg to be expressed predominantly in VAT Treg cells (5); Tbx21 in a subset of muscle and colonic Tregs (36, 37); Ikzf2 and Rorc in distinct subpopulations of colonic Tregs (as well as in Tregs in other tissues) (9, 11); and Cxcr5, a marker of T follicular regulatory cells (38, 39), predominantly in splenic and colonic Treg cells.
Figure 5. scRNA-seq analysis of tissue-Tregs.
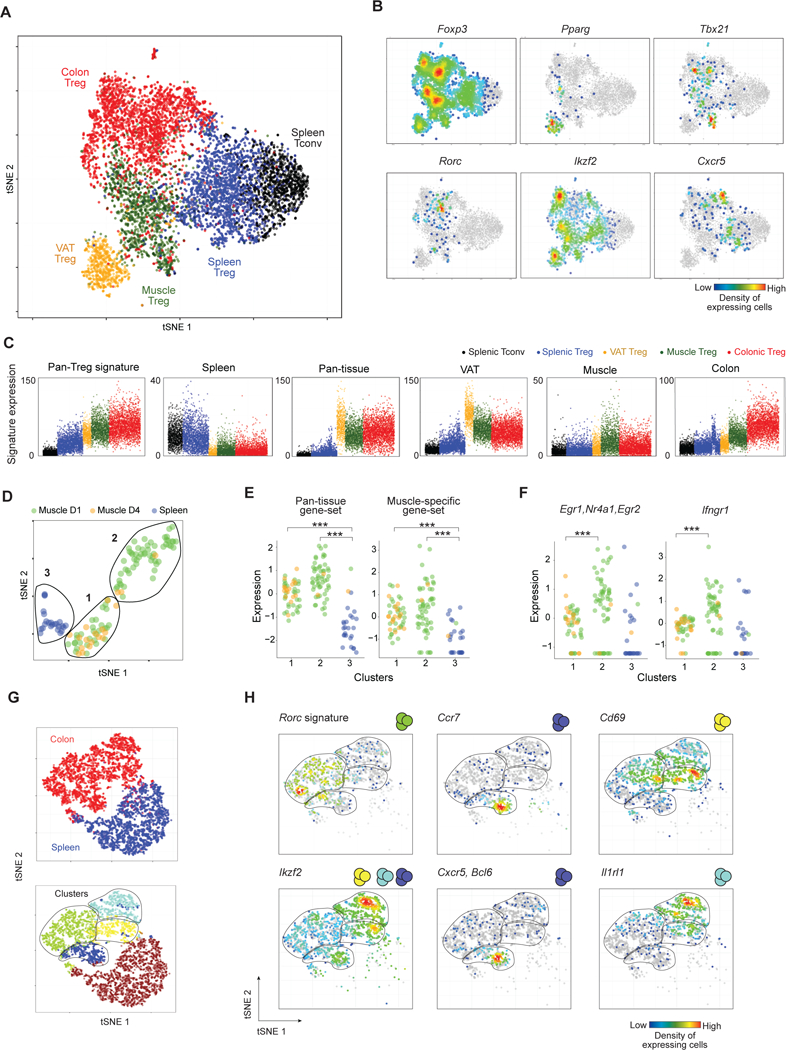
(A) tSNE plot of the tissue and splenic Tregs single-cell datasets (n = 7455 cells). (B) Same tSNE plots as in A, highlighting cells expressing characteristic Treg TFs or sub-population markers: Pparg (VAT Tregs), Rorc (colonic pTregs), Ikzf2 (tTregs), Tbx21 (Tregs in a Th1 milieu), Cxcr5 (follicular Tregs). Coloring signifies the density of expressing cells. (C) Single-cell expression of the indicated gene-sets, as per Fig. 1 (Z-score). Pan-Treg signature from Hill et all (40). The spleen signature is the pan-tissue down signature (per Fig. 1). (D) tSNE plot of the CelSeq data-sets of spleen and muscle Tregs 1 (D1) and 4 days (D4) after injury. Lines delimit cell clusters 1–3 identified by k-means. (E) Single-cell expression of the pan-tissue and muscle-specific gene-sets in splenic (blue) and muscle Tregs isolated at day 1 (green) and 4 (yellow) post-injury (Z-score). p<0.001, by two-tailed t-test. (F) As in panel E, except expression of early TCR-induced genes (Nr4a1, Egr1, Egr2) (left) or the Ifgnr1 gene (right) ***, p<0.001. Colors relate to the indicated gene-sets. See also Figure S4. (G) tSNE plot of colonic and splenic Treg single-cell transcriptomes. Top: colonic (red) and splenic (blue) Tregs. Bottom: Colors and lines delimit cell clusters identified by k-means. (H) Same tSNE plot as in G showing the density of cells expressing specific markers separating the different colonic clusters: Ikzf2, Ccr7, Cxcr5/Bcl6, Cd69, Il1rl1 and the Rorc signature.
Deconvolution of the gene-expression clusters delineated in Fig. 1B at the single-cell level maintained the distinctions originally observed at the population level, although less sharply, likely due to the reduced sensitivity of scRNA-seq (Fig. S4C). The expression of each signature was mostly bimodal across the different populations (Fig. 5C). For example, the pan-Treg signature was upregulated in all Tregs in comparison with splenic Tconv cells. This signature was more highly represented in non-lymphoid-tissue- than splenic Tregs, consistent with the fact that the pan-Treg gene-set includes loci related to Treg activation (40) and that non-lymphoid-tissue Tregs tend to have an activated phenotype compared with lymphoid-organ Tregs (3, 7, 9). Similarly, the pan-tissue signature was only weakly expressed in the spleen, with very few cells achieving the highly elevated expression levels typical of tissue-Tregs; those rare cells probably correspond to the few splenic Treg cells invading the tissue-Treg space in Fig. 5A. VAT Tregs were the most distinct population, with higher expression of the pan-tissue signature and a highly differential VAT-specific signature. Muscle Tregs, on the other hand, expressed the pan-tissue gene-set at the lowest level and had only the weakest tissue-specific signal.
Surmising that the fainter distinction of the muscle-Treg population might reflect a more heterogeneous conglomeration of evolving subpopulations, as might be expected with an acute-injury context, we obtained additional single-cell data using the CelSeq platform (41), which tends to yield more transcripts per cell but on fewer cells. The Treg response to injury was indeed dynamic. At day 1, muscle Treg cells formed two clusters (Fig. 5D), both significantly enriched (vis-à-vis the spleen) in expression of the pan-tissue and muscle-Treg gene-sets (Fig. 5E). The cells of cluster 2 expressed more genes related to TCR stimulation (e.g. Nr4a1, Egr1, Egr2) and the IFNγ response (Ifngr1) than did the cluster 1 constituents (Fig. 5F). At day 4, muscle Tregs were more homogeneous, almost exclusively composed of cluster 1 cells.
Previous studies have documented substantial phenotypic and functional diversity within the colonic Treg population, most notably between the tTreg and pTreg subpopulations (9–11). Because a recent scRNA-seq study (42) failed to confirm this heterogeneity while, as described above, our all-tissues t-SNE plots (Fig. 5A,B) uncovered what appeared to be distinct colonic Treg subsets, we carefully re-examined this issue. Unsupervised clustering of just the colonic and control splenic Treg single-cell data delineated four robust cell clusters (Fig. 5G). The first level of heterogeneity distinguished pTreg cells expressing Rorc transcripts (green cluster) from tTreg cells transcribing Ikzf2 (blue, yellow and turquoise clusters) (Fig. 5H, left panels). Amongst the tTregs, one subset was probably made up of cells circulating through or residing in mucosal lymphoid structures as they preferentially expressed Ccr7, Cxcr5 and Bcl6 transcripts (Fig. 5H, middle). The other two tTreg subsets were distinguished by differential expression of a transcriptional program promoting tissue repair (Il1rl1, Areg, Penk, etc.) (Fig. 5H, right).
A Tissue-Treg transcriptional network: how to achieve specificity with common TF binding motifs.
Having validated the scRNA-seq data, we integrated it with the ATAC-seq results to identify individual TF-family members most likely to drive tissue-restricted gene expression in non-lymphoid-tissue Treg cells, ultimately resulting in a TF:target-gene regulatory network. Some previous studies have attempted to integrate profiles of chromatin accessibility and gene expression to yield insights into mechanisms of transcriptional regulation (43). However, these efforts relied on population-level RNA-seq data, which would have very limited value in uncovering meaningful gene:gene correlations in our case as it would be based on only 4 data-sets (spleen, VAT, muscle and colon). scRNA-seq should greatly increase the power of the analysis as it would entail evaluation of gene co-expressions across thousands of individual cells (44, 45). First, we identified particular TF-family members differentially expressed in tissue-Tregs compared with their splenic counterparts (FDR < 2.5%). Then, in order to determine whether the putative controlling factors could be functional, we calculated the co-variation in expression between a TF and its putative targets. Thus, our predicted regulatory modules (Fig. 4D, F) were refined by including a score that aggregated a TF’s motif in an OCR, its putative target genes, and to what extent expression of the TF and its target genes co-varied in individual cells (Fig. 6A for schema; Fig. S5A–C).
Figure 6. Architecture of the tissue-Treg transcriptional network.
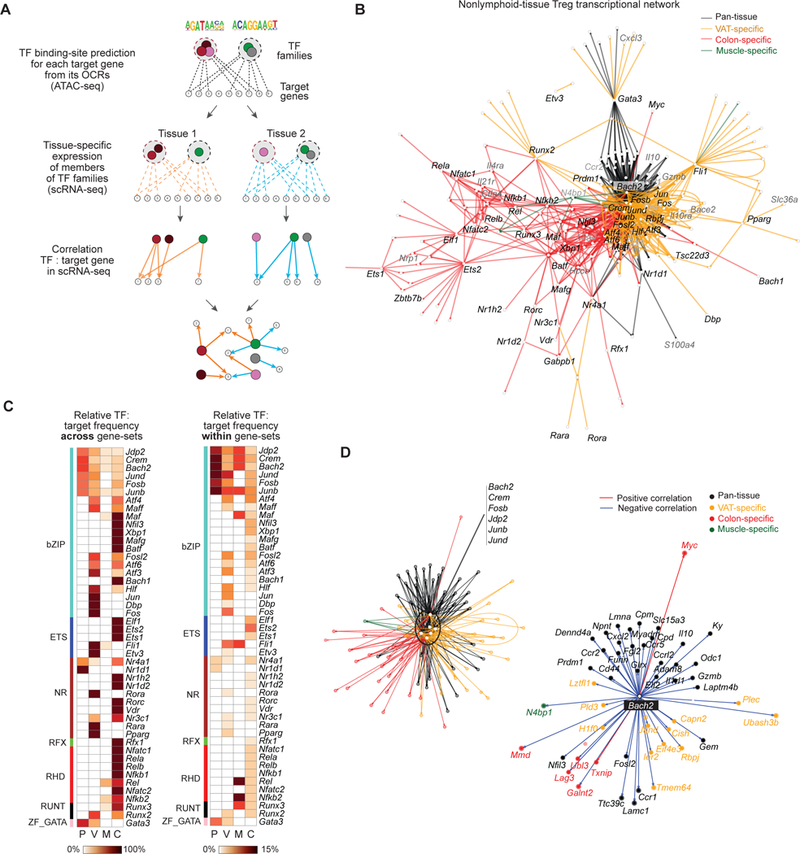
(A) A schematic of network construction, integrating ATAC-seq and scRNA-seq data. First, TF families are linked to target genes when their binding site is enriched in the associated OCRs (see ATAC-seq correlation heatmaps in Fig. 4D, F). The network is then refined i) by identifying TF members within each family that are expressed in each tissue (using scRNA-seq) and ii) by keeping connections with significant correlations between the TFs and target genes in the scRNA-seq data. (B) Directed graph of the tissue-Treg transcriptional network. Each node represents a gene. A directed edge connects a TF and its target-gene if the target has the TF family’s motif in an associated OCR (ATAC-seq) and if their expression is correlated in the scRNA-seq data. Node and edge colors reflect the gene-set to which the target-gene belongs. Gene names are those of key TFs (black) and target genes (grey) in the network. (C) TF: target gene correlations. Left: The percentage of target genes that are linked to each TF (rows) falling in the four gene sets (columns: Pan-tissue, VAT, Muscle and Colon). Row values sum to one. Right: The percentage of genes in each set (columns) linked to each TF (rows). Columns sum to one. (D) Network blow-ups. Left: Central hub in the tissue-Treg network. Subgraph of B with the ubiquitous TFs and their connection to pan-tissue and tissue-specific target-genes. Edge color as in B. Right: Subgraph of D with Bach2 and its connections to pan-tissue and tissue-specific target-genes. Node colors relate to the gene-sets and edge colors to positive (red) or negative (blue) correlations with Bach2. See also Figures S5.
The overall TF network issuing from these analyses is represented in Fig. 6B, while Fig. 6C illustrates the relative target-gene frequencies across and within the various gene-sets. Robustness and significance of the network were assessed by randomization of the single-cell data (shuffling expression levels per gene between cells). 1000 random permutations of the data failed to engender comparable network connectivity (for example, Fig. S5D for the VAT-specific modules). We identified 730 connections between TFs and their target genes, well above the 18 expected links by chance alone with an FDR of 2.5% (Fig. S5D). Immediately evident was that the different TF families seemed to have variable importance in regulating expression of the different gene-sets. Pan-tissue Treg genes were connected to loci encoding the AP-1 subfamily of bZIP TFs (Bach2/Crem/Fosb/Jdp2/Junb/Jund) as well as to Nr1d1 and Nr4a1, which encode nuclear receptors, and to Gata3. VAT- and colon-specific Treg loci had the strongest links to loci encoding bZIP, ETS and nuclear receptor family members, while muscle-specific genes were connected above all to Nfkb2 and Rel, specifying members of the RHD family. At a first level, tissue-restricted transcription was mediated by tissue-specific expression of TFs, as represented in the peripheral nodes of the network (Fig. 6B). For each TF family highlighted in the ATAC-seq analyses, different members were expressed in the different tissues, which correlated with tissue-specific expression of their gene-targets (Fig. 6C). For example, within the nuclear receptor family, Pparg [as expected (5)], Rara and Rora were specifically associated with VAT-specific genes, while Rorc [as expected (9, 11)], Vdr, and several others were linked specifically to colon-specific genes. Within the ETS family, Fli1 and Etv3 partitioned to VAT-specific and Ets1, Ets2 and Elf1 to colon-specific loci. The bZIP and RFX families showed similar examples of partitioning.
At a second level, and in an apparent paradox, tissue-specific transcription was also regulated by broadly expressed TFs. In a dense sub-network at the center of the tissue-Treg network, genes encoding several members of the AP-1 subfamily (Bach2, Crem, Fosb, Jdp2, Junb, Jund) were connected to numerous pan-tissue and tissue-specific loci (Fig. 6C and D, left). BACH2 was special in the sense that it was the only TF whose gene expression correlated negatively with its gene targets (Fig. 6D, right panel). To understand how tissue-specific transcription can result from regulation by broadly expressed TFs, we delved further into tissue-Treg network architecture, focusing on three-node motif representation (non-random sub-networks of three vertices) in the VAT sub-network. Single-Input Motifs (SIMs) and Multiple-Input Motifs (MIMs) were very frequent (Fig 7A), as previously reported for biological networks (46). SIMs and MIMs highlight the fact that most TFs regulated many different gene targets and, reciprocally, most genes were regulated by multiple factors, allowing coordinate gene regulation. But, more importantly, we also found frequent feed-forward loops (Fig 7B). In the first layer of these loops, loci encoding ubiquitous TFs (Jdp2, Junb, Jund) were connected to tissue-specific gene targets but also to loci encoding tissue-specific TFs (Fli1, Fosb, Maff, etc.) that regulated the same set of gene-targets. For example, the loci encoding certain broadly expressed TFs (Jdp2/Jund/Junb) connected to Fli1 to regulate VAT-specific targets like Il10ra and Cish (and others) (represented in red). On the other hand, across all tissues, transcription of the pan-tissue gene-set connected, unsurprisingly, almost exclusively to the ubiquitously expressed AP-1 sub-family of TFs (GATA3 being the exception) and, overall, were more multi-connected than were the tissue-specific Treg genes (Fig 7C).
Figure 7. VAT-Treg transcriptional network connectivity.
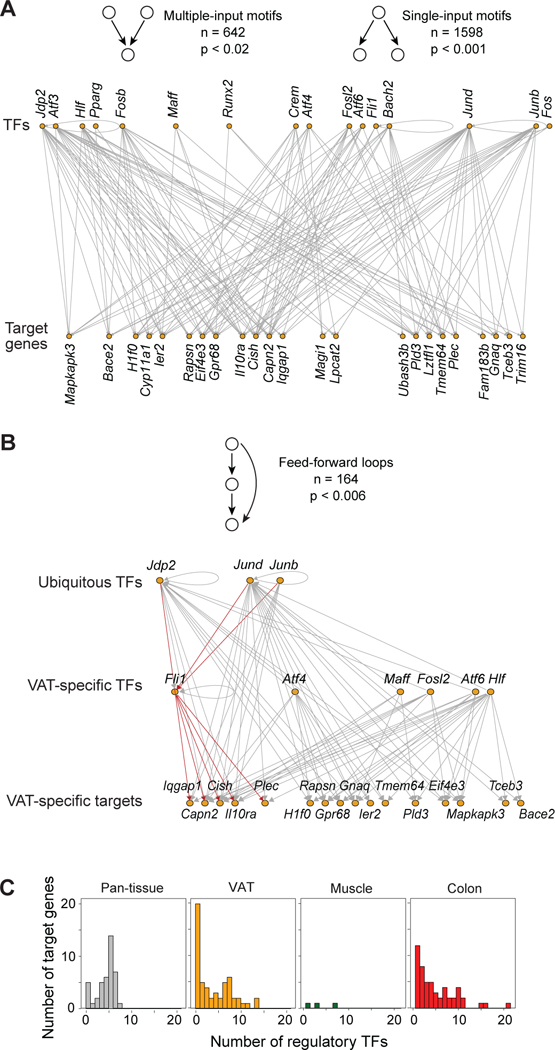
(A) Single- and multiple-input motif instances in the VAT-Treg subnetwork from Fig. 6B. Top and bottom rows represent TFs and gene-targets, respectively. Schematics of the motif types on top, with the number of instances and p-values for enrichment (null distribution based on 1000 degree-preserving randomizations, see Supplementary Methods). (B) Feed-forward loop instances that include the ubiquitous TFs in the VAT-Treg subnetwork from Fig. 6B. Top, middle and bottom rows represent the ubiquitous TFs, VAT-specific TFs, and target-genes, respectively. Red lines are particular examples discussed in the text. Schematics of the motif-types on top, with the number of instances and p-values for enrichment. (C) Distribution of the number of connected TFs in each gene-set.
Validation of transcription factors underpinning tissue-restricted and tissue-specific network nodes
As detailed above, the transcriptional network we constructed was bionformatically robust; however, experimental validation was also imperative. To that end, we focused on two predicted network nodes, one entailing the sets of genes preferentially expressed in all of the non-lymphoid tissues, and a second anticipated to have a tissue-specific impact. BACH2 was an interesting candidate as a broad regulator of transcription in non-lymphoid tissues because it is a repressor known to be present in lymphoid-organ Treg cells (47). In our network, Bach2 expression was highly anti-correlated with transcription of tissue-restricted Treg genes, whether pan-tissue or tissue-specific (Fig. 6D). And it was the only bZIP family member whose expression decreased rather than increased (or stayed constant) in tissue-Tregs vis-à-vis their splenic counterparts (Fig. 8A). Thus, we predicted that BACH2 would bind to (and repress) tissue-restricted genes in lymphoid-organ Tregs, and that its expression must be extinguished in tissue-Tregs for their signature genes to be turned on. We re-analyzed published BACH2 ChIP-seq data on Treg cells generated in vitro from precursors in lymphoid organs (47), which revealed that BACH2’s average occupancy on both pan-tissue and tissue-specific genes was higher than its occupancy on control loci (Fig. 8B). This increased BACH2 signal did not merely reflect strong binding at a few genes, as it bound to the promoters of 30–50% of the tissue-restricted Treg gene-sets in the in vitro-generated Tregs (Fig. 8C). Thus, the inverse correlation between levels of BACH2 binding and expression of tissue-restricted Treg genes was likely to be a direct effect of its repressive activity at these loci in lymphoid-organ Treg cells, consistent with a previous report that it can repress the expression of T helper cell signature genes in Tregs (47).
Figure 8. Validation of tissue-Treg TF networks.
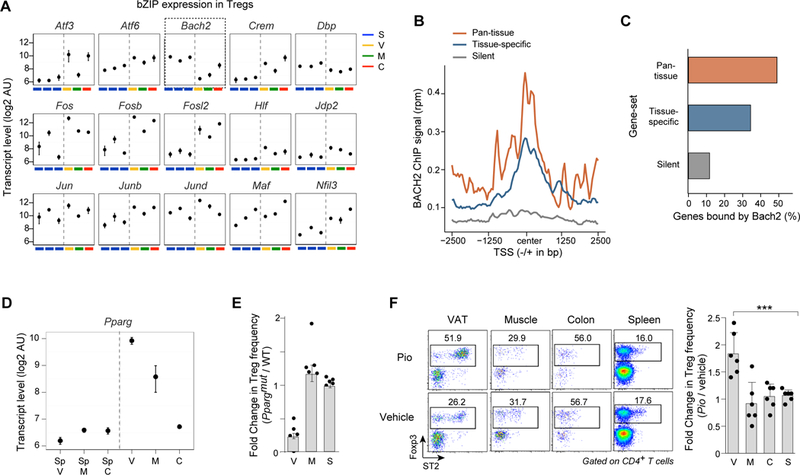
(A) Expression of bZIP family TFs across splenic and non-lymphoid-tissue-Treg subsets. Arbitrary Units represent transcript levels from microarray data. (B) Average genomic occupancy of BACH2 in spleen-derived induced Treg cells at TSSs of genes up-regulated in all three tissue-Treg subsets (pan-tissue), only one of them (tissue-specific VAT, muscle and colon, combined into a single list for this analysis), or a control set of genes not expressed in Tregs. Raw ChIP-seq data from GEO GSE45975, were re-analyzed for this study (see Methods). (C) Percentage of genes in each set that have a BACH2 peak within 10Kb of their TSS. (D) Expression of Pparg across Treg subsets, as in panel A. (E) Effects of Treg-specific PPARγ-deletion on Treg accumulation in skeletal muscle on day four following cardiotoxin injury (the peak of Treg accumulation). Data are represented as the fold-change in the Treg frequency of each PPARgmut mouse vs. the average frequency in wild-type mice in muscle (M) or spleen (S), within each experiment. n = 3 – 5 mice per group from three experiments. (F) Left: Frequencies of Foxp3+ Tregs in various tissues following a 10-day treatment with 10mg/kg pioglitazone. Dot plots are representative of n = 2–3 mice per group from two experiments. Right: Effects of pioglitazone on each Treg subset measured as fold-change in the Treg frequency of each pioglitazone-treated mouse vs. the average frequency from vehicle-treated mice within each experiment. n = 2–3 mice per group from two experiments. V = VAT, M = muscle, C = colon, S = spleen.
As a predicted regulator of tissue-specific gene expression in Treg cells, we revisited the role of PPARγ, a nuclear receptor family member required for the accumulation and function of bona-fide VAT Tregs (5). Our network predicted functionality of PPARγ exclusively in VAT Tregs, although its expression was also strongly up-regulated in skeletal-muscle vis-à-vis lymphoid-organ Tregs (Fig 8D). First, we examined mice that carry a Treg-specific knock-out of Pparg and, consequently, have a dearth of VAT Tregs (5). Examination of the Treg populations in muscle and spleen four days after injuring muscle of mutant mice and their wild-type littermates with cardiotoxin revealed no significant effect on the accumulation of muscle Tregs in the mutants (Fig. 8E). Second, we treated standard B6 mice with the PPARγ agonist, pioglitazone coincident with cardiotoxin-induced skeletal-muscle injury. As expected (5), pioglitazone robustly induced the Treg population in VAT, but did not change Treg frequencies in the muscle, colon or spleen (Fig. 8F).
DISCUSSION
Integrating accessible-chromatin and single-cell transcriptome profiling, we explored the regulatory underpinnings of Treg diversity in non-lymphoid tissues. At both the chromatin and transcription levels, adaptation of Treg cells to VAT, muscle or the colon was achieved by a combination of tissue-shared and tissue-specific modulations. However, the picture that emerged was not simply dichotomous. For the tissue-restricted gene-set (both pan-tissue and tissue-specific), chromatin accessibility and gene-expression patterns often did not match, with many OCRs already accessible in the spleen, suggesting some priming event before transiting of Treg cells from lymphoid to non-lymphoid organs. A disconnect between chromatin accessibility and transcript abundance has many parallels in other settings, including tissue adaptation. For example, macrophages from multiple non-lymphoid tissues share a set of common, epigenomically permissive enhancers that are selectively active in distinct tissues, correlating with tissue-specific gene expression (48, 49). In non-lymphoid-tissue Tregs, this feature may permit or even promote rapid changes in gene expression, given that the dynamics of their differentiation within tissues can be quite rapid: a day after injury, muscle Treg cells were clearly distinct from splenic Tregs by scRNA-seq, and at day four, the muscle Treg sub-population structure had already been remodeled.
What tissue-adaptive properties are conferred by priming loci as opposed to more immediate epigenomic and transcriptional changes in response to signals received locally? We speculate that, from the perspective of modulating Treg cell function, tissue-derived signals are likely to be non-specific, i.e. they evolved to facilitate proper functioning of a heterogeneous mix of cell-types, not Tregs in particular. Therefore, making tissue adaptation reliant on local signals alone may activate (or repress) gene-regulatory elements whose function is either not compatible with Treg-specific signals (such as those derived from the TCR or cytokine receptors), or is destabilizing to the suppressive phenotype. In contrast, by relying on a priming event within lymphoid organs, the effects of local stimuli on Treg cells, including modulation of TF and co-regulator expression or activity, could be constrained and directed to non-deleterious genomic sites.
Harnessing the natural variation in gene expression among thousands of single cells allowed us to build pan-tissue and tissue-specific regulatory networks for non-lymphoid-tissue Treg cells. Our data suggest that the expression (and likely activity) of individual members of a restricted number of TF families was modulated to facilitate context-specific transcription. For instance, within the ETS family, the loci encoding ETS1, ETS2, and ELF1 were linked to colon-specific gene expression while the Fli1 and Etv3 loci were linked to VAT-specific transcription. The tissue-Treg network we constructed was bioinformatically robust.
Two key nodes – one pan-tissue, the other tissue-specific – were experimentally validated. In addition, several published findings provide anecdotal support (9, 11, 50, 51). In brief, our findings argue for the following model of tissue-Treg diversification: Transcriptional programs must be established in non-lymphoid-tissue Tregs within the constraints of an epigenome that maintains Treg identity while allowing tissue adaptation for optimum installation and function. To that end, the chromatin structure of Treg cells in lymphoid organs is primed, through the establishment of pan-Treg OCRs, to license the rapid transcriptional turn-on or up-regulation of most tissue-specific genes. The primed stretches may facilitate remodeling of additional regulatory elements, e.g. pan-tissue or tissue-specific OCRs, by cues received once the cell arrives at a particular non-lymphoid site. TFs belonging predominantly to a limited set of families act on these tissue-restricted regulatory elements and cooperate to regulate tissue-Treg genes via two main organizational modules. The first specifies a common “tissue” phenotype (including circadian and metabolic genes, among others) and is largely under the control of bZIP-family TFs, particularly members of the AP-1 subfamily. These primary TFs are expressed in all non-lymphoid-tissue Tregs, but facilitate activation of secondary, tissue-specific modules via induction of distinct TFs (such as members of the ETS, nuclear receptor or RUNX families) in each tissue. Primary and secondary TFs are integrated into feed-forward loops because both can activate tissue-specific target genes.
MATERIALS AND METHODS
Study Design
We double-sorted 10–20,000 Tregs from visceral adipose tissue, skeletal muscle, and colonic lamina propria (pooled from several mice), and corresponding lymphoid-organ Tregs. Microarray studies were done as biological triplicates, ATAC-seq as duplicates, and scRNA-seq (inDrops) as duplicates (n = 7,955 cells).
Mice
Male C57BL/6J mice, 25 weeks old (VAT) or 8–10 weeks old (muscle and colon), were purchased from Jackson Laboratory. B6.Foxp3Ires-Gfp (52), B6.Foxp3Yfp-Cre (53), and B6.Ppargfl/fl (54) mice were bred in our specific-pathogen-free facility at Harvard Medical School’s Center for Animal Resources and Comparative Medicine (Institutional Animal Care and Use Committee protocol IS00001257). Mutant Pparg Treg mice (Treg-Ppargmut) were generated as in (5), with male littermate-matched experimental and control mice used for all experiments.
Treatments
Anesthetized mice were injected with 0.03 mL/muscle of Naja mossambica mossambica cardiotoxin (0.03mg/mL) (Sigma) in all hind-limb muscles. Male B6 mice received intraperitoneal injections of 10 mg/kg pioglitazone (Cayman Chemical) or DMSO once per day for 10 consecutive days.
Isolation of Treg populations
Single-cell suspensions were obtained from VAT, skeletal muscle and colonic lamina propria (see SI Methods). During each harvest, spleens were isolated from the same mouse and processed identically. Single-cell suspensions were stained in flow cytometry buffer (2% FBS, 1mM EDTA in DMEM) at 4oC for 30 min as detailed in SI Methods.
Microarray analyses
The microarray data have been published (5, 7, 9) and are accessible on Gene Expression Omnibus (See Data Availability). Genes differentially expressed between each non-lymphoid tissue-Treg population and its splenic counterpart were defined as having an expression value ≥100 in at least one tissue, a fold-change > 2 or <0.5 and a p-value < 0.05. 1,909 genes were differentially expressed in at least one tissue (1,883 with a false-discovery rate (FDR) < 10%). Additional details are in SI Methods.
ATAC-seq
ATAC-seq reads from two biological replicates per sample were filtered for quality [sickle, default settings for paired-end reads; see (55), adapter-trimmed (cutadapt –e 0.1 –m 20)], and mapped to the mouse genome (mm9) using Bowtie v2.2.4 (56), keeping only mate pairs that mapped to a single best location using samtools v1.3 (57), and were non-duplicates using Picard v1.130 (http://broadinstitute.github.io/picard). OCRs were identified by HOMER v4.6 using findPeaks –style dnase (58), FDR of 0.001. Only OCRs occurring in both replicates were used in further analyses. PCA, cumulative frequency distributions, generation of OCR class and SE heat-maps as well as all statistical tests, were performed in R (v3.2.1). Additional details are in SI Methods.
scRNA-seq
scRNA-seq was performed following the inDrops protocol (17, 18). PolyA+ mRNAs from thousands of single cells are sequenced rapidly (<30 min) and efficiently (>70–80% of input cells). Besides unique single-cell barcodes, Unique Molecular Identifiers (UMI) were added to minimize noise introduced during amplification. Only the 3’ ends are sequenced, keeping strand information. The sequencing data were processed as described (18). Reads were mapped against the mouse mm10 transcriptome (complemented with sequences of the Foxp3Cd90.1 or Foxp3Ires-Gfp transgenes) using tophat2 (59), and filtered to retain reads with unique molecular barcodes and mapping to unique genomic regions. Further details are in SI Methods.
ChIP-seq
Fastq files representing splenic Treg H3K27ac ChIP-seq were re-analyzed from the DNA Data Bank of Japan (DRA003955). Reads were processed and aligned to mm9 as for ATAC-seq, except software options were changed from paired-end to single-read. Peaks were called by HOMER v4.6 using findPeaks –style histone (58), with an FDR of 0.001. H3K27ac peaks were used to identify super-enhancers using the ROSE algorithm (29). Fastq files representing spleen-derived iTreg cell BACH2 ChIP-seq were from NCBI GEO (GSE45975) and processed for the H3K27ac data. Peaks were called by HOMER v4.6 using findPeaks –style factor, with an FDR of 0.001. Further details are in SI Methods.
Statistical analyses
Significance was assessed by Student’s t-test, the binomial test, Wilcoxon rank-sum test, Kolmogorov-Smirnov test, or null distributions, as specified in individual figure legends and methods sections.
Supplementary Material
Fig. S1. ATAC-seq general features
Fig. S2. Priming of OCRs at tissue-restricted genes in splenic Tregs also occurs at TSS-distal regions and is not composed of weak OCRs.
Fig. S3. Generation and analysis of ATAC-seq-derived super-enhancers across Treg subsets.
Fig. S4. Tissue-Treg scRNA-seq data-set validation
Fig. S5. Pan-tissue and tissue-specific Treg modules identified by combining ATAC-seq and scRNA-seq data
Supplementary Materials and Methods
Table S1. Tissue-Treg gene sets
Table S2. Edge list of the tissue-Treg transcriptional network
Acknowledgements:
We thank Drs. E. Sefik and M. Panduro for help with tissue preparations, and K. Hattori, G. Buruzula, C. Araneo, K. Waraska, M. Thorsen, and R. Steen for help with mice, profiling, sorting, and sequencing.
Funding:
This work was supported by NIH grants DK092541, AR070334 and AI125603, and funds from the JPB Foundation. JRD, DZ, JC and DR were supported by fellowships from the American Diabetes Association (1–16-PDF-028), Boehringer Ingelheim Fonds, the National Research Foundation of the Ministry of Science, Information, Communication and Technology of South Korea, and by a Damon Runyon Fellowship.
Footnotes
Competing interests:
the authors declare that they have no competing interests.
Data and materials availability:
Microarrays [GSM1214187–92 (muscle Tregs and control spleen Tregs); GSM1660958–60 (colonic Tregs), GSM1660962–64 (control splenic Tregs); GSM921176–78 (VAT Tregs), GSM921188–90 (control LN Tregs)] ChIP-seq [GSM1120740 and GSM1120741 (spleen Treg BACH2 ChIP and input); DRR061061 and DRR061062 (spleen Treg H3K27ac)] scRNA-seq [GSE109742] ATAC-seq [GSE112731]
REFERENCES
- 1.Plitas G, Rudensky AY, Regulatory T Cells: Differentiation and Function. Cancer Immunol Res 4, 721–725 (2016). [DOI] [PMC free article] [PubMed] [Google Scholar]
- 2.Panduro M, Benoist C, Mathis D, Tissue Tregs. Annu. Rev Immunol 34, 609–633 (2016). [DOI] [PMC free article] [PubMed] [Google Scholar]
- 3.Feuerer M et al. , Lean, but not obese, fat is enriched for a unique population of regulatory T cells that affect metabolic parameters. Nat Med 15, 930–939 (2009). [DOI] [PMC free article] [PubMed] [Google Scholar]
- 4.Kolodin D et al. , Antigen- and cytokine-driven accumulation of regulatory T cells in visceral adipose tissue of lean mice. Cell Metab 21, 543–557 (2015). [DOI] [PMC free article] [PubMed] [Google Scholar]
- 5.Cipolletta D et al. , PPAR-γ is a major driver of the accumulation and phenotype of adipose tissue Treg cells. Nature. 486, 549–553 (2012). [DOI] [PMC free article] [PubMed] [Google Scholar]
- 6.Vasanthakumar A et al. , The transcriptional regulators IRF4, BATF and IL-33 orchestrate development and maintenance of adipose tissue-resident regulatory T cells. Nat. Immunol 16, 276–285 (2015). [DOI] [PubMed] [Google Scholar]
- 7.Burzyn D et al. , A special population of regulatory T cells potentiates muscle repair. Cell. 155, 1282–1295 (2013). [DOI] [PMC free article] [PubMed] [Google Scholar]
- 8.Kuswanto W et al. , Poor Repair of Skeletal Muscle in Aging Mice Reflects a Defect in Local, Interleukin-33-Dependent Accumulation of Regulatory T Cells. Immunity. 44, 355–367 (2016). [DOI] [PMC free article] [PubMed] [Google Scholar]
- 9.Sefik E et al. , Individual intestinal symbionts induce a distinct population of RORγ+ regulatory T cells. Science. 349, 993–997 (2015). [DOI] [PMC free article] [PubMed] [Google Scholar]
- 10.Schiering C et al. , The alarmin IL-33 promotes regulatory T-cell function in the intestine. Nature. 513, 564–568 (2014). [DOI] [PMC free article] [PubMed] [Google Scholar]
- 11.Ohnmacht C et al. , The microbiota regulates type 2 immunity through RORγ+ T cells. Science. 349, 989–993 (2015). [DOI] [PubMed] [Google Scholar]
- 12.Scharschmidt TC et al. , Commensal Microbes and Hair Follicle Morphogenesis Coordinately Drive Treg Migration into Neonatal Skin. Cell Host Microbe 21, 467–477 (2017). [DOI] [PMC free article] [PubMed] [Google Scholar]
- 13.Ali N et al. , Regulatory T Cells in Skin Facilitate Epithelial Stem Cell Differentiation. Cell. 169, 1119–1129 (2017). [DOI] [PMC free article] [PubMed] [Google Scholar]
- 14.Buenrostro JD et al. , Transposition of native chromatin for fast and sensitive epigenomic profiling of open chromatin, DNA-binding proteins and nucleosome position. Nat Methods. 10, 1213–1218 (2013). [DOI] [PMC free article] [PubMed] [Google Scholar]
- 15.Lara-Astiaso D et al. , Chromatin state dynamics during blood formation. Science. 345, 943–949 (2014). [DOI] [PMC free article] [PubMed] [Google Scholar]
- 16.Klein AM et al. , Droplet barcoding for single-cell transcriptomics applied to embryonic stem cells. Cell. 161, 1187–1201 (2015). [DOI] [PMC free article] [PubMed] [Google Scholar]
- 17.Zilionis R et al. , Single-cell barcoding and sequencing using droplet microfluidics. Nat Protoc 12, 44–73 (2017). [DOI] [PubMed] [Google Scholar]
- 18.Zemmour D et al. , Single-cell gene expression reveals a landscape of regulatory T cell phenotypes shaped by the TCR. Nat Immunol 19, 291–301 (2018). [DOI] [PMC free article] [PubMed] [Google Scholar]
- 19.Cipolletta D et al. , Appearance and disappearance of the mRNA signature characteristic of Treg cells in visceral adipose tissue: age, diet, and PPARgamma effects. Proc Natl Acad Sci U S A 112, 482–487 (2015). [DOI] [PMC free article] [PubMed] [Google Scholar]
- 20.Delacher M et al. , Genome-wide DNA-methylation landscape defines specialization of regulatory T cells in tissues. Nat Immunol 18, 1160–1172 (2017). [DOI] [PMC free article] [PubMed] [Google Scholar]
- 21.Asher G, Sassone-Corsi P, Time for food: the intimate interplay between nutrition, metabolism, and the circadian clock. Cell. 161, 84–92 (2015). [DOI] [PubMed] [Google Scholar]
- 22.Cretney E, Kallies A, Nutt SL, Differentiation and function of Foxp3(+) effector regulatory T cells. Trends Immunol 34, 74–80 (2013). [DOI] [PubMed] [Google Scholar]
- 23.Chen W et al. , Conversion of peripheral CD4+CD25− naive T cells to CD4+CD25+ regulatory T cells by TGF-beta induction of transcription factor Foxp3. J Exp Med 198, 1875–1886 (2003). [DOI] [PMC free article] [PubMed] [Google Scholar]
- 24.Shih HY et al. , Developmental Acquisition of Regulomes Underlies Innate Lymphoid Cell Functionality. Cell. 165, 1120–1133 (2016). [DOI] [PMC free article] [PubMed] [Google Scholar]
- 25.Scott-Browne JP et al. , Dynamic Changes in Chromatin Accessibility Occur in CD8+ T Cells Responding to Viral Infection. Immunity. 45, 1327–1340 (2016). [DOI] [PMC free article] [PubMed] [Google Scholar]
- 26.Ackermann AM et al. , Integration of ATAC-seq and RNA-seq identifies human alpha cell and beta cell signature genes. Mol Metab 5, 233–244 (2016). [DOI] [PMC free article] [PubMed] [Google Scholar]
- 27.Hnisz D et al. , Super-enhancers in the control of cell identity and disease. Cell. 155, 934–947 (2013). [DOI] [PMC free article] [PubMed] [Google Scholar]
- 28.Vahedi G et al. , Super-enhancers delineate disease-associated regulatory nodes in T cells. Nature. 520, 558–562 (2015). [DOI] [PMC free article] [PubMed] [Google Scholar]
- 29.Whyte WA et al. , Master transcription factors and mediator establish super-enhancers at key cell identity genes. Cell. 153, 307–319 (2013). [DOI] [PMC free article] [PubMed] [Google Scholar]
- 30.Kitagawa Y et al. , Guidance of regulatory T cell development by Satb1-dependent super-enhancer establishment. Nat Immunol 18, 173–183 (2017). [DOI] [PMC free article] [PubMed] [Google Scholar]
- 31.Loven J et al. , Selective inhibition of tumor oncogenes by disruption of super-enhancers. Cell. 153, 320–334 (2013). [DOI] [PMC free article] [PubMed] [Google Scholar]
- 32.Bernstein BE et al. , A bivalent chromatin structure marks key developmental genes in embryonic stem cells. Cell. 125, 315–326 (2006). [DOI] [PubMed] [Google Scholar]
- 33.Voigt P, Tee WW, Reinberg D, A double take on bivalent promoters. Genes Dev 27, 1318–1338 (2013). [DOI] [PMC free article] [PubMed] [Google Scholar]
- 34.Klenova EM, Morse HC III, Ohlsson R, Lobanenkov VV, The novel BORIS + CTCF gene family is uniquely involved in the epigenetics of normal biology and cancer. Semin. Cancer Biol 12, 399–414 (2002). [DOI] [PubMed] [Google Scholar]
- 35.Wei GH et al. , Genome-wide analysis of ETS-family DNA-binding in vitro and in vivo. EMBO J 29, 2147–2160 (2010). [DOI] [PMC free article] [PubMed] [Google Scholar]
- 36.Koch MA et al. , The transcription factor T-bet controls regulatory T cell homeostasis and function during type 1 inflammation. Nat. Immunol 10, 595–602 (2009). [DOI] [PMC free article] [PubMed] [Google Scholar]
- 37.Tan TG, Mathis D, Benoist C, Singular role for T-BET+CXCR3+ regulatory T cells in protection from autoimmune diabetes. Proc Natl Acad Sci U S A (2016). [DOI] [PMC free article] [PubMed] [Google Scholar]
- 38.Linterman MA et al. , Foxp3+ follicular regulatory T cells control the germinal center response. Nat Med 17, 975–982 (2011). [DOI] [PMC free article] [PubMed] [Google Scholar]
- 39.Chung Y et al. , Follicular regulatory T cells expressing Foxp3 and Bcl-6 suppress germinal center reactions. Nat Med 17, 983–988 (2011). [DOI] [PMC free article] [PubMed] [Google Scholar]
- 40.Hill JA et al. , Foxp3 transcription-factor-dependent and -independent regulation of the regulatory T cell transcriptional signature. Immunity. 27, 786–800 (2007). [DOI] [PubMed] [Google Scholar]
- 41.Hashimshony T, Wagner F, Sher N, Yanai I, CEL-Seq: single-cell RNA-Seq by multiplexed linear amplification. Cell Rep 2, 666–673 (2012). [DOI] [PubMed] [Google Scholar]
- 42.Miragaia RJ et al. , Single cell transcriptomics of regulatory T cells reveals trajectories of tissue adaptation. bioRxiv doi: 10.1101/217489. (2018). [DOI] [PMC free article] [PubMed] [Google Scholar]
- 43.Ramirez RN et al. , Dynamic Gene Regulatory Networks of Human Myeloid Differentiation. Cell Syst 4, 416–429 (2017). [DOI] [PMC free article] [PubMed] [Google Scholar]
- 44.Macosko EZ et al. , Highly Parallel Genome-wide Expression Profiling of Individual Cells Using Nanoliter Droplets. Cell. 161, 1202–1214 (2015). [DOI] [PMC free article] [PubMed] [Google Scholar]
- 45.Tanay A, Regev A, Scaling single-cell genomics from phenomenology to mechanism. Nature. 541, 331–338 (2017). [DOI] [PMC free article] [PubMed] [Google Scholar]
- 46.Mangan S, Alon U, Structure and function of the feed-forward loop network motif. Proc Natl Acad Sci U S A 100, 11980–11985 (2003). [DOI] [PMC free article] [PubMed] [Google Scholar]
- 47.Roychoudhuri R et al. , BACH2 represses effector programs to stabilize T(reg)-mediated immune homeostasis. Nature. 498, 506–510 (2013). [DOI] [PMC free article] [PubMed] [Google Scholar]
- 48.Gosselin D et al. , Environment drives selection and function of enhancers controlling tissue-specific macrophage identities. Cell. 159, 1327–1340 (2014). [DOI] [PMC free article] [PubMed] [Google Scholar]
- 49.Lavin Y et al. , Tissue-resident macrophage enhancer landscapes are shaped by the local microenvironment. Cell. 159, 1312–1326 (2014). [DOI] [PMC free article] [PubMed] [Google Scholar]
- 50.Vasanthakumar A et al. , The TNF Receptor Superfamily-NF-κB Axis Is Critical to Maintain Effector Regulatory T Cells in Lymphoid and Non-lymphoid Tissues. Cell Rep 20, 2906–2920 (2017). [DOI] [PubMed] [Google Scholar]
- 51.Xu M et al. , c-MAF-dependent regulatory T cells mediate immunological tolerance to a gut pathobiont. Nature. 554, 373–377 (2018). [DOI] [PMC free article] [PubMed] [Google Scholar]
- 52.Bettelli E et al. , Reciprocal developmental pathways for the generation of pathogenic effector TH17 and regulatory T cells. Nature. 441, 235–238 (2006). [DOI] [PubMed] [Google Scholar]
- 53.Rubtsov YP et al. , Regulatory T cell-derived interleukin-10 limits inflammation at environmental interfaces. Immunity. 28, 546–558 (2008). [DOI] [PubMed] [Google Scholar]
- 54.Akiyama TE et al. , Conditional disruption of the peroxisome proliferator-activated receptor gamma gene in mice results in lowered expression of ABCA1, ABCG1, and apoE in macrophages and reduced cholesterol efflux. Mol. Cell Biol 22, 2607–2619 (2002). [DOI] [PMC free article] [PubMed] [Google Scholar]
- 55.Sickle: A sliding-window, adaptive, quality-based trimming tool for FastQ files (Version 1.33) [Software]. Available: https://github.com/najoshi/sickle
- 56.Langmead B, Salzberg SL, Fast gapped-read alignment with Bowtie 2. Nat Methods. 9, 357–359 (2012). [DOI] [PMC free article] [PubMed] [Google Scholar]
- 57.Li H et al. , The Sequence Alignment/Map format and SAMtools. Bioinformatics. 25, 2078–2079 (2009). [DOI] [PMC free article] [PubMed] [Google Scholar]
- 58.Heinz S et al. , Simple combinations of lineage-determining transcription factors prime cis-regulatory elements required for macrophage and B cell identities. Mol. Cell 38, 576–589 (2010). [DOI] [PMC free article] [PubMed] [Google Scholar]
- 59.Kim D et al. , TopHat2: accurate alignment of transcriptomes in the presence of insertions, deletions and gene fusions. Genome Biol 14, R36 (2013). [DOI] [PMC free article] [PubMed] [Google Scholar]
- 60.Burzyn D, Benoist C, Mathis D, Regulatory T cells in nonlymphoid tissues. Nat Immunol 14, 1007–1013 (2013). [DOI] [PMC free article] [PubMed] [Google Scholar]
- 61.Langfelder P, Horvath S, WGCNA: an R package for weighted correlation network analysis. BMC. Bioinformatics 9, 559 (2008). [DOI] [PMC free article] [PubMed] [Google Scholar]
Associated Data
This section collects any data citations, data availability statements, or supplementary materials included in this article.
Supplementary Materials
Fig. S1. ATAC-seq general features
Fig. S2. Priming of OCRs at tissue-restricted genes in splenic Tregs also occurs at TSS-distal regions and is not composed of weak OCRs.
Fig. S3. Generation and analysis of ATAC-seq-derived super-enhancers across Treg subsets.
Fig. S4. Tissue-Treg scRNA-seq data-set validation
Fig. S5. Pan-tissue and tissue-specific Treg modules identified by combining ATAC-seq and scRNA-seq data
Supplementary Materials and Methods
Table S1. Tissue-Treg gene sets
Table S2. Edge list of the tissue-Treg transcriptional network