

Abstract
The rice plant produces an amorphous silica layer in the husk covering the brown rice grain as a part of a protective respiration system. The layer shows high permeation molecular flow while the Brunauer–Emmett–Teller isotherm indicates the existence of nanometer-sized pores. Here, we interpret the inner structure of the layer as a porous network consisting of void spheres with a degree of 2–5 and tunnels with a length of 2–7 nm based on the transmission electron microscopy images. In the network, the gas molecules travel through the tunnels and move in random directions after collisions with the walls of the spheres. A tree network was introduced to understand the permeance of the layer and the reflection of the molecule of the root or parent sphere was estimated for a specific case. The tree becomes a graph with cycles in a finite space such as the silica layer and the reflection of the root sphere in the graph converses to that of the tree. On the basis of the properties of the network, the high permeance of the silica layer in the rice husk can be explained. It is suggested that the specific system restricts the movements of the gas molecules and can be applied to reduce the size of gas phase separation and chemical reactor systems providing a new view to understand nanoscaled porous materials.
1. Introduction
Rice is the principal staple in Asia and over 400 million tons are produced annually throughout the world. At maturity, the rice plant has root, the main stem, and a number of tillers. Each productive tiller bears a terminal flowering head that has ∼80 rice grains. The rice grain consists of the brown rice and the hull or husk which encloses the brown rice. The husk weighs about 20% of the total grain and its thickness varies from 50 to 100 μm.1,2 The husk is divided into three layers—an outer 50 nm cellulose layer, a 2–5 μm silica layer, and an inner thick cellulose layer.3−5 The elemental analysis of the husk indicates 5–10 wt % Si, 0.50 wt % K, 0.07 wt % Na, and 0.6 wt % Al on the basis of organics.6,7 Thermal treatment of the rice husk in a controlled atmosphere produces silica particles with high purity, high surface area, nanometer pores, and high chemical reactivity.8−11 Recently, the rice husk silica has been studied as a sustainable and environmentally friendly silica source12−25 as well as a multifunctional mesoporous material.26−33 Besides the possible applications of the thermally produced rice husk silica, there is also a question on the origin of its pore, i.e., whether it exists in the fresh rice husk or grows during the thermal process. To investigate the whole picture, we have conducted studies on the properties and structure of the silica layer in the fresh rice husk.3,34 As a result, we report a porous nanoscaled network in the layer and its interpretation from the view of a mathematical graph in this study. It is generally understood that the root takes silicate ions in the water and the silica deposits in the husk. Since the husk grows very fast in the ripening stage, it has been suggested that the silica is stored in the stem in the growing stage.34 On the basis of the scanning electron microscopy (SEM) images, it is understood that the silica nanoparticle unit starting from ∼10 nm appears and then aggregates up to ∼50 nm in the stem in the growing stage. As the amount and size of the silica particles increases, ∼50 nm clusters aggregate to larger structures to strengthen the plant in water. In the flowering stage, the units move to rice husk while the aggregates disappear leaving some stripes or tracks. From the finding of 10–20 nm silica particles in the stem and the husk, the 10–20 nm silica nanoparticle unit is expected to play a key role in the transportation of the silica from the stem to husk and the building up of the silica layer in the husk.34 The existence of ∼3.5 nm pores in the thermally produced rice husk silica suggests that there are nano-sized pores in the silica layer of the raw husk.35−38 Apparently the rice husk passes oxygen, water, and carbon dioxide and also protects the living rice grain from microorganisms similar to eggshells.39,40 The gas permeance through the raw husk silica layer has been determined experimentally using individual rice husk sample epoxied to a 2 mm diameter end of a glass tubing attached to a vacuum system equipped with capacitance manometers and a mass spectrometer.34 From the observed permeation of gases before and after the treatment of the husk sample with hydrogen fluoride solution, the permeance of the silica layer for hydrogen is estimated to be ∼3 × 10⁻³ mol s–1 m–2 Pa–1, while the flow was seen to be molecular or Knudsen similar to the mesoporous membranes (Table 1). This permeance is considerably larger than previously reported values for silica membranes41−44 and it corresponds to over 1.8% of the incident molecules on the apparent area. The results suggest that there are through-holes in the layer and the structure of the holes allows the high gas permeance as well as the molecular flow is observed.
Table 1. Permeance of Gases through Raw Rice Huska.
| samples | permeating gas G | observed leak rate/10–3 mol s–1 | permeance/10–3 mol s–1 m–2 Pa–1 | ratio of permeance P(H2)/P(G) | transmittance of incident gas molecule P(G)/Z(G) |
|---|---|---|---|---|---|
| raw rice husk H | H2 | 0.92 | 2.9 | 1.0 | 0.016 |
| CH4 | 0.32 | 1.0 | 2.9 | 0.016 | |
| CO2 | 0.20 | 0.6 | 4.6 | 0.016 | |
| HF treated rice husk F | H2 | 12.04 | 37.8 | 1.0 | 0.212 |
| CH4 | 4.83 | 15.2 | 2.5 | 0.240 | |
| CO2 | 2.98 | 9.3 | 4.0 | 0.245 | |
| silica layer S | H2 | 3.1 | 1.0 | 0.018 | |
| CH4 | 1.1 | 2.9 | 0.017 | ||
| CO2 | 0.7 | 4.7 | 0.018 |
The leak rate of gas through a sample of rice husk was measured under the pressure difference of 1 atm at 298 K using the sample epoxide to a 2 mm diameter end of a glass tubing attached to a vacuum system equipped with capacitance manometers and a gas monitoring mass spectrometer. The permeances of samples H and F, PH and PF were calculated assuming the permeating area of 3.14 × 10⁻⁶ m2 while that of the silica layer PS was estimated from 1/PH = 1/PF + 1/PS. The theoretical values of P(H2)/P(CH4); P(H2)/P(CO2) for the molecular and viscous flows are 2.8; 4.7 and 1.2; 1.6, respectively. The incident molecule flux Z(G) was calculated from Z(G) = 1/(2πRTM(G))1/2, where R and M(G) are the gas constant and molar weight of the gas, respectively.
The chemically isolated silica layer shows a Brunauer–Emmett–Teller (BET) isotherm with the surface area (A), single point adsorption pore volume (V) at P/P0 = 0.9917, and adsorption averaged pore width (4V/A) as 267 m2 g–1, 0.372 cm3 g–1, and 5.6 nm, respectively.45 The BET isotherm shows the typical hysteresis. The shape of the isotherm can be classified as type IV of IUPAC classification characterizing a mesoporous adsorbent with strong affinities46 (Figure S1a). The analysis of the pore size suggests an existence of 3–5 nm pores using the Barrett–Joyner–Halenda method47 (Figure S1b). The pore size of the layer is larger than that of the thermally produced rice husk silica but the pattern of pore size distribution is similar. The silica layer shows a broad peak with the d spacing of about 0.4 nm (2Θ = 22) in X-ray diffraction as seen in the thermally produced rice husk silica (Figure S2a). In 29Si NMR, three peaks are observed at −92, −101, and −110 ppm that correspond to Q2, Q3, and Q4 states of Si, respectively48 (Figure S2b). This implies that the silica layer is amorphous, and there are through-nanometer-sized holes, whose structure allows high gas permeance as well as the molecular flow is observed. In general, we can imagine two types of pores in the silica layer. The first is the connection of the spaces between 20 and 60 nm silica particles which was observed in SEM images of the stem and the husk. The other considerable structure is a straight nanometer-sized hole, as a micron-sized hole has been found in the egg shell based on the similarity of the biological respiratory system.39,40 In any case, the images of the hole can be expected in the cross-section of the layer. Since the resolution of SEM and atomic force microscopy is not suitable to observe the irregular nanometer-sized holes, an scanning tunneling microscopy (STM) study was performed on the osmium atom-coated cross-section of the silica layer.3 In the STM image, it is apparent that several 10 nm-sized particles were aggregated to ∼100 nm clusters which is consistent with the SEM image. However, in the zoom in the STM image and line profile analysis, deep wells of about 4.5 nm in horizontal length and about 1.7 nm in vertical length were also found. Another well with a horizontal length of about 1.7 nm and a vertical length of about 4.8 nm was also observed in another region in the sample. The results are consistent with the fragments of nanometer-sized holes on the silica (particles or plates) being covered with osmium atoms showing STM images of the wells. Here, we report further study on the structure of the holes of the silica layer with high-resolution transmission electron microscopy (TEM).
2. Results and Discussion
The silica layer is identified as an amorphous phase from the results of the electron diffraction pattern.
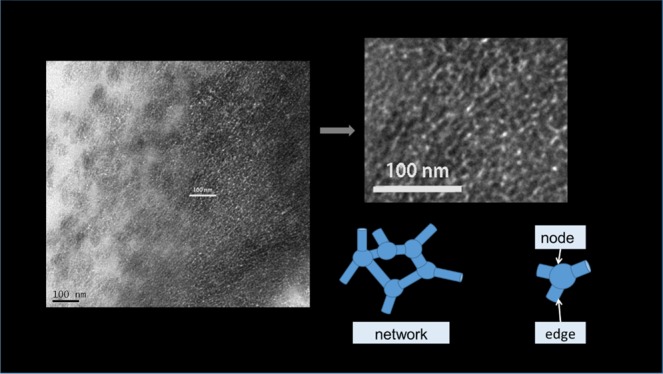
Figure 1a,b shows cross-sectional TEM micrographs taken from the silica layer. The image of the layer is composed of two areas, i.e., gray and white contrast areas. The white contrast is assigned to void spaces in the sample having 100 nm thickness. The small rectangular parts of the TEM images have been displayed in Figure 1c,e. If we represent the large white area as a large void space like a sphere and the smaller white area as a line or a tunnel, we can draw networks similar to graphs in mathematics (Figure 1e,f). Even though the images change with the time of electron irradiation (Figure S3) focusing the depth of the electron beam (Figure S4), they appear to be a network (Figure S5). To obtain more specific data, we constructed a network in different parts of the image through Figure S5. Tables 2 and 3 correspond to the graphs about the degree of sphere and the length of the tunnel in Figures 1 and S5, respectively. In general, the number of tunnels connected to a sphere, the sphere in the layer is 2–5, while the length (projected) of the tunnel is 2–7 nm.
Figure 1.

Development of the sphere and tunnel network model for the silica layer in rice husk. (a, b) TEM images of the cross-section of the silica layer in rice husk (25 000×). (c, d) Expanded image of the rectangular parts in (a), (b), respectively. (e, f) Graphs overlapped on (c), (d), respectively. Scale bars in (a), (b), 100 nm. The image size of (c), (d), (e), and (f), 50 nm × 50 nm.
Table 2. Observed Frequency of Degree of Spheres in the Silica Layer in Rice Husk Samplesa.
| degree
of sphere |
|||||||||
|---|---|---|---|---|---|---|---|---|---|
| 1 | 2 | 3 | 4 | 5 | 6 | 7 | mean degree | standard deviation | |
| network 1 | 0 | 0 | 88 | 55 | 12 | 4 | 0 | 3.6 | 0.7 |
| network 2 | 0 | 0 | 106 | 43 | 13 | 1 | 0 | 3.4 | 0.7 |
| network 3 | 0 | 0 | 78 | 48 | 11 | 3 | 0 | 3.5 | 0.7 |
| network 4 | 0 | 0 | 75 | 27 | 8 | 1 | 0 | 3.4 | 0.7 |
| total | 0 | 0 | 347 | 173 | 44 | 9 | 0 | 3.5 | 0.7 |
Table 3. Observed Frequency of Length of Tunnels in the Silica Layer in Rice Husk Samplesa.
| length of tunnel/nm |
|||||||||||
|---|---|---|---|---|---|---|---|---|---|---|---|
| <2 | 2–3 | 3–4 | 4–5 | 5–6 | 6–7 | 7–8 | 8–9 | 9> | mean length/nm | standard deviation/nm | |
| network 1 | 0 | 37 | 63 | 54 | 51 | 31 | 11 | 2 | 0 | 4.5 | 1.4 |
| network 2 | 0 | 31 | 61 | 59 | 53 | 17 | 5 | 2 | 0 | 4.4 | 1.2 |
| network 3 | 0 | 15 | 67 | 68 | 49 | 24 | 5 | 4 | 0 | 4.6 | 1.3 |
| network 4 | 0 | 19 | 36 | 40 | 47 | 21 | 2 | 8 | 3 | 4.9 | 1.6 |
| total | 0 | 102 | 227 | 221 | 200 | 93 | 23 | 16 | 3 | 4.6 | 1.4 |
Similar analysis of other TEM images can also be visualized as mathematical graphs with the edge (tunnel) and node (sphere) structures. In graph theory, the number of edges connected to a node is called the degree of the node. Similarly, we can term the number of tunnels connected to a sphere as the degree of the sphere. On the basis of the observed TEM images, the holes in the silica layer are interpreted as a network of nanometer-sized spheres with tunnels between them. In contrast, molecular sieve crystals have a defined unit cell with cavities and channels between the cavities in periodicity.49−51 Here, the sphere and tunnel network does not show distinct replications. The silica layer has an irregular pore structure, and we cannot apply the unit cell view with cavities and channels to the layer. In the view point of understanding amorphous porous materials, especially in ceramics, it was considered that the pores are the spaces between the spheres. This hard sphere and the inter-space view were more applicable to the materials originating from aggregation or sintering of spherical particles larger than the order of 100 nm. When the size of the constituting hard sphere is less than ∼100 nm, the increased surface energy may force a change in the shape of interparticle spaces from the regular stacking of the spheres. In the movement of atoms in the solid phase or ions and small nano-sized fragments in the solution toward the contacting point of a larger particle, the space between the particles becomes smaller and more rounded. This change induces a new structure with void spheres and tunnels between the spheres for nano-sized amorphous porous materials.
For the experimental conditions of the permeance measurement of the rice husk, 1 atm and 298 K, the mean free paths λ and the speed of the gas molecules v are greater than 50 nm and 100 m s–1, respectively.52
Since the length of the tunnels in the layer l is much shorter than λ, collisions between the molecules
as
well as molecule and the inner wall of the tunnel can be neglected
during the passage of the molecule through the tunnel (Figure 2a). Then, the time delay in
a tunnel becomes l × v–1 (∼10–10 s). When the molecules
enter into a nano-sized sphere, they experience numerous collisions
with the inner surface of the sphere (Figure 2b). If there is a negligible interaction
between the molecule and the surface, each collision changes the momentum
of the molecule and the total sum of the momentum of the molecules
is zero. This means the molecules move in all directions in the sphere
after entry. Probably, there is a certain number of collisions needed
before this state can be obtained but it does not need a long time
since the inner surface of the small sphere is not flat atomically.
Let us describe this process as a randomizing scattering or an agitation
of the molecules in the sphere. When a molecular flux enters sphere k through an opening, we can expect a part of the molecular
flux, Ωmk|k/4π,
to go out from the sphere through the opening mk|k after a randomizing scattering at nrs(dk/v + ts), where Ωmk|k, dk, ts, and nrs are the solid angle of the opening mk|k, the diameter of the sphere k, the interacting
time between that inner surface of the sphere, and the number of collisions
needed to reach the randomizing scattering, respectively. After the
first outflow, the retained flux,  experiences the second randomizing scattering
and a part of the flux,
experiences the second randomizing scattering
and a part of the flux,  directs to the opening mk|k. Roughly, the entered molecule is
retained in
the sphere for 4πnrs(d/v + ts)/∑m=1nΩmk|k. Since d × v–1 and ts are estimated to be about 10–12 and 10–15 s in the sphere, respectively,
the total time to pass the silica layer is proportional to v–1 and the steady-state gas permeation
shows characteristics of the molecular flow as is seen in the experimental
result. In the case of a network consisting of tunnels and spheres,
we can define the reflection of the sphere i toward
tunnel ij, rij|j as the ratio of flux returning from sphere i to original flux entering sphere i starting
from sphere j (Figure 2c). If the molecules start from sphere j connected to other neighboring spheres through n tunnels, the total returning molecular flux after the first round
trip becomes Sj = ∑i=1(rji|j × Ωij|j)/∑Ωij|j. In the limit of a large number of round trips, the total
reflection from sphere j through the inlet tunnel
1j, the reflection of the network RN becomes (Ω1j|j/∑Ωij|j) × ∑v=1∞(Sj)v = Ω1j|j/((1 – Sj) × ∑Ωij|j).
directs to the opening mk|k. Roughly, the entered molecule is
retained in
the sphere for 4πnrs(d/v + ts)/∑m=1nΩmk|k. Since d × v–1 and ts are estimated to be about 10–12 and 10–15 s in the sphere, respectively,
the total time to pass the silica layer is proportional to v–1 and the steady-state gas permeation
shows characteristics of the molecular flow as is seen in the experimental
result. In the case of a network consisting of tunnels and spheres,
we can define the reflection of the sphere i toward
tunnel ij, rij|j as the ratio of flux returning from sphere i to original flux entering sphere i starting
from sphere j (Figure 2c). If the molecules start from sphere j connected to other neighboring spheres through n tunnels, the total returning molecular flux after the first round
trip becomes Sj = ∑i=1(rji|j × Ωij|j)/∑Ωij|j. In the limit of a large number of round trips, the total
reflection from sphere j through the inlet tunnel
1j, the reflection of the network RN becomes (Ω1j|j/∑Ωij|j) × ∑v=1∞(Sj)v = Ω1j|j/((1 – Sj) × ∑Ωij|j).
Figure 2.

Notations in the nanoscale sphere and tunnel network model. (a) A tunnel with length l (l < λ). (b) Sphere k with three openings, Ω1k|k, Ω1k|k, and Ω1k|k, and diameter d (d < λ). (c) A network consisted of two ideal spheres and four tunnels. The arrows indicate the directions of molecule movements. Collisions between the molecules can be neglected during the passage through the network.
The entire porous silica layer can be modeled by considering a tree like sphere and tunnel network, T(n) where n is the degree of the spheres (Figure 3b–d). In our case, the root or parent sphere has one inletting open tunnel and generates (n – 1) child spheres. Then the number of kth generation spheres is (n – 1)k. To analyze the root sphere’s reflection in the tree of k-generations, R0,kT(n), we can start from the reflectance of the kth generation leaf spheres, Rk,k and then calculate that of (k – 1)th generation spheres, Rk–1,kT(n). Let the leaf sphere have a tunnel connected to the (k – 1)th generation sphere and (n – 1) open tunnels. Since, the reflectance of the open tunnel is zero, Rk,k = 1/n toward (k – 1)th generation sphere when the solid angles of the tunnels are equal. Let us follow the special case of n = 2 to understand the change in reflectance of the spheres in the identical tunnels and sphere tree (Figure 3b). Starting from the kth generation sphere, Rk,kT(2) = 1/2, we can get the set of {k – x, Rk–x,k}; {k, 1/2}, {k – 1, 2/3}, {k – 2, 3/4}, ..., {0, (k + 1)/(k + 2)}. Figure 3a shows the change of Rk–x,kT(n) for n and x. The reflectance of the tree seems to converge to a finite value as k increases as R0|∞ = 1/n.
Figure 3.

Schematic change of the reflectance of root sphere in the sphere and tunnel network. (a, b) T(2); (c) T(3); and (d) T(4); tree with the degree of spheres, n = 2; 3; and 4, respectively. The fourth generation leaf spheres of the trees have (n – 1) open tunnels (e). A graph with cycles, G(4c), transformed from (d). The leaf sphere has an open tunnel. The number of generations of (b)–(e), k is 4. It is assumed that all the solid angles of tunnels Ωij|j are equal for sphere j.
In a finite space, a tree cannot grow to infinite size, and graphs with cycles should be considered. In this sort of network, a kth generation sphere is connected to several (k – 1)th generation spheres. When the degree of the kth generation sphere is not changed, the sphere can connect up to (n – 1) spheres. For example, three third generation spheres and an open tunnel are connected to one fourth generation sphere in the network with n = 4 in Figure 3e. The reflections of spheres in the specific graph or network, R4–x,4G(n) can be estimated as a set of {k – x, R4–x,4}; {4, 3/4}, {3, 4/7}, {2, 7/16}, {1, 16/43}, {0, 43/124} compared to this, the set of {k – x, R4–x,4T(4)} of the tree of Figure 3d is {4, 1/4}, {3, 4/13}, {2, 13/40}, {1, 40/121}, {0, 121/364}. The reflectance of the root sphere in the graph converges to the same value of the tree in the case of the existence of at least one open tunnel in the leaf sphere. The same number of leaf spheres and their parent spheres in the graph of Figure 3e means the outer diameter of the network does not increase during the generation while they start to make a three-dimensional network. The result suggests that the reflectance of the root sphere in the high-pressure side depends on the degree of nearby connected spheres when the spheres far from the root are in cycles with open tunnel(s). It also means the transmission of a network with specific spheres and tunnels depends on the degree of the spheres in the network. This fact can be easily understood physically because the molecules are moving in an infinite tree without distinguishing the connecting spheres.
On the basis of the discussed properties of the network model, the high permeance of the silica layer in the rice husk can be explained. The permeance of the rice husk silica P is Z ·TN·Nt·σt where Z, TN, Nt, and σt are the striking molecular flux on the surface, the transmittance of the network 1 – RN, the density of holes per apparent area of the surface, and cross-section of the hole, respectively. Since P/Z is about 0.02 in the permeation experiment and TN is 1/2–2/3 from the analysis of the network with the degree of 3–4, Nt·σt ranges about 0.04 which is not difficult to imagine in the porous and rough amorphous surface. It was also observed that the silica layer has the similar pores and permeation properties even after the treatment up to ∼1000 K.8,9,25 It is suggested that the mechanical stability as well as the biological stability12 of the ∼micrometer silica layer with the nanoscaled porous network have been proved in the evolutional processes of the living things.
3. Conclusions
We have developed a new approach for analysis of amorphous, nanoporous materials based on the network of void spheres and tunnels. This view point explains the inner structure and the flow characteristics of the silica layer in rice husk. Specially, the size of the sphere and tunnels are shorter than the mean free paths of gases, the network shows gas molecule transmittance depending on the degree of sphere and the molecular motion strongly related to its speed. As current nanotechnology mainly focuses on the confinement of electron movement, the specific system also restricts the movement of traveling molecules in the network. This means that the new approach can make possible to design and realize the micro/nano-sized gas phase chemical reactor system as a technical convergence of chemical engineering technology, surface science, and micro/nano fabrication techniques of information technology.
4. Methodology
The inner structure of the silica layer was investigated with 200 or 300 keV high-resolution TEM. The rice used in this study was harvested from suburban areas of Gwangju in Republic of Korea from 2006. The cultivar of rice was Seomyeong (Gyehwa30). The rice husk sample was obtained by careful cutting of the rice granule with a razor blade. The sample was washed with acetone and cured at 25 °C for 12 h after imbedding in epoxy resin. The microtomed sections (approximately 100–150 nm thickness) were cut from the embedded specimen by an ultramicrotome using a diamond knife at room temperature and then collected onto 200-mesh Formvar coated copper grids. The specimen was thinned by ion milling to prepare for high-resolution TEM.
Acknowledgments
This specific project was supported by Icosatech Co. Ltd., Gwangju, Republic of Korea.
Supporting Information Available
The Supporting Information is available free of charge on the ACS Publications website at DOI: 10.1021/acsomega.8b01453.
Adsorption and desorption of N2 at 77 K on the silica layer in rice husk (Figure S1); the long range structure of the silica layer (Figure S2); change of the TEM image of an edge of the silica layer during electron irradiation (Figure S3); change of the TEM image of the silica layer depending on the focusing depth (Figure S4); development of sphere and tunnel network model for the silica layer in rice husk (Figure S5) (PDF)
Author Contributions
C.S.H. designed the project. W.J.L. prepared the specimens and analyzed the images. C.S.H. developed the network model. S.L.B. and C.S.H. discussed the result. All authors wrote the manuscript.
The authors declare no competing financial interest.
Supplementary Material
References
- Chandrasekhar S.; Pramada P. N.; Praveen L. Effect of organic acid treatment on the properties of rice husk silica. J. Mater. Sci. 2005, 40, 6535–6544. 10.1007/s10853-005-1816-z. [DOI] [Google Scholar]
- Bansal V.; Ahmad A.; Sastry M. Fungus-mediated biotransformation of amorphous silica in rice husk to nanocrystalline silica. J. Am. Chem. Soc. 2006, 128, 14059–14066. 10.1021/ja062113+. [DOI] [PubMed] [Google Scholar]
- Byun S. C.; Jung I. O.; Kim M. Y.; So S. J.; Yoon C.; Kim C.; Lei G.; Han C. S. Morphology of the cross section of silica layer in rice husk. J. Nanosci. Nanotechnol. 2011, 11, 1305–1309. 10.1166/jnn.2011.3338. [DOI] [PubMed] [Google Scholar]
- Johar N.; Ahmad I.; Dufresne A. Extraction, preparation and characterization of cellulose fibres and nanocrystals from rice husk. Ind. Crops Prod. 2012, 37, 93–99. 10.1016/j.indcrop.2011.12.016. [DOI] [Google Scholar]
- Kumar A.; Negi Y. S.; Choudhary V.; Bhardwaj N. K. Characterization of cellulose nanocrystals produced by acid-hydrolysis from sugarcane bagasse as agro-waste. J. Mater. Phys. Chem. 2014, 2, 1–8. 10.12691/jmpc-2-1-1. [DOI] [Google Scholar]
- Kalapathy U.; Proctor A.; Shultz J. A simple method for production of pure silica from rice hull ash. Bioresour. Technol. 2000, 73, 257–262. 10.1016/S0960-8524(99)00127-3. [DOI] [PubMed] [Google Scholar]
- Shen Y.; Zhao P.; Shao Q. Porous silica and carbon derived materials from rice husk pyrolysis char. Microporous Mesoporous Mater. 2014, 188, 46–76. 10.1016/j.micromeso.2014.01.005. [DOI] [Google Scholar]
- Chon H.; Chon M. J.; Han C. S.. Method for preparing porous silica, porous silica based molding material, and nano-sized silica particle derived from rice husk. Korean Patent 0396457, 2001.
- Liou T. H. Preparation and characterization of nano-structured silica from rice husk. Mater. Sci. Eng., A 2004, 364, 313–323. 10.1016/j.msea.2003.08.045. [DOI] [Google Scholar]
- Huang S.; Jing S.; Wang J.; Wang Z.; Jin Y. Silica white obtained from rice husk in a fluidized bed. Powder Technol. 2001, 117, 232–238. 10.1016/S0032-5910(00)00372-7. [DOI] [Google Scholar]
- Liou T. H. Evolution of chemistry and morphology during the carbonization and combustion of rice husk. Carbon 2004, 42, 785–794. 10.1016/j.carbon.2004.01.050. [DOI] [Google Scholar]
- So S. J.; Jang I. S.; Han C. S. Effect of micro/nano silica particle feeding for mice. J. Nanosci. Nanotechnol. 2008, 8, 5367–5371. 10.1166/jnn.2008.1347. [DOI] [PubMed] [Google Scholar]
- Shen Y. Rice husk silica derived nanomaterials for sustainable application. Renewable Sustainable Energy Rev. 2017, 80, 453–366. 10.1016/j.rser.2017.05.115. [DOI] [Google Scholar]
- Sobrosa F. Z.; Stochero N. P.; Marangon E.; Tier M. D. Development of refractory ceramics from residual silica derived from rice husk ash. Ceram. Int. 2017, 43, 7142–7146. 10.1016/j.ceramint.2017.02.147. [DOI] [Google Scholar]
- Wittayakun J.; Khemthong P.; Prayoonpokarach S. Synthesis and characterization of zeolite NaY from rice husk silica. Korean J. Chem. Eng. 2008, 25, 861–864. 10.1007/s11814-008-0142-y. [DOI] [Google Scholar]
- Liu N.; Huo K.; McDowell M. T.; Zhao J.; Cui Y. Rice husks as a sustainable source of nanostructured silicon for high performance Li-ion battery anodes. Sci. Rep. 2013, 3, 1919 10.1038/srep01919. [DOI] [PMC free article] [PubMed] [Google Scholar]
- Gaslain F. O. M.; Delacote C.; Walcarius A.; Lebeau B. One-step preparation of thiol-modified mesoporous silica spheres with various functionalization levels and different pore structures. J. Sol-Gel Sci. Technol. 2009, 49, 112–124. 10.1007/s10971-008-1845-6. [DOI] [Google Scholar]
- Alvarez J.; Lopez G.; Amutio M.; Bilbao J.; Olazar M. Upgrading the rice husk char obtained by flash pyrolysis for the production of amorphous silica and high quality activated carbon. Bioresour. Technol. 2014, 170, 132–137. 10.1016/j.biortech.2014.07.073. [DOI] [PubMed] [Google Scholar]
- Della V. P.; Kuhn I.; Hotza D. Rice husk ash as an alternate source for active silica production. Mater. Lett. 2002, 57, 818–821. 10.1016/S0167-577X(02)00879-0. [DOI] [Google Scholar]
- Yalçin N.; Sevinc V. Studies on silica obtained from rice husk. Ceram. Int. 2001, 27, 219–224. 10.1016/S0272-8842(00)00068-7. [DOI] [Google Scholar]
- An D.; Guo Y.; Zhu Y.; Wang Z. A green route to preparation of silica powders with rice husk ash and waste gas. Chem. Eng. J. 2010, 162, 509–514. 10.1016/j.cej.2010.05.052. [DOI] [Google Scholar]
- Slowing I. I.; Vivero-Escoto J. L.; Wu C. W.; Lin V. S. Y. Mesoporous silica nanoparticles as controlled release drug delivery and gene transfection carriers. Adv. Drug Delivery Rev. 2008, 60, 1278–1288. 10.1016/j.addr.2008.03.012. [DOI] [PubMed] [Google Scholar]
- Radhika T.; Sugunan S. Structural and catalytic investigation of vanadia supported on ceria promoted with high surface area rice husk silica. J. Mol. Catal. A: Chem. 2006, 250, 169–176. 10.1016/j.molcata.2006.01.048. [DOI] [Google Scholar]
- Ahmed A. E.; Adam F. Indium incorporated silica from rice husk and its catalytic activity. Microporous Mesoporous Mater. 2007, 103, 284–295. 10.1016/j.micromeso.2007.01.055. [DOI] [Google Scholar]
- Adam F.; Appaturi J. N.; Iqbal A. The utilization of rice husk silica as a catalyst: review and recent progress. Catal. Today 2012, 190, 2–14. 10.1016/j.cattod.2012.04.056. [DOI] [Google Scholar]
- Lee S. Y.; Han C. S. Nano filter from sintered rice husk silica membrane. J. Nanosci. Nanotechnol. 2006, 6, 3384–3387. 10.1166/jnn.2006.016. [DOI] [PubMed] [Google Scholar]
- Hwang M. J.; Lee S. Y.; Han C. S. A study on electric conductivity of phosphoric acid supported on nano-pore rice husk silica in H2|Pt|H3PO4/RHS|Pt|O2 fuel cell. J. Nanosci. Nanotechnol. 2006, 6, 3491–3493. 10.1166/jnn.2006.041. [DOI] [PubMed] [Google Scholar]
- Zhao Y. N.; Han C. S. Permeation of solvents through disk type rice husk silica membrane modified with alkyl silylation reagents. J. Nanosci. Nanotechnol. 2011, 11, 7254–7257. 10.1166/jnn.2011.4804. [DOI] [PubMed] [Google Scholar]
- Le T. B.; Han C. S.; Cho K. W.; Han O. S. Covalent immobilization of oxylipin biosynthetic enzymes on nanoporous rice husk silica for production of cis(+)-12-oxophytodienoic acid. Artif. Cells, Nanomed., Biotechnol. 2017, 1–7. 10.1080/21691401.2017.1375939. [DOI] [PubMed] [Google Scholar]
- Pattnayak A.; Madhu N.; Panda A. S.; Sahoo M. K.; Mohanta K. A Comparative study on mechanical properties of Al-SiO2 composites fabricated using rice husk silica in crystalline and amorphous form as reinforcement. Mater. Today: Proc. 2018, 5, 8184–8192. 10.1016/j.matpr.2017.11.507. [DOI] [Google Scholar]
- Bhagiyalakshmi M.; Yun L. J.; Anuradha R.; Jang H. T. Utilization of rice husk ash as silica source for the synthesis of mesoporous silicas and their application to CO2 adsorption through TREN/TEPA grafting. J. Hazard. Mater. 2010, 175, 928–938. 10.1016/j.jhazmat.2009.10.097. [DOI] [PubMed] [Google Scholar]
- Adam F.; Ahmed A. E.; Min S. L. Silver modified porous silica from rice husk and its catalytic potential. J. Porous Mater. 2008, 15, 433–444. 10.1007/s10934-007-9106-6. [DOI] [Google Scholar]
- Sankar S.; Sharma S. K.; Kaur N.; Lee B.; Kim D. Y.; Lee S.; Jung H. Biogenerated silica nanoparticles synthesized from sticky, red, and brown rice husk ashes by a chemical method. Ceram. Int. 2016, 42, 4875–4885. 10.1016/j.ceramint.2015.11.172. [DOI] [Google Scholar]
- Han C. S.; Lee H. Y.; Rho Y. On biologically produced nanomaterials. Int. J. Nanotechnol. 2006, 3, 236–252. 10.1504/IJNT.2006.009582. [DOI] [Google Scholar]
- Wang W.; Martin J. C.; Fan X.; Han A.; Luo Z.; Sun L. Silica Nanoparticles and Frameworks from Rice Husk Biomass. ACS Appl. Mater. Interfaces 2012, 4, 977–981. 10.1021/am201619u. [DOI] [PubMed] [Google Scholar]
- Carmona V. B.; Oliveria R. M.; Silva W. T. L.; Mattoso L. H. C.; Marconcini J. M. Nanosilica from rice husk: Extraction and characterization. Ind. Crops Prod. 2013, 43, 291–296. 10.1016/j.indcrop.2012.06.050. [DOI] [Google Scholar]
- Adam F.; Appaturi J. N.; Thankappan R.; Nawi M. A. M. Silica–tin nanotubes prepared from rice husk ash by sol–gel method: Characterization and its photocatalytic activity. Appl. Surf. Sci. 2010, 257, 811–816. 10.1016/j.apsusc.2010.07.070. [DOI] [Google Scholar]
- Soltani N.; Bahrami A.; Pech-Canul M. I.; González L. A. Review on the physicochemical treatments of rice husk for production of advanced materials. Chem. Eng. J. 2015, 264, 899–935. 10.1016/j.cej.2014.11.056. [DOI] [Google Scholar]
- Hinton H. E. Respiratory systems of insect egg shells. Annu. Rev. Entomol. 1969, 14, 343–368. 10.1146/annurev.en.14.010169.002015. [DOI] [PubMed] [Google Scholar]
- Wangensteen O. D.; Wilson D.; Rahn H. Diffusion of gases across the shell of the hen’s egg. Respir. Physiol. 1970, 11, 16–30. 10.1016/0034-5687(70)90099-X. [DOI] [PubMed] [Google Scholar]
- Kumar P.; Ida J.; Kim S.; Guliants V. V.; Lin J. Y. S. Ordered mesoporous membranes: Effects of support and surfactant removal conditions on membrane quality. J. Membr. Sci. 2006, 279, 539–574. 10.1016/j.memsci.2005.12.053. [DOI] [Google Scholar]
- Tsuru T.; Igi R.; Kanezashi M.; Yoshioka T.; Fujisaki S.; Iwamoto Y. Permeation properties of hydrogen and water vapor through porous silica membranes at high temperatures. AIChE J. 2011, 57, 618–629. 10.1002/aic.12298. [DOI] [Google Scholar]
- Kanezashi M.; Yada K.; Yoshioka T.; Tsuru T. Design of silica networks for development of highly permeable hydrogen separation membranes with hydrothermal stability. J. Am. Chem. Soc. 2009, 131, 414–415. 10.1021/ja806762q. [DOI] [PubMed] [Google Scholar]
- Gavalas G. R.; Megiris C. E.; Nam S. W. Deposition of H2-permselective SiO2 films. Chem. Eng. Sci. 1989, 44, 1829–1836. 10.1016/0009-2509(89)85125-5. [DOI] [Google Scholar]
- Brunauer S.; Emmett P. H.; Teller E. Absorption of gases in multimolecular layers. J. Am. Chem. Soc. 1938, 60, 309–319. 10.1021/ja01269a023. [DOI] [Google Scholar]
- Sing K. S. W. Reporting physisorption data for gas/solid systems with special reference to the determination of surface area and porosity. Pure Appl. Chem. 1982, 54, 2201–22l8. 10.1351/pac198254112201. [DOI] [Google Scholar]
- Barrett E. P.; Joyner L. G.; Halenda P. P. The determination of pore volume and area distributions in porous substances. I. Computations from nitrogen isotherms. J. Am. Chem. Soc. 1951, 73, 373–380. 10.1021/ja01145a126. [DOI] [Google Scholar]
- Brinker C. J.; Kirkpatrick R. J.; Tallent D. R.; et al. NMR confirmation of strained “Defects” in amorphous silica. J. Non-Cryst. Solids 1988, 99, 418–428. 10.1016/0022-3093(88)90448-6. [DOI] [Google Scholar]
- Joo S. H.; Ryoo R.; et al. Structural study of mesoporous MCM-48 and carbon networks synthesized in the spaces of MCM-48 by electron crystallography. J. Phys. Chem. B 2002, 106, 1256–1266. 10.1021/jp0131875. [DOI] [Google Scholar]
- Schumacher K.; Ravikovitch P. I.; Chesne A. D.; Neimark A. V.; Unger K. K. Characterization of MCM-48 materials. Langmuir 2000, 16, 4648–4654. 10.1021/la991595i. [DOI] [Google Scholar]
- Kleitz F.; Berube F.; Gullet-Nicolas R.; Yang C. M.; Thommes M. Probing adsorption, pore condensation, and hysteresis behavior of pure fluids in three-dimensional cubic mesoporous KIT-6 silica. J. Phys. Chem. C 2010, 114, 9344–9355. 10.1021/jp909836v. [DOI] [Google Scholar]
- Bird G. A.Molecular Gas Dynamics and the Direct Simulation of Gas Flows; Oxford University Press, 1994. [Google Scholar]
Associated Data
This section collects any data citations, data availability statements, or supplementary materials included in this article.