

ABSTRACT
Altered expression levels of protein-coding genes and microRNAs have been implicated in the pathogenesis of Huntington’s disease (HD). The involvement of other ncRNAs, especially long ncRNAs (lncRNA), is being realized recently and the related knowledge is still rudimentary. Using small RNA sequencing and PCR arrays we observed perturbations in the levels of 12 ncRNAs in HD mouse brain, eight of which had human homologs. Of these, Meg3, Neat1, and Xist showed a consistent and significant increase in HD cell and animal models. Transient knock-down of Meg3 and Neat1 in cell models of HD led to a significant decrease of aggregates formed by mutant huntingtin and downregulation of the endogenous Tp53 expression. Understanding Meg3 and Neat1 functions in the context of HD pathogenesis is likely to open up new strategies to control the disease.
KEYWORDS: Huntington’s disease, long ncRNA, MEG3, NEAT1
Introduction
Huntington’s disease is a rare, autosomal dominant neurodegenerative disorder caused by expansion of polymorphic CAG repeats at exon1 of the gene Huntingtin (HTT) [1].The disease is characterized by behavioral and psychiatric abnormalities, dementia, motor defects and choreatic movements due to random muscle contractions [2]. Increase in length of glutamine (Q) stretch at N-terminal of HTT due to the expansion of CAG repeats alters the conformation of HTT leading to cytoplasmic and nuclear aggregates. Over the years, alterations of various cellular processes like transcription, excitotoxicity, axonal transport, proteasomal degradation, autophagy, and apoptosis; cellular conditions like oxidative stress, endoplasmic reticulum stress, and mitochondrial dysfunctions have been implicated in HD [3]. Altered levels of protein-coding genes in HD, identified in diverse models of HD and different tissues including post-mortem brains of HD patients and enrichment of different biological pathways indicate that these alterations could contribute to HD pathogenesis. Altered levels of genes were identified at an early stage before the neurodegeneration started and is considered to be a hallmark for HD. Modified interactions of transcription factors with wild-type HTT, direct binding of mutant HTT with DNA and epigenetic changes could contribute to the deregulation of genes in HD [4,5]. Differential levels of microRNA (miRNA), generally a negative regulator of a protein-coding gene, has also been identified in HD models and post-mortem brains of HD patients and other neurodegenerative diseases [4–16]. In cellular models, some of these miRNAs have been shown to modulate neuronal survival [9], disease progression by influencing neurogenesis [10], cell cycle [11–13], mitochondrial dynamics [14] and target HTT [16]. Age at onset of HD has been correlated with levels of miR10b [5,6]. Thus miRNA could also contribute to the altered expression of protein-coding genes and may modulate HD pathogenesis by targeting protein-coding genes including HTT [7,16].
In recent years, long ncRNA (lncRNA), defined as single-stranded RNA > 200 nucleotides long without potential for coding proteins, has emerged as the regulator of transcription [17,18], cellular homeostasis [19], immune cell development [20] and other biological processes possibly by interacting with proteins and RNA [21]. It is thus possible that altered levels of lncRNAs contribute to the deregulation of genes observed in HD and modulate HD pathogenesis. Altered levels of lncRNA have been observed in neurological diseases [22,23]. It has been shown that levels of 2010001M06Rik/Abhd11os (designated as ABHD11-AS1 in human) are reduced in the striatum of mouse R6/2 models of HD [24]. Exogenous levels of Abhd11os protects against the toxic effects of N-terminal mutant HTT in mouse, while the loss of Abhd11os enhances the toxicity, although the mechanism is still elusive [25]. Re-analysis of gene expression data in HD identifies seven long ncRNAs (TUG1, LINC00341, RPS20P22, NEAT1, MEG3, DGCR5, and LINC00342), of which only NEAT1 shows overexpression. Putative promoter regions of NEAT1, MEG3, and DGCR5 genes harbor binding sites of REST/NRSF, a transcription repressor [26]. Human accelerated region 1 ncRNA (HAR1) is repressed by REST and is down-regulated in postmortem brains of HD patients [27], although the functional consequence of decreased HAR1 in HD remains unknown. Levels of natural antisense HTT (HTT-AS1), a lncRNA localized in the nearby upstream region of HTT, depends on the CAG repeat numbers in the HTT gene and mutated HTT reduces levels of HTT-AS1. Decreased levels of HTT-AS1 results in higher levels of HTT indicating its possible role in HD pathogenesis [28]. Increased levels of NEAT1 have been recently reported in human brains of HD patients and R6/2 mice. Exogenous levels of short isoforms of NEAT1 protect cells from death induced by H2O2 [28]. Considering the thousands of lncRNAs coded by human genome and their possible roles in brain development and plasticity [29,30] and many other HD associated processes, it is expected that lncRNAs, might be involved in HD pathogenesis.
The aim of the present study is to identify altered levels of lncRNAs in mouse HD model and understanding the regulatory roles of lncRNAs in the HD disease model.
Results
Altered levels of ncRNAs in the mouse model of HD
We compared the small RNA sequence data from the cortex of R6/2 mice at ages of 6 weeks (early stage of HD) and 8 weeks and age-matched control mice. Excluding the sequence data that aligned to annotated miRNA in the mouse genome, we focused on the rest of the aligned sequences for other ncRNA. It was observed that sequences were aligned against the annotated ncregions with sufficient depth. Levels of Xist (X inactive specific transcript), Peg3os and Meg3 (maternally expressed gene 3) were increased and levels of Snora21, Snord53, Snhg12, and Vaultrc5 were decreased significantly in the cortex of 6-week old mice compared to the control (Figure 1). Levels of Meg3, Xist, and additional genes Snord42a, Gm12238 and Neat1 (Nuclear Paraspeckle Assembly Transcript 1) were significantly increased in the 8-week old mice compared to control. In the older mice, however, levels of Vaultrc5 and additional genes Gm38671, Gm22650, and Snord85 decreased significantly. Combining the results, we observed that levels of Meg3 and Xist were increased and the level of Vaultrc5 was decreased in both early and late stage of HD, the level of Peg3os was increased and the levels of Snhg12, Snora21, Snord53 were decreased in the early stage of HD. The levels of Neat1, Gm12238, Snord42a (increased), Snord85/Snord103, Gm22650, and Gm38671 (decreased) altered in the late stage of HD (Figure 1).
Figure 1.

Heatmap of statistically significant differentially regulated ncRNAs Xist(NR_001463), Meg3(NR_003633), Peg3os(NR_023846), Vaultrc5(NR_027885),Snora21 (NR_028078),Gm12238(NR_028480),Snord53(NR_028551),Snord85(NR_028565),Snhg12(NR_029468),Snord42a(NR_037682),Gm22650(NR_128564),Gm38671(NR_128567),Neat1(NR_131212) in 6 weeks (early stage) and 8 weeks (late stage) old Huntington’s mouse cortex compared to the control cortex from small RNA sequencing. Each sample has at least two biological replicates. Color codes indicate normalized fold changes- Red = upregulation; Green = downregulation.
To identify the human orthologs of these ncRNAs, we searched the NCBI database (https://www.ncbi.nlm.nih.gov/gene/) and found that 8 of the 13 mouse ncRNAs namely Meg3, Xist, Neat1, Snhg12, Snora21 Snord53, Snord85, Snord42a had human orthologs (Table 1).
Table 1.
Summary of the levels of ncRNAs in different models of HD.
| Noncoding RNA (Entrez ID) | Human homolog | Levels in |
|||
|---|---|---|---|---|---|
| The cortex of R6/2 (6week) | The cortex of R6/2 (8week) | STHdhQ111/HdhQ111 | STHdhQ7/HdhQ7 Cells transfected with 83Q |
||
| Brip1os (74,038) | No | - | - | ||
| Meg3 (17,263) | Meg3 | - | - | ||
| Xist (213,742) | Xist | - | - | ||
| Neat1 | Neat1 | - | |||
| Snhg3 | Snhg3 | - | - | - | - |
| Snhg12 (ID: 10,003,986) | Snhg12 | - | - | ||
| Snora21 (100,302,498) | ACA21 | - | - | - | |
| Snord53 | snoRNA U53 | ||||
| Snord85/Snord103 | Snord85/Snord103 | - | - | ||
| Vaultrc5 | No | ||||
Validation of the results in animal and cell models of HD using real-time PCR
To validate the data obtained in small RNA sequencing the levels of Meg3, Neat1, Xist, Snhg12, Snora21, Snord53, Snord85, Vaultrc5 ncRNAs and those of additional ncRNAs (Snhg3 and Brip1os) whose levels were not altered were checked using real-time PCR and gene-specific PCR primers (Supplementary Table 1). Results shown in Figure 2(i), panels A and B, revealed that out of 10 ncRNAs tested, levels of 9 ncRNAs Meg3, Xist, Neat1, Snhg12, Snora21, Snord53, Snord85, and Vaultrc5 and Snhg3 were in concordance with the data obtained by sequencing in 6-week old mice. Levels of Brip1os increased significantly in this assay for 6-week old mice, while it was unaltered in the sequencing data. In 8-week old R6/2 mice, levels of Meg3 was increased in sequencing data while remaining unaltered in real-time PCR assay. Levels of all other 9 ncRNAs were in concordance with the sequencing data. Results obtained from sequencing data analysis, in general, was conforming to the low throughput PCR based assay. (Figure 2(i), panels C and D).
Figure 2.

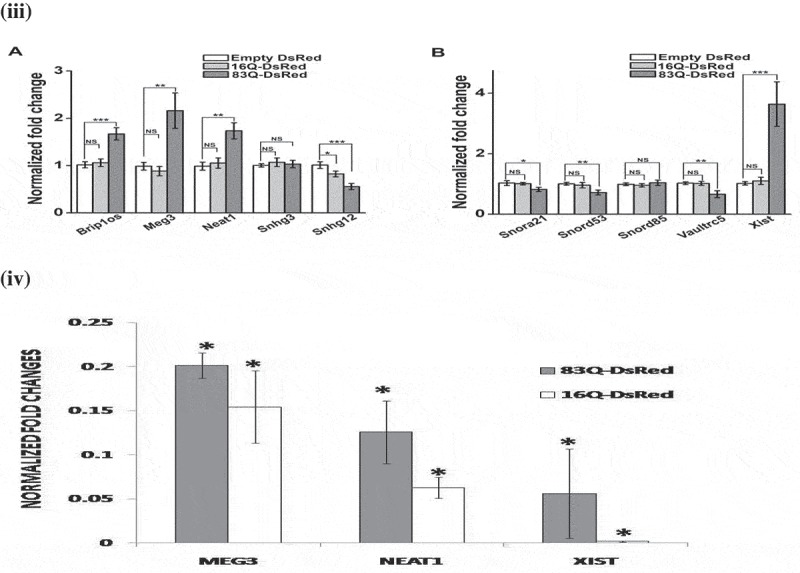
Altered levels of ncRNAs in HD animal model and in cells expressing N-terminal mutant Huntingtin. (i). Bar graphs representative of three (n = 3) independent experiments measuring levels of Brip1os, Meg3, Neat1, Snhg3and Snhg12 (panels A and C); Snora21, Snord53, Snord85, Vaultrc5 and Xist (panels B and D) by qRT-PCR in cortex region of 6-weeks old (panels A and B) and 8-weeks old (panel C and D) R6/2 mice and age-matched wild-type mice. (ii).Bar graphs representative of three (n = 3) independent experiments measuring levels of Brip1os, Meg3, Neat1, Snhg3and Snhg12 (panel A); Snora21, Snord53, Snord85, Vaultrc5 and Xist (panel B) by qRT-PCR in mouse immortalized striatal cells expressing full-length huntingtin (Hdh) gene with 7 (STHdhQ7/HdhQ7 cells) and 111 (STHdhQ111/HdhQ111cells) glutamine repeats.(iii) Bar graphs representative of three (n = 3) independent experiments measuring levels of Brip1os, Meg3, Neat1, Snhg3and Snhg12 (panel A); Snora21, Snord53, Snord85, Vaultrc5 and Xist (panel B) by qRT-PCR in STHdhQ7/HdhQ7 cells transiently expressing empty DsRed vector or huntingtin exon 1 having 16 and 83 glutamine repeats cloned in DsRed vector (designated as 16Q-DsRed and 83Q-DsRed respectively). Levels of β-actin were taken as endogenous control. The levels of individual ncRNAs were normalized by the corresponding β-actin levels. Fold change was calculated by considering the relative levels of ncRNA in empty vector (DsRed) transfected cells (control) to be 1.(iv) Bar graphs representative of three (n = 3) independent experiments measuring levels of Meg3, Neat1, and Xist) by qRT-PCR in Neuro2A cells transiently expressing huntingtin exon 1 having 16 and 83 glutamine repeats cloned in DsRed vector (designated as 16Q-DsRed and 83Q-DsRed respectively). Levels of β-actin were taken as endogenous control. The levels of individual ncRNA were normalized by the corresponding β-actin levels. Error bars indicate ± SD. The statistical significance level between different experimental pairs is indicated (NS, not significant; *, p < 0.05; **, p < 0.01; ***, p < 0.001).
Validation of the differential gene expressions in cell models
We further used different cell models of HD to validate the observations from mouse R6/2 model. STHdhQ7/HdhQ7cells had been established from wild-type (Q7/7) Hdh knock-in mice which expressed full-length HTT with 7 Glu (Q) residues (wild-type HD) endogenously. STHdhQ7/HdhQ7cells were used for control, while STHdhQ111/HdhQ111 cells, expressing endogenous full-length mutant HTT gene with 111Glu (Q) residues, were used as HD cells. This cell model, described earlier [30], had been used widely to identify the molecular mechanism of HD pathogenesis. The results revealed that except for Snhg12 and Xist, levels of all other genes in STHdhQ111/HdhQ111 cells compared to control cells were similar to that observed in the R6/2 mouse model. (Figure 2(ii)).
STHdhQ7/HdhQ7cells transfected with N-terminal HTT with 83Q (83Q-DsRed) was also used as an alternative cell model of HD [31]. We also used STHdhQ7/HdhQ7cells expressing wild-type N-terminal HTT with 16Q (16Q- DsRed) coded by exon1 of wild-type HTT. Levels of wild-type N-terminal HTT did not alter the levels of the genes tested in comparison with STHdhQ7/HdhQ7cells except for Snhg12. In 83Q-DsRed expressing cells, levels of Brip1os, Meg3, Xist, and Neat1 were increased and levels of Snord53, Snhg12, Snora21, and Vaultrc5 were decreased (Figure 2(iii)). The decrease in Snord85 level was not significant. Moreover, the levels of Meg3, Neat1, and Xist were also checked (by qRT-PCR) in Neuro2A (mouse neuroblastoma) cells transiently expressing 16Q-DsRed and 83Q-DsRed. Meg3, Neat1, and Xist levels were significantly increased (Figure 2(iv)). In summary, levels of Snord53 and Vaultrc5 were decreased in all the models, levels of Meg3 and Neat1 were increased in 3 models and levels of Brip1os and Xist were increased in 2 models of HD. Summary of all the results is shown in Table 1.
Figure 2.
Continued.
Meg3 and Neat1 enhance aggregation of mutant N-terminal HTT in cell models of HD and stabilize Tp53
To determine the role of Meg3 and Neat1 in the formation of aggregates of mutant HTT coded by exon1, we used commercially available siRNAs against Meg3 and Neat1 for transiently knocking down Neat1 and Meg3 in mouse Neuro2a and human SHSY5Y cells. It was observed that both the siRNAs reduced the levels of endogenous Meg3 and Neat1 significantly in both cell lines (Supplementary Figure 1) in comparison to untransfected control. Co-transfection of 83Q-DsRed and siRNA specific for Neat1 or Meg3 resulted in decreased intracellular aggregates of 83Q-DsRed in both the cell lines (Figure 3). A counter staining with DAPI showed that these intracellular aggregates specifically were in the cytoplasm and not in the nucleus. In summary, Meg3 and Neat1 directly or indirectly modulated the formation of aggregates of mutant HTT.
Figure 3.

Continued.
Figure 3.
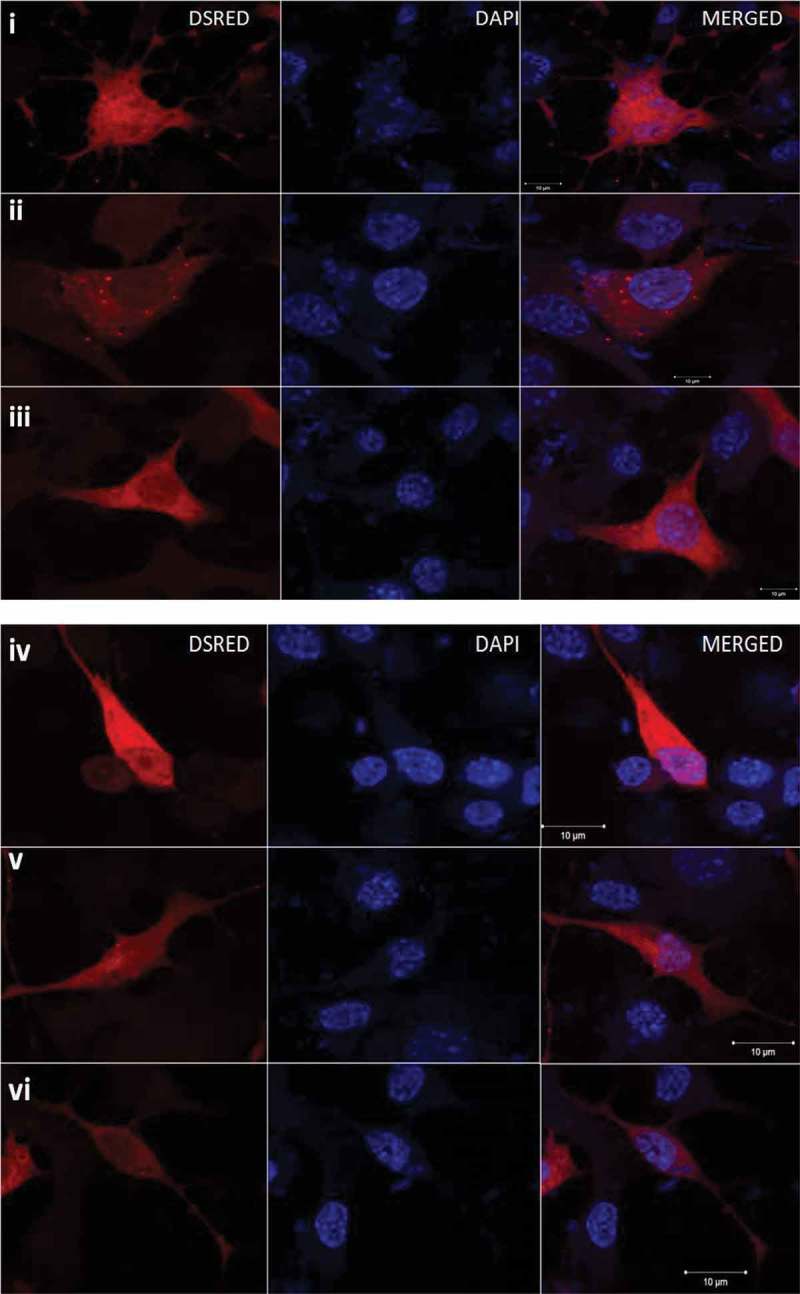
Reduction in the numbers of HTT-83Q-DsRed aggregates in Neuro2A and SHSY5Y cells. (i) & (iv) HTT-83Q-DsRed aggregates in Neuro2A and SHSY5Y cells respectively, (ii) & (v) HTT-83Q-DsRed aggregates in Neuro2A and SHSY5Y cells respectively co-transfected with siRNA against Neat1 (iii) & (vi) HTT-83Q-DsRed aggregates in Neuro2A and SHSY5Y cells respectively co-transfected with siRNA against Meg3. All representative images were acquired 24 hours post-transfection.(vii) Bar graphs representative of three (n = 3) independent experiments, taking 30 cells each time shows the decrease in aggregate numbers per cell in cells transfected with HTT-83Q-DsRed and treated with siRNAs against Meg3 or Neat1 compared to cells transfected with HTT-83Q-DsRed only. Error bars represent standard deviation, *represents statistical significance (*p ≤ 0.05; **p ≤ 0.01).
We compared the steady-state levels of TP53 in Neuro2A cells transiently expressing 83Q-DsRed. When 83Q-DsRed was co-transfected with siRNAs against Meg3 or Neat1, the steady-state levels of Tp53 decreased significantly compared to the control (Figure 4). It was observed that knocking down both lncRNAs even in the absence of 83Q- DsRed had significant effects on steady-state Tp53 levels. In both knockdown cases, Tp53 levels decreased. However, the decrease in Tp53 levels in Meg3 knockdown was more pronounced than that in Neat1 knocked down cells in the presence as well as the absence of 83Q-DsRed. Thus levels of Tp53 could be modified by Meg3 or Neat1 directly or indirectly.
Figure 4.
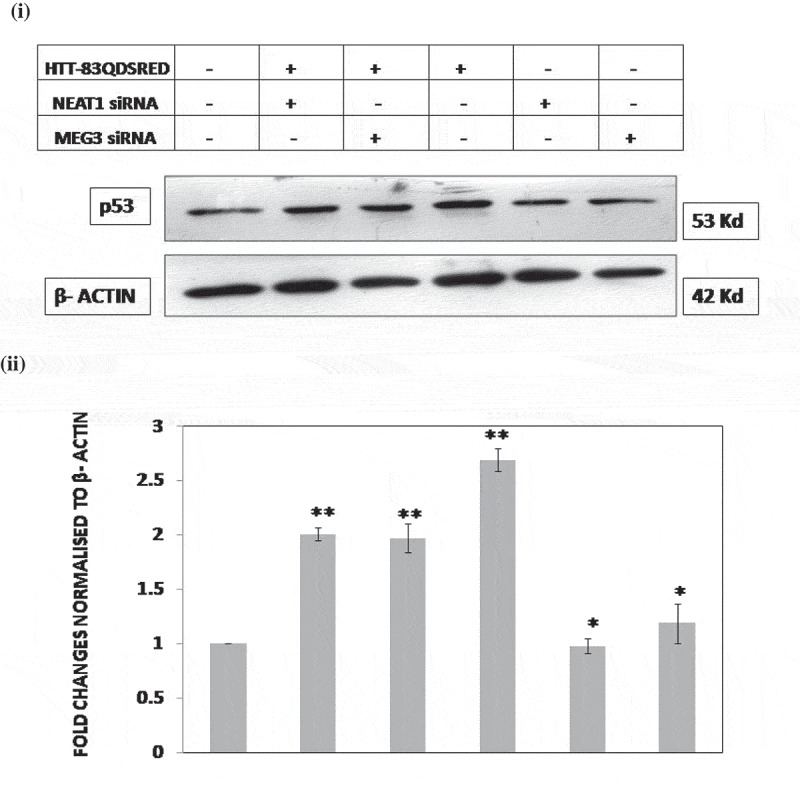
Endogenous p53 protein levels alter after treatment with siRNA against Meg3 or Neat1 in HD cell model. (i) Representative western blot of three independent experiments (n = 3) shows (Left to Right) decrease in endogenous levels of p53 in wild-type (WT) Neuro2A cells, Neuro2A cells co-transfected with HTT-83Q-DsRed and siRNA against Meg3 or Neat1, Neuro2A cells transfected with HTT-83Q-DsRed only and Neuro2A cells transfected only with siRNA against Meg3 or Neat1 without HTT-83Q-DsRed, 24 hours post-transfection.(ii) Histogram representing the fold changes of p53 in the different conditions compared to WT cells in (i) normalized to β-actin. Fold change was calculated by considering the relative levels of p53 in WT cells (control) to be 1. Error bars represent standard deviation, *represents statistical significance (*p ≤ 0.05; **p ≤ 0.01).
Interactions of MEG3, NEAT1, and XIST with protein-coding genes and microRNA
Extending the paradigm that protein-coding genes carry out their functions by interacting with other proteins [32,33] for lncRNAs, we attempted to derive functions of lncRNAs from functions of their interacting partners. lncRNAs are known to interact with many proteins, microRNAs (miRNA) and mRNAs [21] that are cataloged in the database NPInter [34] based mainly from published high throughput experimental data, as described in materials and methods. To identify the possible functional roles of Meg3, Neat1, and Xist that were increased in HD models, we enlisted the interacting partners of these genes from the NPInter database (Table 2), detailed in Supplementary data SD5A and SD5B. Evidently more data was available for interactions with human genes compared to that known for mouse genes probably due to less number of studies in the mouse. Human MEG3 was found to interact with 11 proteins, while mouse Meg3 was found to interact with 6 proteins; interactions of Tp53 and UPF1 were common, indicating that these interactions were conserved between the species. MEG3 was found to interact with 13 human miRNAs and mouse Meg3 with 3 miRNAs.
Table 2.
Summary of protein and miRNA interactions of ncRNAs Meg3, Neat1, and Xist.
| Noncoding RNA | Total number of interacting partners in |
No of a different category of genes in human |
||
|---|---|---|---|---|
| Human | Mouse* | Protein | MicroRNA | |
| MEG3 | 26 | 9 | 11 | 15 |
| NEAT1 | 2577 | 264 | 2265 | 312 |
| XIST | 546 | 88 | 21 | 525 |
Enrichment of biological processes and pathways with MEG3, NEAT1, and XIST interacting proteins
To identify possible functions of MEG3, NEAT1, and XIST, we carried out an enrichment analysis of their protein interacting partners using GeneCodis3. It was observed that 280 biological processes defined by Gene Ontology were enriched significantly (p ≤ 0.05) after multiple testing correction (Supplementary Data SD6A). The most significant biological process was the regulation of DNA dependent transcription, (GO: 0006355); enriched with 229 proteins. This result showed that MEG3, NEAT1, and XIST with its protein interacting partners might be involved in regulation of transcription. Other representative biological processes that were significantly enriched are shown in Figure 5.
Figure 5.

Comparison of Biological processes in noncoding RNA interacting proteins (dark black) and in human Genome (light black). GO ID is shown within parenthesis, except for Regulation of transcription (GO: 0006355) and Nuclear mRNA splicing (GO: 0000398). Levels of significance after multiple testing between the two as determined in the GeneCodis3 analysis are: 1.39E−27, 3.67E−16, 1.52E−15, 2.89E−15, 1.69E−13, 1.83E−13, 1.69E−09, 1.69E−09, 1.55E−07, 1.13E−06, 2.15E−06 and 2.72E−06 respectively from left to right.
Further, GeneCodis3 revealed that 101 KEGG pathways (Supplementary Data SD6B) and 43 PANTHER (Supplementary Data SD6C) were enriched with protein interacting partners of MEG3, NEAT1, and XIST. Among these, Endocytosis, Huntington’s disease, and Ubiquitin-mediated proteolysis pathways were the top hits. Others included Regulation of actin cytoskeleton, Insulin signaling, Neurotrophin signaling, MAPK signaling, mRNA surveillance, Spliceosome, Ribosome and Proteasome, all having significant p-values (p ≤ 0.0002) after multiple test correction. Among pathways described by PANTHER the topmost significantly enriched were Heterotrimeric G-protein signaling pathway, Gi alpha and Gs alpha-mediated pathway, Integrin signaling pathway, PI3 kinase pathway, p53 pathway, Inflammation mediated by chemokine and cytokine signaling pathway, PDGF signaling pathway, Insulin/IGF pathway, protein kinase B signaling cascade and Huntington’s disease pathway
Huntington’s disease pathway (KEGG: 05016 and PANTHER: P00029): probable involvement of MEG3, NEAT1, and XIST in HD pathogenesis
Significant over-representation of protein interacting partners of MEG3, NEAT1 and XIST in Huntington’s disease pathways described by both KEGG and PANTHER placed these lncRNAs as new players involved in HD pathogenesis by modulating the HD pathway. Huntington’s disease pathway in KEGG had 180 proteins and PANTHER had 126 proteins. 36 proteins were enriched in KEGG HD pathway and 21 proteins were enriched in the PANTHER HD pathway of which 49 were unique. NEAT1 showed interaction with all 49 proteins including TP53, while MEG3 showed interaction with TP53 only.
Relevance for NEAT1 and MEG3 interacting protein partners in HD pathway was further evident from their involvement in transcription deregulation in postmortem brains [35,36] and induced pluripotent stem cells (iPSCs) derived from HD patients [37]. Among the 49 unique genes associated with HD pathway and coding for NEAT1 and MEG3 interacting proteins, no data for altered expression in HD was available for 20 genes; levels of 19 genes were decreased; levels of 6 genes were increased while levels of 4 genes increased in one experiment and decreased in the other [35–37]. Altered levels of 29 genes that coded for NEAT1 and MEG3 interacting proteins and discovered through large-scale microarray or RNA sequencing of HD tissues (Table 3), revealed that NEAT1 and MEG3 might be associated with altered HD pathway.
Table 3.
Expression of genes in HD associated with Huntington’s disease pathway (KEGG: 05016 and PANTHER: P00029) and coded for protein interacting partners of NEAT1 or MEG3.
| Increased | Decreased | Opposite trend | Not identified (unknown) |
|---|---|---|---|
| ARPC1B, CREB3, NCOR2, PLCB3, POLR2H TP53 (6) | AP2A1, ARF3, ARPC1A, ARPC5L, ATP5G1, COX6B2, COX6C, CREB3L4, CYC1, DCTN2, DLG4, GAPDHS, GRIK5, GRIN1, GRIN2D, NDUFA3,NDUFB10, NDUFB2, POLR2E (19) | ACTG1, CLTB, DYNLL2 TUBB3 (4) | ATP5E, AKT1, AP2S1, BAX, BBC3, COX7A1, CREB3L3, DNAH2, NDUFA13, NDUFA4L2, NDUFB7, NDUFS6, NDUFS8, NDUFV3, POLR2I, POLR2J, POLR2J2, POLR2J3, SIN3A TUBB1 (20) |
Interacting partners of MEG3, NEAT1, and XIST associated Huntington’s disease pathways (KEGG: 05016 and PANTHER: P00029) are also co-expressed
Co-expression, a statistical correlation between the expressions of two genes in similar levels in the same direction (increase or decrease) in diverse conditions and in a large number of samples, can be used to assign putative functions to poorly annotated genes. Co-expressed genes are likely to be regulated by the same transcription factors/regulators and might have similar functions, possibly through physical interactions of the protein products of the co-expressed genes. Identification of genes co-expressed with MEG3, NEAT1 or XIST should provide additional functional information about the lncRNAs. We utilized search options for microarray-based results in GeneFriends database. In this analysis we considered only the positively correlated genes; increase in expression of the lncRNA was correlated with an increase in the expression of the co-expressed genes. A summary of the list of co-expressed genes retrieved from this database is shown in Table 4 (details in Supplementary Data SD7A-SD7C). It was observed that MEG3 co-expressed with more than 5000 genes with co-expression value ≥ + 0.5. MEG3 co-expressed with GRIK5, GRIN1, DLG4, COX7A1, TP53 and other 42 genes known to be involved in HD pathway. It would be interesting to mention that MEG3 has also been known to physically interact with TP53 as discussed. NEAT1 co-expressed in the same direction with many lncRNAs like INE1, LINC00312, HCG4B, LINC00663, LINC00574, LINC00472 and others including NEAT1 and XIST. Role of other lncRNAs co-expressed with MEG3 remains unknown. Increased expressions of MEG3, NEAT1, and XIST, increased in our experiments indicated that these 3 lncRNAs might be regulated by the same transcription factors.
Table 4.
Summary of co-expressed genes of MEG3, NEAT1, and XIST.
| Long ncgenes | No of genes with Pearson coefficient (Co-expression value) ≥ + 0.2 | No of genes with Pearson coefficient (Co-expression value) ≥ + 0.5 |
|---|---|---|
| MEG3 | 17,993 | 5054 |
| NEAT1 | 14,709 | 126 |
| XIST | 14,310 | 2 |
NEAT1 co-expressed with many genes including ARPC1B, TP53, NDUFA4L2, BAX, COX7A1, TUBB1, AKT1, CLTB, ARPC1A, PLCB3, BBC3, CREB3, POLR2E, CYC1, POLR2J, NDUFS6, DLG4, and others (Supplementary Data SD7A) associated with HD pathway (Table 5). Other than XIST and MEG3, NEAT1 co-expressed with many other lncRNAs. Whether these co-expressed lncRNAs might also be involved in HD could be anybody’s guess. Many genes co-expressed with XIST were also associated with HD pathway (Table 5). This result indicated that MEG3, NEAT1, XIST and these common 37 genes were likely to be regulated by the similar transcription machinery and together might participate in the same biological processes and pathways.
Table 5.
MEG3, NEAT1 and XIST interacting protein enriched with HD pathway.
| Gene | Interacting protein (total number) | Co-expressed (total number, the range of Pearson’s coefficient) |
|---|---|---|
| NEAT1 | COX6B2, CREB3L3, SIN3A, NDUFB10, POLR2J2, NDUFV3, POLR2J3, AP2A1, ACTG1, DYNLL2, ARPC1B, TP53, NDUFA4L2, BAX, COX7A1, TUBB1, AKT1, CLTB, ARPC1A, PLCB3, BBC3, CREB3, POLR2E, CYC1, POLR2J, NDUFS6, DLG4, ARPC5L, COX6C, GRIN2D, TUBB3, ARF3, ATP5G1, GAPDHS, ATP5E, NCOR2, AP2S1, POLR2H, GRIK5, NDUFB7, DCTN2, NDUFA13, POLR2I, NDUFB2, DNAH2, GRIN1, NDUFA3, NDUFS8, CREB3L4 (49) | ARPC1B, TP53, NDUFA4L2, BAX, COX7A1, TUBB1, AKT1, CLTB, ARPC1A, PLCB3, BBC3, CREB3, POLR2E, CYC1, POLR2J, NDUFS6, DLG4, ARPC5L, COX6C, GRIN2D, TUBB3, ARF3, ATP5G1, GAPDHS, ATP5E, NCOR2, AP2S1, POLR2H, GRIK5, NDUFB7, DCTN2, NDUFA13, POLR2I, NDUFB2, DNAH2, GRIN1, NDUFA3, NDUFS8, CREB3L4 (39, 0.455–0.24) |
| MEG3 | TP53 (1) | COX7A1, DLG4, NDUFA4L2, GRIK5, GRIN1, GRIN2D, TUBB3, GAPDHS, TUBB1, CLTB, ARF3, NCOR2, BBC3, CREB3, DNAH2, PLCB3, DCTN2, TP53, AKT1, POLR2I, NDUFB7, ARPC1A, ATP5G1, NDUFA3, ARPC5L, COX6C, ARPC1B, NDUFA13, POLR2E, NDUFB2, BAX, AP2S1, CYC1, NDUFS6, NDUFS8, POLR2H, POLR2J, ATP5E, CREB3L3, COX6B2, AP2A1, POLR2J2 (42, 0.577–0.205) |
| XIST1 | None | COX7A1, NDUFA4L2, TP53, GAPDHS, ARPC1B, TUBB1, GRIK5, GRIN2D, DLG4, BBC3, BAX, TUBB3, CREB3, CLTB, ATP5G1, GRIN1, NDUFA3, DNAH2, AKT1, POLR2I, ARPC1A, ARF3, CYC1, COX6C, NDUFA13, PLCB3, POLR2E, NCOR2, NDUFB7, NDUFS6, DCTN2, ARPC5L, AP2S1, POLR2H, POLR2J, NDUFB2, ATP5E, NDUFS8, CREB3L3, COX6B2 (40, 0.385–0.205) |
Transcription regulation of NEAT1, MEG3, and XIST
Levels of lncRNAs are regulated by transcription factors (TFs), similar to that observed for protein-coding genes. Estrogen receptor alpha ERα [38] and TP53 [39] were reported to bind to the putative promoters of NEAT1 and regulated its levels in prostate cancer cells and leukemic cells, respectively. In a hypoxic condition, HIF-2α activated the expression NEAT1 and enhanced cell growth [40]. YY1 was seen to bind to the putative promoters of XIST and regulated its expression [41]. To identify additional transcription factors that could bind within 5 Kb upstream sequences of NEAT1, MEG3, and XIST, we utilized the database http://deepbase.sysu.edu.cn/chipbase/that cataloged ChiP data [42]. It has been observed that three transcription factors namely HEY1, HNF4A, NRSF could bind to the putative promoters of these lncRNAs. It remained to be found out whether such binding could activate or represse the expression. Summary of the results is shown in Table 6.
Table 6.
Transcription factors that bind within 5 Kb upstream sequences of NEAT1, MEG3, and XIST.
| NcRNA | No of TF binds 5Kb Upstream sequence | Representative TF |
|---|---|---|
| NEAT1 | 86 | E2F1, E2F4, E2F6, ERalpha, GATA2, HEY1, HNF4A, HSF1, Myc, NFKB, NRSF, p300, p63, p68, TCF7L2, YY1 |
| MEG3 | 15 | AR, CDX2, CTCF, E2F4, ERalpha, FOXH1, GATA6, HEY1, HNF4A, NRSF, p300, SETDB1, SMAD3, SMAD4, ZNF263 |
| XIST | 14 | c-Myc, CTCF, EWS_ERG, GTF2B, HEY1, HNF4A, NANOG, NFKB, NRSF, Pbx3, POU2F2, Rad21, SP1, TAF1 |
Discussion
In the present study, we analyzed the small RNA sequencing data in a mouse model of HD, designed originally to identify differential expression levels of miRNA. Such customized analysis identified differentially expressed ncRNAs other than miRNA that was subsequently validated using low throughput assays in an animal model and two cell models of HD. Knockdown of Meg3 and Neat1 modulated the aggregation of mutant HTT and decreased the levels of Tp53. Using various databases that catalog interacting partners and co-expressed genes of Meg3, Neat1, and Xist, we observed that protein interacting partners and co-expressed protein-coding genes of Neat1 were associated with Huntington’s disease pathways. Taking these together, we have provided evidence in support of the involvement of Meg3 and Neat1 in HD pathogenesis.
Additional lines of evidence implicating Meg3 and Neat1 in HD pathogenesis include: (i) altered levels of Meg3, Neat1 and Xist altered in R6/2 mice and various cell models of HD, (ii) loss of function of Meg3 and Neat1 modulated aggregate formation of mutated N-terminal HTT, coded by exon1 of HTT in cell models of HD, and concurrently modulated of Tp53 levels (iii) identification of protein interacting partners of NEAT1, MEG3 and XIST were enriched with biological processes and pathways known to be involved in HD,(iv) expressions of more than 50% of NEAT interacting proteins associated with HD pathway that were altered in HD brains and (v) co-expression of NEAT1 interacting protein partners associated with HD pathways with NEAT1.
MEG3 is expressed in many normal human tissues, with the highest observed expression in the pituitary gland followed by different regions of the brain (http://www.gtexportal.org/home/gene/MEG3). Mining the existing microarray data, levels of MEG3 has been reported to be decreased in HD [25], although this has not been validated by low throughput assays. In R6/2 mice, Meg3 was increased in the early stage (6 weeks) and continued to increase up to 8 weeks (late stage). In other cellular models also increased levels of Meg3 could be observed. Differences between the results obtained in this study and those reported earlier [25] could be due to the differences in species or techniques used. Increased levels of NEAT1 have been reported earlier by data mining [25] and also in models of HD and postmortem samples from HD patients [43]. We identified similarly increased levels of Neat1 in the late stage of HD (8 weeks) in R6/2 mice and in several cell models of HD. To the best of our knowledge, alterations in the levels of Xist in HD has not been reported yet.
Decreased aggregates of mutant N-terminal HTT observed in cells, where endogenous Meg3 or Neat1 has been knocked down, could be explained by effects of Meg3 or Neat1 on the levels of Tp53. Meg3 is known to stabilize Tp53 by interacting with it. Increased levels of Tp53 could also be mediated through destabilization of MDM2 by interacting with Meg3 [38–40]. Binding of Tp53 at −3485 of TSS of MEG3 (chromosomal position 100,775,826–100,776,022) has been identified [42] although it remains unknown whether such binding activates the transcription of MEG3.
NEAT1 has two isoforms, the shorter variant NEAT1_1, also known as MENepsilon is 3756 bp long, while the longer variant NEAT1_2, also known as MENbeta is 22,743 bp long. Both the isoforms are conserved at the 5ʹ-end and are also observed in mouse. The longer isoform NEAT1_2, which is mostly localized in the nucleus, acts as a scaffold of RNAs and RNA binding proteins to form nuclear bodies known as ‘paraspeckles’. Although present in lower abundance, the PCR primers that we used to detect the levels of NEAT1 detected a region from the longer isoform. Our results indicated that the reduction of Neat1 reduced the levels of Tp53 which further indicated that Neat1 might interact with Tp53 and alter its stability. However, NEAT1 has been shown to bind active chromatin sites near Tp53 genes along with other genes [34]. Tp53 directly regulates the transcription of Neat1 by binding to the promoter of the gene [44,45]. Levels of Neat1 and Tp53 are thus under the control of a feedback loop. MEG3, NEAT1, and XIST can interact with many miRNAs possibly through sequence complementarity. Interaction of lncRNAs with miRNAs may contribute to functional deregulation of target mRNAs of those miRNAs by reducing their effective levels by acting as a ‘sponge’ or as a competitor for binding with the target mRNAs [34]. Due to the miRNA- lncRNA interactions, the stability of lncRNAs might also be compromised leading to their silencing [46]. Levels of miR-132, miR-221, miR-222, and miR-9 have been reported to decrease in various models of HD as well as in HD postmortem tissues [6]. Levels of miR-125b, miR-146a, miR-150 are reduced in cell and animal models of HD [6,41]. NEAT1 interacts with these miRNAs thereby contributing to the HD pathogenesis.
It has been shown earlier that inhibition of proteasomal degradation increased the levels of Neat1, with a concomitant increase in length and size of nuclear paraspeckles. Cytoplasmic and nuclear aggregates with ubiquitinated proteins are also identified in this condition [47]. Given that proteasomal degradation is compromised [48–51] and levels of Neat1 increased in HD – observed here as well by others [25,43], it is likely that Neat1 may influence the proteasomal degradation in HD. This contention is further supported by our observation that in the KEGG pathway, ubiquitin-mediated proteolysis is enriched significantly with 28 NEAT1 interacting proteins. Among these proteins, levels of 7 genes (BRCA1, HUWE1, SMURF2, UBE2D3, UBE2G2, UBE2S and UBR5) increased and the levels of 9 genes (FZR1, HERC, MGRN1, PML, RHOBTB2, SMURF1, TCEB1, UBE2M, and UBE2Z) decreased in postmortem brains of HD patients [35,36] or induced pluripotent stem cells (iPSCs) derived from HD patients [37]. Modulation of proteasomal degradation by miRNAs due to the interaction of NEAT1 with more than 300 miRNAs cannot be ruled out.
Levels of NEAT1 are increased in the temporal cortex and hippocampus of patients with Alzheimer’s disease (AD) to negatively regulate CDK5R1 [52].The role of NEAT1 in modulating neuronal excitability and its association with pathological seizure states has recently been reported [44,53]. It has also been found that ALS associated TDP-43 and FUS/TLS proteins were enriched in paraspeckles and bound to NEAT1_2 lncRNA directly [54].
Enriched biological process like regulation of gene expression [4,5,55,56], RNA splicing, mRNA metabolic processes, RNA metabolic process, nuclear mRNA splicing [57], apoptosis [58,59], carbohydrate/lipid/cholesterol metabolism [60–62], nervous system development [25,55] and S phase of mitotic cell cycle [12,13] were known to be associated with HD. Such association of known biological processes with HD that were enriched with interacting proteins of MEG3, NEAT1 and XIST indicated that increased expression of these lncRNAs in HD models might contribute to HD pathogenesis through their interacting protein partners.
Small nucleolar RNAs (snoRNAs), mostly 60–170 nucleotides long, belong to a class of ncRNAs that are involved in the post-transcriptional processing of other ncRNAs like ribosomal RNAs. snoRNAs are mostly localized in the nucleolus and have also been implicated in various processes like microRNA-dependent gene silencing and alternative splicing. Altered levels of snoRNAs have been identified in cancer [63].
In summary, the involvement of lncRNAs in mouse HD models mimicking neurodegeneration pathologies is quite evident from our work. This apparently new avenue of research warrants further investigation.
Materials and methods
Ethics statement
All animal experiments were conducted following the institutional guidelines for the use and care of animals and approved by the Institutional Animal and Ethics Committee of the National Brain Research Centre (NBRC/IAEC/2012/71).
Cell culture and transfection
Immortalized striatal STHdhQ7/HdhQ7 cells and STHdhQ111/HdhQ111cells, kindly provided by Prof. Marcy E. MacDonald of Massachusetts General Hospital, USA were cultured routinely in DMEM (HiMedia, India) supplemented with 10% (v/v) heat-inactivated FBS (Biowest, France), antibiotics penicillin/streptomycin PS 1% (v/v) and 400 μg/ml G418 (Invitrogen, USA) at 33°C in humidified condition and 5% CO2. Mouse neuroblastoma cell lines, Neuro2A and Human neuroblastoma cell lines SHSY5Y were procured from NCCS, Pune, India.
All transfections were carried out on 70–80% confluent cells using Lipofectamine 2000 (Invitrogen) as per the manufacturer’s protocol. Unless otherwise mentioned, for single transfection experiments 1 µg (30mm plate), 2.5μg (60mm plate) or 5μg (100 mm plate) of plasmid DNA constructs (HTT-83Q-DsRed, HTT-16Q-DsRed) as well as 5μl, 10μl or 15µl of Lipofectamine 2000 respectively were used. Transfection efficiency was normalized by co-transfecting cells with pEGFP-C1 (Clontech) or pDsRed-Monomer-C1 (Clontech) and counting and determining the percentage of GFP or DsRed positive cells under the microscope.
Cell models of HD
Immortalized striatal STHdhQ7/HdhQ7cells were originally established from wild-type Hdh knock-in mice which express full-length wild-type Huntingtin gene (HTT) with 7 Glu (Q) residues [30] These STHdhQ7/HdhQ7cells are primarily used as controls for HD in experiments, whereas STHdhQ111/HdhQ111 cells express endogenous full-length mutant HTT gene with 111Glu (Q) residues. Both wild-type and mutant full-length HTT are expressed from the chromosomal region in homozygous conditions. These cells are extensively used as a cell model of HD for identifying molecular alterations in the disease pathogenesis. Prof. Marcy E. MacDonald of Massachusetts General Hospital, USA kindly donated us these cell lines.
STHdhQ7/HdhQ7cells transiently transfected with exon1 of mutant HTT with 83Q (83Q- DsRed) were used as another cell model of HD as described by many authors including us [31] For control, STHdhQ7/HdhQ7cells were transiently transfected with exon1 of wild-type HTT with 16Q (16Q- DsRed).
Mouse model R6/2
Dr. Nihar Ranjan Jana, National Brain Research Centre, Manesar, Haryana, Pin- 122 050, India kindly provided us with paraffinized cortical tissue from R6/2 mice and control mice of the same age. R6/2 is one of the first mouse models of HD which express ~ 130 CAG repeats from human HD promoter [64]. Even though there are differences in time of appearance of first symptoms in motor activities among the colonies grown in standard living conditions,R6/2 mice typically are severely impaired by 8–12 weeks of age [65,66]. We have used R6/2 mice at age 6 weeks and 8 weeks representing early and late stage of HD.
RNA isolation from cultured cells and paraffinized tissue
Total RNA was prepared from cultured cells using TriZol Reagent (Invitrogen, USA) according to manufacturer’s protocol.
We isolated RNA from paraffin-embedded tissue samples of R6/2 mice following the modified protocol originally described earlier [67]. In brief, the isolation method for RNA from paraffin-embedded tissues consists of the following steps: De-paraffinization: For RNA extraction from tissue sections obtained from R62 mice, two sections each of 20 µm thickness were taken per 1.5 ml Eppendorf tube. The sections were deparaffinized by two rinses in xylene for 5 min each at room temperature followed by two centrifugations at room temperature for 10 min each at 10,000 g. Rehydration: After paraffin solubilization, a rehydration step was introduced where the supernatants from the previous step were carefully removed and the pellets were successively washed with 1 ml of absolute ethanol and 1 ml of 95% ethanol in DEPC water. After each step, the tissue was collected by centrifugation at 10,000 g for 10 min. Protein digestion: After the final wash, alcohol was aspirated and the tissue pellets were air dried in a thermoblock at 37°C and re-suspended in 500 µl of digestion buffer (10 mMNaCl, 500 mMTris, pH 7.6, 20 mM EDTA and 1% SDS). To obtain purified RNA, tissue proteins were removed by adding 500 µg/ml of the proteolytic enzyme proteinase K. The sections were then incubated at 45°C for 16 hours (overnight). Prior to RNA purification, proteinase K was inactivated at 100°C for 7 min in order to nullify its effects on PCR. RNA extraction: Total RNA was then extracted from these tissue sections by using the Trizol reagent and following the manufacturer’s protocol. The concentration of total RNA was measured using Biophotometer (Eppendorf, Germany).Details about tissue weights, nanodrop concentrations, RIN values and qubit concentrations are given in the Supplementary Table 2.
Small RNA sequencing
Small RNA-seq library was prepared using IlluminaTruSeq Small RNA library preparation kit following manufacturer’s protocol. Cluster generation and 50bp single end read sequencing were performed in IlluminaHiSeq platform. After quality checking and post-processing of Fastq files, sequences were mapped to the mouse genome (mm10) using Novoaligner (http://www.novocraft.com/) (Supplementary Table 3). Only uniquely aligned reads are considered for further analysis. Read counts for ncRNAs excluding miRNAs are generated using htseq-count module of the HT-seq [68]. The differential levels of analysis of ncRNAs other than miRNAs were performed using DESeq package in R statistical computing tool. The data were first normalized by the size factor, i.e effective library size. For differential analysis, DESeq uses a variation of the Fisher exact test adopted for Negative Binomial distribution. It calculates the significance of the change in expression of the gene I between two conditions and returns exact P value. Adjusted P value for multiple testing was determined with the Benjamini-Hochberg method. The deregulated noncoding RNAs were identified comparing age-matched control cortex sample versus the cortex of 6 weeks old and 8 weeks old R6/2 mice mouse.
Quantitative real-time PCR
One microgram total RNA was subjected to DNase treatment (Sigma) followed by cDNA preparation using random hexamer primer (Thermo Scientific), dNTPs (Thermo Scientific) and MuLv-Reverse transcriptase (Fermentas). Quantitative Real-time PCR (qRT-PCR) was carried out using Sybr green 2X Universal PCR Master Mix (Applied Biosystems) in StepOne Real-time PCR system (Applied Biosystems). For each gene, non-template control was used at the same condition to ascertain the baseline and threshold value for the analysis. The absolute quantification given by the software was in terms of Ct values. The relative quantification (fold change) of a target gene in a sample compared to the parental cell is expressed in terms of 2−ΔΔCt values after normalization with respect to internal control.
Gene-specific primers
List of PCR primers used in this study is shown in the Supplementary Table 1.
SiRNA mediated knockdown of Neat1 and Meg3
siRNAs against mouse NEAT1 (FlexiTube GeneSolution GS66961 for Neat1, Cat no: LPM15183A) and MEG3 (FlexiTube GeneSolution GS17263 for Meg3, Cat No: GS17263) were purchased from Qiagen and used, following the protocol described by the manufacturer. siRNAs were used at a final concentration of 40nM. For aggregate counting studies, siRNAs against MEG3 and NEAT1 were co-transfected along with HTT-83Q-DsRed in Neuro2A and SHSY5Y cells and cells were either fixed and mounted on slides for aggregate counting or used for Western Blot as in reference [6].
Aggregate counting
Aggregates of mutant HTT tagged with DsRed were determined using methods described earlier [69]. In brief, mouse Neuro2A or human SHSY5Y cells were cultured on coverslips in 35 mm culture dish (Nunc, USA) and transfected with HTT-83Q-DsRed or co-transfected with HTT-83Q-DsRed and siRNAs against Neat1 and Meg3. Twenty four hours after post-transfection, coverslips were washed with PBS, counterstained with DAPI post fixation with 4% Formaldehyde for 5 min prior to mounting on slides for aggregate counting using a confocal microscope (Zeiss LSM 710 Meta, Germany). An average of 30 cells was counted for each slide and the experiment was performed three times.
Isolation of cell extract and western blot analysis
Phosphate buffer saline (PBS) washed pellets from cell lines were lyzed on ice in lysis buffer (1M Tris-HCl, pH 7.5, 1N NaCl, 0.5 M EDTA, 1M NaF, 1M Na3VO4, 10% SDS, 20mM PMSF, 10% Triton X-100, 50% glycerol) for 30 min in presence of complete protease inhibitor (Roche Diagnostics) and centrifuged at 13,000 g for 15 min. Protein concentration was determined by Bradford protein estimation assay.
The cell lysate was separated on SDS gel according to molecular weight, was transferred to PVDF membrane (Millipore Corporation) which was blocked by 5% skimmed milk in TBST (50 mMTris-HCl, 150 mMNaCl, pH 7.5 containing 0.05% Tween 20). After that, the membrane was probed with primary antibody, followed by the incubation with HRP conjugated secondary antibody. The immunoreactive bands in the membrane were then developed with ECL kit (Super Signal West Pico Substrate; Pierce or Abcam). Quantification of western blots was carried out using Quantity One software of Bio-Rad. At least three separate experiments were analyzed and band intensities were normalized to loading control. Significant levels (p-values) were determined using the unpaired t-test.
Antibodies
We had used antibodies against p53 (mouse monoclonal) from Santa Cruz (1:2000), β Actin (mouse monoclonal) from Abcam (1:6000). The secondary antibody was a goat- anti-mouse HRP secondary antibody (1:3000).
Databases
To identify the interacting partners of Meg3, Neat1 and Xist, we used the database NPInter (http://www.bioinfo.org/NPInter/, version 3.0) based on experimental data from high throughput assays like crosslinking and immunoprecipitation followed by deep sequencing (CLIP-seq), chromatin isolation by RNA purification followed by high-throughput sequencing (ChIRP-seq) and also manually curated from scientific literature. This online resource provides information for interactions of long ncRNA with protein-coding genes and microRNA in the mouse as well as human genes [70]. Two genes expressed in a number of conditions in different individuals in the same tissue or different cell lines in similar levels in the same directions (increase or decrease) are considered to be co-expressed. We used GeneFriends database (http://genefriends.org/) that catalogs data for co-expression derived from gene expression studies in 4164 microarray datasets in 26,113 experimental conditions and 19,080 human genes. In mouse, 3571 microarray datasets containing 20,455 experimental conditions and 22,760 mouse genes. Co-expression values defined as the correlation coefficient, varied between 1 to 0 (for positive correlation), were also computed for a given query [71] Co-expression can be used to assign putative functions of genes to poorly annotated genes. This online resource provides information on co-expressed protein-coding genes, ncgenes including microRNAs, anti-sense RNA, and pseudogenes for a given query. To find out the transcription regulation of Meg3, Neat1, and Xist, we used the database at http://deepbase.sysu.edu.cn/chipbase/. This database catalogs transcription factor binding sites from ChIP-seq data obtained experimentally [72].
Enrichment analysis for biological processes defined by Gene Ontology (GO) and pathways by KEGG and PANTHER
To find out the function (s) of these noncoding RNAs and possible involvement in HD pathogenesis, we carried out an enrichment analysis of the protein interacting partners of these noncoding RNAs. Enrichment of biological processes associated with GO terms and pathways defined by Kyoto Encyclopedia of Genes and Genomes (KEGG) and Protein ANalysis THrough Evolutionary Relationships (PANTHER, http://pantherdb.org/) was analyzed by GeneCodis3 (http://genecodis.cnb.csic.es/) as described [73] following the methods modified earlier [6]. In GeneCodis3, the proportion of proteins in a particular GO term from the input query list is computed and compared with those coded by the human genome. The hypergeometric p-value was computed after correction for multiple testing.
Statistical analysis
Statistical significance was determined by Student’s unpaired t-test using QuickCalcs (http://www.graphpad.com/quickcalcs/index.cfm). All data are reported as the mean of 3–5 independent experiments ± standard deviations and considered as statistically significant when p ≤ 0.05.
Abbreviations
- HD
Huntingtons disease
- HTT
Huntingtin.
- ncRNA
non-coding RNA.
- lncRNA
Long Non Coding RNA.
- miRNA
micro RNA.
- rRNA
Ribosomal RNA.
- snoRNA
Small Nucleolar RNA.
- piRNA
Piwi Interacting RNA.
- tRNA
Transfer RNA.
Funding Statement
This work was supported by the financial support to NPB from Department of Biotechnology (No.BT/PR7185/MED/30/910/2012 dated 2.08.2013), Government of India and Department of Atomic Energy Institutional Project Fund (IBOP) to DM;Department of Atomic Energy, Government of India [12-R&D-SIN-5.04-0101];Department of Biotechnology, Ministry of Science and Technology [BT/PR7185/MED/30/910/2012].
Acknowledgments
Dr. Nihar Ranjan Jana, National Brain Research Centre Manesar, India is acknowledged for providing paraffinized tissue samples of R6/2 mice. We are grateful to Mr. Bijan B Bairagya (NIBMG, Kalyani 741251, India) for technical help. JC wishes to acknowledge the Department of Science and Technology (INSPIRE Fellowship), Government of India. SB acknowledges the financial support for the fellowship from CSIR, Govt of India.
Disclosure statement
No potential conflict of interest was reported by the authors.
Author contributions
Conceptualization: N.P.B.,D.M., R.C; Methodology: K.C.,S.D.,N.P.B.,D.M.;Validation: K.C., S.D., S.B.; Formal analysis: R.C., J.C.,N.P.B, K.C., S.D.,D.M.; Investigation: K.C., S.D.; Resources: N.P.B., D.M.; Data curation: K.C., S.D.; Writing - original draft: N.P.B.; Writing - review & editing: K.C.,R.C., D.M.; Visualization: N.P.B., D.M.; Supervision:N.P.B., D.M.; Project administration: N.P.B.,D.M.; Funding acquisition: N.P.B., D.M.
Supplementary material
Supplementary data for this article can be accessed here
References
- [1].Huntington’s Disease Collaborative Research Group A novel gene containing a trinucleotide repeat that is expanded and unstable on Huntington’s disease chromosomes. Cell. 1993;72:971–983. [DOI] [PubMed] [Google Scholar]
- [2].Ra R. Huntington’s disease: a clinical review. Orphanet J Rare Dis. 2010;5:40. [DOI] [PMC free article] [PubMed] [Google Scholar]
- [3].Imarisio S, Carmichael J, Korolchuk V, et al. Huntington’s disease: from pathology and genetics to potential therapies. Biochem J. 2008;412:191–209. [DOI] [PubMed] [Google Scholar]
- [4].Seredenina T, Luthi-Carter R. What have we learned from gene expression profiles in Huntington’s disease? Neurobiol Dis. 2012;45:83–98. [DOI] [PubMed] [Google Scholar]
- [5].Ruepp A, Kowarsch A, Schmidl D, et al. PhenomiR: a knowledgebase for microRNA expression in diseases and biological processes. Genome Biol. 2010;11:R6. [DOI] [PMC free article] [PubMed] [Google Scholar]
- [6].Sinha M, Mukhopadhyay S, Bhattacharyya NP. Mechanism(s) of alteration of micro RNA expression in Huntington’s disease and their possible contributions to the observed cellular and molecular dysfunctions in the disease. Neuromolr Med. 2012;14:221–243. [DOI] [PubMed] [Google Scholar]
- [7].Goodall EF, Heath PR, Bandmann O, et al. Neuronal dark matter: the emerging role of microRNAs in neurodegeneration. Front Cell Neurosci. 2013;7:178. [DOI] [PMC free article] [PubMed] [Google Scholar]
- [8].Qiu L, Tan EK, Zeng L. microRNAs and neurodegenerative diseases. Adv Exp Med Biol. 2015;888:85–105. [DOI] [PubMed] [Google Scholar]
- [9].Hernandez-Rapp J, Rainone S, Hébert SS. MicroRNAs underlying memory deficits in neurodegenerative disorders. Prog Neuro Psychopharmacol Biol Psychiatry. 2016. April 23 pii: S0278-5846(16)30057-4 [Epub ahead of print DOI: 10.1016/j.pnpbp.2016.04.011. [DOI] [PubMed] [Google Scholar]
- [10].Liu T, Im W, Mook-Jung I, et al. microRNA-124 slows down the progression of Huntington’s disease by promoting neurogenesis in the striatum. Neural Regen Res. 2015;10:786–791. [DOI] [PMC free article] [PubMed] [Google Scholar]
- [11].Das E, Jana NR, Bhattacharyya NP. Delayed cell cycle progression in STHdh(Q111)/Hdh(Q111) cells, a cell model for huntington’s disease mediated by microRNA-19a, microRNA-146a and microRNA-432. Microrna. 2015;4:86–100. [DOI] [PubMed] [Google Scholar]
- [12].Das E, Jana NR, Bhattacharyya NP. MicroRNA-124 targets CCNA2 and regulates cell cycle in STHdh(Q111)/Hdh(Q111) cells. Biochem Biophys Res Commun. 2013;437:217–224. [DOI] [PubMed] [Google Scholar]
- [13].Das S, Bhattacharyya NP. Heat shock factor 1-regulated miRNAs can target huntingtin and suppress aggregates of mutant huntingtin. Microrna. 2015;4:185–193. [DOI] [PubMed] [Google Scholar]
- [14].Bucha S, Mukhopadhyay D, Bhattacharyya NP. Regulation of mitochondrial morphology and cell cycle by microRNA-214 targeting Mitofusin2. Biochem Biophys Res Commun. 2015;465:797–802. [DOI] [PubMed] [Google Scholar]
- [15].Hoss AG, Labadorf A, Latourelle JC, et al. miR-10b-5p expression in Huntington’s disease brain relates to age of onset and the extent of striatal involvement. BMC Med Genomics. 2015;8:10. [DOI] [PMC free article] [PubMed] [Google Scholar]
- [16].Sinha M, Ghose J, Bhattacharyya NP. Micro RNA −214,-150,-146a and-125b target Huntingtin gene. RNA Biol. 2011;8:1005–1021. [DOI] [PubMed] [Google Scholar]
- [17].Kopp F, Mendell JT. Functional classification and experimental dissection of long noncoding RNAs. Cell. 2018. January 25;172(3):393–407. [DOI] [PMC free article] [PubMed] [Google Scholar]
- [18].Böhmdorfer G, Wierzbicki AT. Control of chromatin structure by long noncoding RNA. Trends Cell Biol. 2015;25:623–632. [DOI] [PMC free article] [PubMed] [Google Scholar]
- [19].Sin O, Ellen AA. Regulation of protein homeostasis in neurodegenerative diseases: the role of coding and ncgenes. Cell Mol Life Sci. 2015;72:4027–4047. [DOI] [PMC free article] [PubMed] [Google Scholar]
- [20].Elling R, Chan J, Fitzgerald KA. Emerging role of long noncoding RNAs as regulators of innate immune cell development and inflammatory gene expression. Eur J Immunol. 2016;46:504–512. [DOI] [PMC free article] [PubMed] [Google Scholar]
- [21].Szcześniak MW, Makałowska I. lncRNA-RNA interactions across the human transcriptome. PLoS One. 2016. March 1;11:e0150353. [DOI] [PMC free article] [PubMed] [Google Scholar]
- [22].Lekka E, Hall J. Noncoding RNAs in disease. FEBS Lett. 2018. July 4;592:2884–2900. [DOI] [PMC free article] [PubMed] [Google Scholar]
- [23].Wan P, Su W, Zhuo Y. The role of long noncoding RNAs in neurodegenerative diseases. Mol Neurobiol. 2017 Apr;54(3):2012–2021. doi:10.1007/s12035-016-9793-6. Epub 2016 Feb 24. [DOI] [PubMed] [Google Scholar]
- [24].Kerschbamer E, Biagioli M. Huntington’s disease as neurodevelopmental disorder: altered chromatin regulation, coding, and NcRNA transcription.Front Neurosci. 2015;9:509. Published online 2016 Jan 13. doi: 10.3389/fnins.2015.00509. [DOI] [PMC free article] [PubMed] [Google Scholar]
- [25].Brochier C, Gaillard MC, Diguet E, et al. Quantitative gene expression profiling of mouse brain regions reveals differential transcripts conserved in human and affected in disease models. Physiol Genomics. 2008;33:170–179. [DOI] [PubMed] [Google Scholar]
- [26].Francelle L, Galvan L, Gaillard MC, et al. Striatal long noncoding RNA Abhd11os is neuroprotective against an N-terminal fragment of mutant huntingtin in vivo. Neurobiol Aging. 2015;36:1601.e7–16. [DOI] [PubMed] [Google Scholar]
- [27].Johnson R. Long ncRNAs in Huntington’s disease neurodegeneration. Neurobiol Dis. 2012;46: 245–254. (Review). [DOI] [PubMed] [Google Scholar]
- [28].Johnson R, Richter N, Jauch R, et al. The human accelerated region 1 noncoding RNA is repressed by REST in Huntington’s disease. Physiol Genomics. 2010;41:269–274. [DOI] [PubMed] [Google Scholar]
- [29].Chung DW, Rudnicki DD, Yu L, et al. A natural antisense transcript at the Huntington’s disease repeat locus regulates HTT expression. Hum Mol Genet. 2011;20:3467–3477. [DOI] [PMC free article] [PubMed] [Google Scholar]
- [30].Qureshi IA, Mehler MF. Emerging roles of ncRNAs in brain evolution, development, plasticity and disease. Nat Rev Neurosci. 2012;13:528–541. [DOI] [PMC free article] [PubMed] [Google Scholar]
- [31].Sauvageau M, Goff LA, Lodato S, et al. Multiple knockout mouse models reveal lincRNAs are required for life and brain development. Elife. 2013;2:e01749. [DOI] [PMC free article] [PubMed] [Google Scholar]
- [32].Trettel F, Rigamonti D, Hilditch-Maguire P, et al. Dominant phenotypes produced by the HD mutation in STHdh(Q111) striatal cells. Hum Mol Genet. 2000;9:2799–2809. PMID:11092756. [DOI] [PubMed] [Google Scholar]
- [33].Majumder P, Raychaudhuri S, Chattopadhyay B, et al. Increased caspase-2, calpain activations and decreased mitochondrial complex II activity in cells expressing exogenous huntingtin exon 1 containing CAG repeat in the pathogenic range. Cell MolNeurobiol. 2007;27:1127–1145. [DOI] [PMC free article] [PubMed] [Google Scholar]
- [34].Yang JH, Li JH, Jiang S, et al. ChIPBase: a database for decoding the transcriptional regulation of long ncRNA and microRNA genes from ChIP-Seq data. Nucleic Acids Res. 2013;41:D177–D187. [DOI] [PMC free article] [PubMed] [Google Scholar]
- [35].Stuart JM, Segal E, Koller D, et al. A gene-coexpression network for global discovery of conserved genetic modules. Science. 2003;302:249–255. [DOI] [PubMed] [Google Scholar]
- [36].Ayroles JF, Carbone MA, Stone EA, et al. Systems genetics of complex traits in Drosophila melanogaster. Nat Genet. 2009;41:299–307. [DOI] [PMC free article] [PubMed] [Google Scholar]
- [37].Hodges A, Strand AD, Aragaki AK, et al. Regional and cellular gene expression of changes in human Huntington’s disease brain. Hum Mol Genet. 2006. March 15;15(6):965–977. [DOI] [PubMed] [Google Scholar]
- [38].Labadorf A, Hoss AG, Lagomarsino V, et al. Myers RHRNA sequence analysis of human Huntington’s disease brain reveals an extensive increase in inflammatory and developmental gene expression. PLoS One. 2015. December 4;10(12):e0143563. [DOI] [PMC free article] [PubMed] [Google Scholar]
- [39].Ring KL, An MC, Zhang N, et al. Genomic analysis reveals disruption of striatal neuronal development and therapeutic targets in human Huntington’s disease neural stem cells. Stem Cell Rep. 2015. December 8;5(6):1023–1038. [DOI] [PMC free article] [PubMed] [Google Scholar]
- [40].Chakravarty D, Sboner A, Nair SS. The oestrogen receptor alpha-regulated lncRNA NEAT1 is a critical modulator of prostate cancer. Nat Commun. 2014;5:5383. [DOI] [PMC free article] [PubMed] [Google Scholar]
- [41].Blume CJ, Hotz-Wagenblatt A, Hüllein J, et al. p53-dependent ncRNA networks in chronic lymphocytic leukemia. Leukemia. 2015;29:2015–2023. [DOI] [PubMed] [Google Scholar]
- [42].Choudhry H, Albukhari A, Morotti M, et al. Tumor hypoxia induces nuclear paraspeckle formation through HIF-2α dependent transcriptional activation of NEAT1 leading to cancer cell survival. Oncogene. 2015;34:4482–4490. [DOI] [PMC free article] [PubMed] [Google Scholar]
- [43].Makhlouf M, Ouimette JF, Oldfield A, et al. A prominent and conserved role for YY1 in Xist transcriptional activation. Nat Commun. 2014;5:4878. [DOI] [PMC free article] [PubMed] [Google Scholar]
- [44].Sunwoo JS, Lee ST, Im W, et al. Altered expression of the long noncoding RNA NEAT1 in Huntington’s disease. Mol Neurobiol. 2017. March;54(2):1577–1586. [DOI] [PubMed] [Google Scholar]
- [45].West JA, Davis CP, Sunwoo H, et al. The long noncoding RNAs NEAT1 and MALAT1 bind active chromatin sites. Mol Cell. 2014. September 4;55(5):791–802. Epub 2014 Aug 21. [DOI] [PMC free article] [PubMed] [Google Scholar]
- [46].Barry G., Briggs JA, Nayler SP, et al. The long ncRNA NEAT1 is responsive to neuronal activity and is associated with hyperexcitability states. Sci Rep. 2017;7:40127. [DOI] [PMC free article] [PubMed] [Google Scholar]
- [47].Idogawa M, Ohashi T, Sasaki Y, et al. Long ncRNA NEAT1 is a transcriptional target of p53 and modulates p53-induced transactivation and tumor-suppressor function. Int J Cancer. 2017. June 15;140(12):2785–2791. Epub 2017 Mar 27. [DOI] [PubMed] [Google Scholar]
- [48].Yoon JH, Abdelmohsen K, Gorospe M. Functional interactions among microRNAs and long noncoding RNAs. Semin Cell Dev Biol. 2014;34:9–14. [DOI] [PMC free article] [PubMed] [Google Scholar]
- [49].Hirose T, Virnicchi G, Tanigawa A, et al. NEAT1 long noncoding RNA regulates transcription via protein sequestration within subnuclear bodies. Mol Biol Cell. 2014. January;25(1):169–183. [DOI] [PMC free article] [PubMed] [Google Scholar]
- [50].Wade BE, Wang CE, Yan S, et al. Ubiquitin-activating enzyme activity contributes to the differential accumulation of mutant huntingtin in the brain and peripheral tissues. J Neurosci. 2014;34:8411–8422. [DOI] [PMC free article] [PubMed] [Google Scholar]
- [51].Hyrskyluoto A, Bruelle C, Lundh SH, et al. Ubiquitin-specific protease-14 reduces cellular aggregates and protects against mutant huntingtin-induced cell degeneration: involvement of the proteasome and ER stress-activated kinase IRE1α. Hum Mol Genet. 2014. November 15;23(22):5928–5939. [DOI] [PubMed] [Google Scholar]
- [52].Bhat KP, Yan S, Wang CE, et al. Differential ubiquitination and degradation of huntingtin fragments modulated by ubiquitin-protein ligase E3A. Proc Natl Acad Sci U S A. 2014;111:5706–5711. [DOI] [PMC free article] [PubMed] [Google Scholar]
- [53].Li X, Wang CE, Huang S, et al. Inhibiting the ubiquitin-proteasome system leads to preferential accumulation of toxic N-terminal mutant huntingtin fragments. Hum Mol Genet. 2010;19:2445–2455. [DOI] [PMC free article] [PubMed] [Google Scholar]
- [54].Spreafico M, Grillo B, Rusconi F, et al. Multiple layers of CDK5R1 regulation in Alzheimer’s disease implicate long NcRNAs. Int J Mol Sci. 2018. July 11;19(7):pii: E2022. [DOI] [PMC free article] [PubMed] [Google Scholar]
- [55].Barry G. Integrating the roles of long and small ncRNA in brain function and disease. Mol Psychiatry. 2014;19:410–416. [DOI] [PubMed] [Google Scholar]
- [56].Nishimoto Y., Nakagawa S, Hirose T, et al. The long ncRNA nuclear-enriched abundant transcript 1_2 induces paraspeckle formation in the motor neuron during the early phase of amyotrophic lateral sclerosis. Mol Brain. 2013;6:31. [DOI] [PMC free article] [PubMed] [Google Scholar]
- [57].Walsh MJ, Cooper-Knock J, Dodd JE, et al. Invited review: decoding the pathophysiological mechanisms that underlie RNA dysregulation in neurodegenerative disorders: a review of the current state of the art. Neuropathol Appl Neurobiol. 2015;41:109–134. [DOI] [PMC free article] [PubMed] [Google Scholar]
- [58].Neueder A, Bates GP. A common gene expression signature in Huntington’s disease patient brain regions. BMC Med Genomics. 2014;7:60. [DOI] [PMC free article] [PubMed] [Google Scholar]
- [59].Labadorf AT, Myers RH. Evidence of extensive alternative splicing in post mortem human brain HTT transcription by mRNA sequencing. PLoS One. 2015;10:e0141298. [DOI] [PMC free article] [PubMed] [Google Scholar]
- [60].Ekshyyan O, Aw TY. Apoptosis: a key in neurodegenerative disorders. Curr Neurovasc Res. 2004;1:355–371. [DOI] [PubMed] [Google Scholar]
- [61].Ghavami S, Shojaei S, Yeganeh B, et al. Autophagy and apoptosis dysfunction in neurodegenerative disorders. Prog Neurobiol. 2014;112:24–49. [DOI] [PubMed] [Google Scholar]
- [62].Nambron R, Silajdžić E, Kalliolia E, et al. A metabolic study of Huntington’s Disease. PLoS One. 2016;11:e0146480. [DOI] [PMC free article] [PubMed] [Google Scholar]
- [63].Hottman DA, Chernick D, Cheng S, et al. HDL and cognition in neurodegenerative disorders. Neurobiol Dis. 2014;72:22–36. [DOI] [PMC free article] [PubMed] [Google Scholar]
- [64].Block RC, Dorsey ER, Beck CA, et al. Altered cholesterol and fatty acid metabolism in Huntington’s disease. J Clin Lipidol. 2010;4:17–23. [DOI] [PMC free article] [PubMed] [Google Scholar]
- [65].Jorjani H, Kehr S, Jedlinski DJ, et al. An updated human snoRNAome. Nucleic Acids Res. 2016;44:5068–5082. [DOI] [PMC free article] [PubMed] [Google Scholar]
- [66].Mangiarini L, Sathasivam K, Seller M, et al. Exon 1 of the HD gene with an expanded CAG repeat is sufficient to cause a progressive neurological phenotype in transgenic mice. Cell. 1996;87:493–506. [DOI] [PubMed] [Google Scholar]
- [67].Carter RJ, Lione LA, Humby T, et al. Characterization of progressive motor deficits in mice transgenic for the human Huntington’s disease mutation. J Neurosci. 1999;19:3248–3257. [DOI] [PMC free article] [PubMed] [Google Scholar]
- [68].Luesse HG, Schiefer J, Spruenken A, et al. Evaluation of R6/2 HD transgenic mice for therapeutic studies in Huntington’s disease: behavioral testing and impact of diabetes mellitus. Behav Brain Res. 2001;126:185–195. [DOI] [PubMed] [Google Scholar]
- [69].Korbler T, Grskovic M, Dominis M, et al. A simple method for RNA isolation from formalin-fixed and paraffin-embedded lymphatic tissues. Exp Mol Pathol. 2003;74:336–340. [DOI] [PubMed] [Google Scholar]
- [70].Anders S, Pyl PT, Huber W. HTSeq–a Python framework to work with high-throughput sequencing data. Bioinformatics. 2015;31:166–169. [DOI] [PMC free article] [PubMed] [Google Scholar]
- [71].Raychaudhuri S, Sinha M, Mukhopadhyay D, et al. A huntingtin interacting protein, reduces aggregates and apoptosis induced by N-terminal huntingtin with 40 glutamines in Neuro2a cells and exhibits chaperone-like activity. Hum Mol Genet. 2008. January 15;17(2):240–255. [DOI] [PubMed] [Google Scholar]
- [72].Hao Y, Wu W, Li H, et al. NPInter v3.0: an upgraded database of noncoding RNA-associated interactions. Database (Oxford). 2016. April 17;2016:pii: baw057. [DOI] [PMC free article] [PubMed] [Google Scholar]
- [73].van Dam S, Craig T, de Magalhães JP. Gene friends: a human RNA-seq-based gene and transcript co-expression database. Nucleic Acids Res. 2015. January;43(Database issue):D1124–D1132. [DOI] [PMC free article] [PubMed] [Google Scholar]
Associated Data
This section collects any data citations, data availability statements, or supplementary materials included in this article.