

Abstract
Objectives:
Two epidemics in the United States are related: opioid drug injection and hepatitis C virus (HCV) infection. This study quantifies the relationship between illicit/prescription drug misuse and HCV infection in 3 population generations: baby boomers (born 1945–1965, inclusive), pre-baby boomers, and post-baby boomers.
Methods:
This retrospective study included prescription drug consistency (March–December 2015) and HCV (2011–2015) patient test results performed at a large national clinical reference laboratory. HCV positivity, drug use consistency/inconsistency with prescribed drug information, type of inconsistent use, and inconsistent use of individual drug classes were assessed.
Results:
This study evaluated 39,231 prescription drug monitoring and HCV sets of test results from 18,410 patients. Of these patients, 25.1% tested positive for HCV and 57.3% demonstrated drug test results that were inconsistent with the prescribed medication(s). The types of drug test inconsistency differed substantially between HCV-positive and -negative patients, particularly testing positive for both non-prescribed drugs and prescribed drugs. Specimens from HCV-positive baby boomer and post-baby boomers demonstrated non-prescribed use of opioids and many other drug classes more often than from HCV-negative patients.
Conclusions:
The rates of inconsistent drug test results and types of drugs misused suggest that HCV-positive patients are more likely than HCV-negative patients to display high-risk behavior, even beyond opioid use. This difference is most pronounced in the post-baby boomer generation. Healthcare professionals should consider these patterns and how they differ by generation when monitoring for both prescription and illicit drugs, the results of which can impact treatment decisions including prescribing analgesics.
Keywords: drug misuse, hepatitis C virus infection, opioids
There are 2 related epidemics in the United States: injection drug use and hepatitis C virus (HCV) infection (Jordan et al., 2014; Suryaprasad et al., 2014; Ziebell et al., 2015). HCV is the most common blood-borne infection in the country [Centers for Disease Control and Prevention (CDC), 2010]; approximately 2.9 to 3.7 million people currently have chronic HCV infection (CDC, 2017a). HCV was listed as a contributing cause of death in over 19,000 people in the United States in 2014 (CDC, 2017a), and has outnumbered HIV as a cause of death since 2007 (Ly et al., 2012). The number of opioid-related deaths in the United States has tripled since 2000 (Rudd et al., 2016), moving in parallel with increased opioid prescribing (Guy et al., 2017). Injection drug use is the primary risk factor for HCV infection (CDC, 2017b). Recent studies have shown associations between the injection of prescription opioids and a number of adverse health outcomes, including HCV infection (Lake and Kennedy, 2016). Progression from prescription opioid misuse to injection drug use has been noted (Lankenau et al., 2012; Martins et al., 2015; Carlson et al., 2016), and those who make this transition have elevated rates of HCV infection (Valdiserri et al., 2014).
With early infection, patients may be asymptomatic or describe flu-like symptoms including nausea and fatigue—symptoms that do not necessarily prompt clinicians to test for HCV (Smith et al., 2012; CDC, 2017a). Approximately 75% to 85% of newly acquired HCV cases develop into chronic HCV, which can progress to cirrhosis and hepatocellular carcinoma (National Institute on Drug Abuse, 2000; Smith et al., 2012). Advances in treatment include direct-acting antiviral drugs that are highly effective at treating HCV, but even after treatment of the virus there are risks of hepatocellular carcinoma that persist in patients with higher fibrosis scores, making screening for HCV at earlier stages critical to improved health outcomes.
In 2012, CDC recommended HCV screening for all persons born from 1945 through 1965 (baby boomers) (CDC, 2012). A recent study suggested that the HCV epidemic peaked from 1940 through 1965 with reused medical syringes within hospitals largely to blame, a common practice before disposable syringes became standard (Joy et al., 2016). The research concluded that anyone born particularly from 1945 through 1964 should be tested for HCV, even with a lack of risk factors (Joy et al., 2016). The CDC and US Department of Health and Human Services (HHS) have also provided guidance on management of patients with infections associated with illicit drug use (Belani et al., 2012). This guideline stressed the importance of HCV screening services and also noted that, “Screening for illicit use of drugs … and screening for misuse of prescription drugs, can be useful adjuncts to screening for infectious diseases (Belani et al., 2012).”
The goal of the present study is to quantify the relationship between inconsistent drug testing results and HCV infection in 3 generations of patients being monitored for prescription drug adherence from a wide variety of physicians: pre-baby boomers (born before 1945), baby boomers (born 1945–1965, inclusive), and post-baby boomers (born after 1965). Due to the different primary modes of transmission outlined above, specifically hospitals reusing syringes for baby-boomers and injection drug use for post-baby boomers, we hypothesized that the patterns of inconsistent drug test results and associations with HCV infection vary in each generation. Specifically, we hypothesized that non-prescribed positivity for drug classes that are frequently injected, like heroin and fentanyl, and prescription opioids, the use of which has been shown to progress to injection drug use (Lankenau et al., 2012; Martins et al., 2015; Carlson et al., 2016), would be more strongly associated with HCV infection in the post-baby boomer generation than in other generations. Relying on actual drugs detected in patients, we evaluated demographic factors and the statistical relationships of HCV infection with misuse of individual drug classes in patients who underwent both prescription drug monitoring and HCV screening.
METHODS
Study Data
This study includes a convenience sample of de-identified results of urine drug screening (UDS) performed for a 10-month period, from March 1, 2015, through December 31, 2015. Data from March coincide with the increase of drug analytes included in the Quest Diagnostics medMATCH program. UDS for prescription monitoring was defined using sets of results with at least 1 prescribed drug listed by the ordering physician. Patients referred from drug rehabilitation clinics and addiction specialists were excluded from analysis because these settings represent selected populations and may use medMATCH services differently than other healthcare providers. HCV testing results performed at Quest Diagnostics were extracted for all patients with a medMATCH result for a 5-year period from 2011 through 2015, inclusive. We included 5 years of HCV testing to enlarge the cohort of those with both UDS and HCV results. UDS results were paired with HCV testing results using a master patient identification number. This Quest Diagnostics Health Trends study was deemed exempt by the Western Institutional Review Board.
Specimen Collections and Handling
HCV serum screening was performed at Quest Diagnostics with a commercial 2-stage immunometric assay (aHCV, Ortho Clinical Diagnostics, Raritan, NJ). This highly sensitive test detects anti-HCV IgG antibody that is reactive to 3 recombinant HCV encoded antigens (c22-3, c200, and NS5). Results are reported as either non-reactive (negative) or reactive (positive).
All patient specimens were tested using the Quest Diagnostics proprietary prescription drug monitoring medMATCH service. This service reports whether the prescribed drug(s), as indicated by the ordering healthcare provider, or drug metabolites or other drugs were detected in the urine specimen. The medMATCH service tests for up to 44 drugs and/or drug metabolites, including analgesics, central nervous system depressants, stimulants, and certain illicit drugs such as marijuana, cocaine, and heroin. Prescribed drugs are listed by the ordering healthcare provider with each test. UDS analysis includes presumptive immunoassay screening followed by quantitative definitive confirmation analyses of the presumptive positive results. The definitive method of analysis was liquid chromatography-tandem mass spectrometry (LC-MS/MS), which is considered the most sensitive and specific drug-testing method.
Data Definitions
A “consistent” medMATCH drug test result indicates that the prescribed medication(s), and no other drug, was detected. An “inconsistent” medMATCH result means that drug testing provided evidence that the patient was taking non-prescribed drugs and/or was not taking the prescribed medication(s). Inconsistent test results were broken down into 3 types of misuse: (1) “No drugs found,” indicates that the patient tested negative (below the detection limit) for at least 1 prescribed drug and all tested non-prescribed drugs. (2) “Additional drugs found” indicates that the patient tested positive for all of their prescribed drugs and at least 1 non-prescribed or illicit drug. (3) “Different drugs found” indicates that the patient tested negative for at least 1 prescribed drug but tested positive for at least 1 non-prescribed or illicit drug. Patients with a positive HCV antibody test result at any time between 2011 and 2015 were considered HCV positive for this analysis.
Generations
Patient data were grouped into 3 generational age groups: born from 1945 through 1965 (“baby boomers”); born after 1965 (“post-baby boomers”); and born before 1945 (“pre-baby boomers”).
Metro Classifications
Metro classifications were based on the 2013 Rural-Urban Continuum Codes obtained from the United States Department of Agriculture Economic Research Service (USDA ERS, 2016). Data were available for Federal Information Processing Standard (FIPS) codes, which were connected to patient ZIP Codes from their drug test result via SAS version 9.4 (SAS Institute, Cary, NC) internal maps dataset. Data were grouped into 3 categories: “large metro” (counties in metropolitan areas of 1 million population or more), “small metro” (counties in metropolitan areas of less than 1 million population), and “non-metro” (counties not in metropolitan areas).
Geographical Categories
This study included patients living in 43 states. Data were grouped for analysis according to United States Department of HHS region. In the event that demographic data changed over the study period, analyses were performed based on the demographics of the most recent drug test specimen.
Drug Classes
Individual drug test analytes were combined into their respective classes for analysis. Opioid analytes were grouped into different individual analytical classes. These individual classes include heroin metabolite, fentanyl, methadone, “oxycodone,” buprenorphine, and “opiates.” The “oxycodone” individual class includes noroxycodone, oxycodone, and oxymorphone. The “opiates” individual class includes codeine, morphine, hydrocodone, hydromorphone, and norhydrocodone. Results focused on drugs found that were not prescribed and prescribed drugs that were not found. One monitoring test could result in having both of these outcomes within the same drug class, because many drug classes contain multiple separate analytes, as noted previously. All analytes within the individual classes include the parent drug and applicable metabolite(s).
Statistical Analyses
When examining demographics, we performed analyses on unique patient data. All sets of test results were included when examining inconsistent test results, types of inconsistencies, and drug class results. The Cochran-Armitage test was used to analyze outcome trends among the 3 study generations. Testing for statistical significance between 2 groups used the chi-square test and/or logistic regression models. The results of unadjusted logistic regression models showing differences in drug class inconsistency between tests from HCV-positive and HCV-negative patients were stated as odds ratios (ORs) and 95% confidence intervals (95% CIs). Data were analyzed using SAS, version 9.4 (SAS Institute).
RESULTS
Of the 18,410 patients whose test results were evaluated, 25.1% tested positive for HCV, approximately 5 times higher than the rate found in overall testing at Quest Diagnostics (internal communication from Quest Diagnostics). HCV-positive results were significantly more common among baby boomers (28.4%) than post-baby boomers (22.2%) (P < 0.01). Both groups had significantly higher proportions of HCV-positive patients than the pre-baby boomer group (13.3%; P < 0.01 for both). The overall rate of inconsistent drug test results in the study population was 57.3% and differed significantly among generations, being highest in post-baby boomers (59.5%), followed by baby boomers (55.4%) and pre-baby boomers (50.0%) (P < 0.01 for trend).
HCV Demographics
In all 3 generations of patients, a higher proportion of males than females were HCV positive (all P < 0.01) (Table 1). HCV infection was significantly more common among Medicaid patients than Medicare patients and patients with private payer status, for baby boomers as well as post-baby boomers (both P < 0.01). Among post-baby boomers, HCV positivity was more common in non-metropolitan areas than small metropolitan or large metropolitan areas; however, this relationship did not hold true for baby boomers or pre-baby boomers. HHS region 3 (Delaware, Washington DC, Maryland, Pennsylvania, Virginia, and West Virginia) had the highest rate of HCV-positive patients (39.4%) and HHS Region 2 (New York and New Jersey) had the lowest rate at 16.6%. Patients with drug tests ordered by psychiatrists had the highest rates of HCV positivity overall (35.2%) and in the pre-baby boomer (34.6%) and baby boomer patients (37.2%).
TABLE 1.
Hepatitis C Virus Positivity Rates by Demographics
| Total (n = 18,410) | Born After 1965 (n = 7918) | Born 1945–1965 (n = 9733) | Born Before 1945 (n = 759) | ||
| Patients | HCV-Positive, n (%) | ||||
| Total * | 18,410 | 4628 (25.1) | 1760 (22.2) | 2767 (28.4) | 101 (13.3) |
| Gender | |||||
| Male * | 7579 | 2415 (31.9) † | 820 (27.0) † | 1539 (36.3) † | 57 (18.8) † |
| Female * | 10,734 | 2184 (20.3) | 937 (19.3) | 1205 (22.2) | 42 (9.3) |
| Payer type | |||||
| Medicaid ‡ | 2447 | 842 (34.4) † | 410 (29.6) † | 429 (40.8) † | 3 (33.3) |
| Medicare * | 2679 | 702 (26.2) | 114 (19.6) | 557 (30.6) | 31 (11.4) |
| Private payers * | 12,415 | 2904 (23.4) | 1195 (21.4) | 1649 (25.8) | 60 (13.7) |
| Metropolitan classification | |||||
| Large metro * | 10,299 | 2550 (24.8) | 948 (22.2) | 1534 (27.7) | 68 (14.0) |
| Small metro * | 5913 | 1483 (25.1) | 488 (19.6) | 967 (30.0) | 28 (13.7) |
| Non-metro * | 2163 | 586 (27.1) | 321 (28.0) † | 260 (27.0) | 5 (7.7) |
| Health and human services region | |||||
| 1: CT, MA, ME, NH, RI, VT | 1358 | 413 (30.4 † | 209 (30.3) † | 201 (30.8) | 3 (20.0) |
| 2: NJ, NY ‡ | 592 | 98 (16.6) | 24 (9.5) | 71 (22.0) | 3 (18.8) |
| 3: DE, DC, MD, PA, VA, WV | 2409 | 949 (39.4) † | 629 (39.8) † | 314 (39.6) † | 6 (18.2) |
| 4: AL, FL, GA, KY, MS, NC, SC, TN * | 6432 | 1365 (21.2) | 440 (17.6) | 890 (24.8) | 35 (10.1) |
| 5: IL, IN, MI, MN, OH, WI | 1891 | 410 (21.7) | 212 (21.1) | 195 (22.9) | 3 (8.1) |
| 6: AR, LA, NM, OK, TX * | 1684 | 407 (24.2) | 74 (14.0) | 315 (30.3) | 18 (15.8) |
| 7: IA, KS, MO, NE | 385 | 94 (24.4) | 28 (18.5) | 65 (29.4) | 1 (7.7) |
| 8: CO, MT, ND, SD, UT, WY | 29 | 8 (27.6) | 0 (0.0) | 8 (33.3) | 0 (0.0) |
| 9: AZ, CA, HI, NV * | 3492 | 839 (24.0) | 130 (11.3) | 678 (31.4) † | 31 (17.3) |
| 10: AK, OR, ID, WA | 138 | 45 (32.6) | 14 (28.6) | 30 (35.7) | 1 (20.0) |
| Provider type | |||||
| Primary care * | 8196 | 1992 (24.3) | 698 (19.2) | 1234 (29.4) | 51 (15.1) |
| Pain management clinic § | 5798 | 1482 (25.6) | 638 (26.0) † | 818 (26.4) | 26 (10.7) |
| Neurologist * | 411 | 67 (16.3) | 11 (9.4) | 56 (20.9) | 0 (0.0) |
| Psychiatrist | 315 | 111 (35.2) † | 76 (34.6) † | 35 (37.2) | 0 (0.0) |
| Other provider * | 3,690 | 833 (26.5) | 337 (22.6) | 615 (30.0) | 24 (15.8) |
Ninety-seven missing gender, 869 missing payer type, 35 missing metropolitan classification.
*Baby boomers had significantly higher rate of HCV positivity than either other generation (P < 0.01).
†Factor had significantly higher rate of HCV positivity than the average for other factors (P < 0.01).
‡Baby boomers had significantly higher rate of HCV positivity than pre-baby boomers (P < 0.01).
§Baby boomers had significantly higher rate of HCV positivity than post-baby boomers (P < 0.01).
HCV, hepatitis C virus.
Inconsistent Drug-Testing Results
Males had a significantly higher rate of inconsistent drug test results than females (62.9% vs 57.1%, P < 0.01) in the post-baby boomer generation, but the rates were approximately equal between genders for baby boomers and similar in pre-baby boomers. There were also similar rates of inconsistent drug test results among the 3 payer status groups (range 56.3%–57.7%), and among most HHS regions (range 51.9%–62.3%). Baby boomers (60.8%) and post-baby boomers (56.8%) also had significantly higher rates of inconsistent results in large metropolitan areas than in other metropolitan classifications (all P < 0.01). Patients from pain clinics and psychiatrists had the highest and lowest inconsistency rates in the study (59.8% and 44.3%, respectively). The rates of inconsistency between prescribed and detected drug(s) were similar in the 12,631 sets of results from HCV-positive patients (58.7%) and the 26,600 sets of results from HCV-negative patients (56.7%). This finding held true for all 3 generations of patients, although the actual rates of inconsistent results in HCV-positive and HCV-negative patients varied: 60.1% versus 59.2% among post-baby boomers, 57.3% versus 54.4% among baby boomers; and 50.7% versus 49.8% among pre-baby boomers. The types of inconsistencies were considerably different. Among baby boomers, detection of additional drugs was significantly more common in HCV-positive than HCV-negative individuals (54.0% vs 46.4%, P < 0.01), while detection of no drugs was less common in HCV-positive individuals (21.3% vs 31.1%, P < 0.01). In the post-baby boomer population, these differences were even more pronounced (Fig. 1).
FIGURE 1.
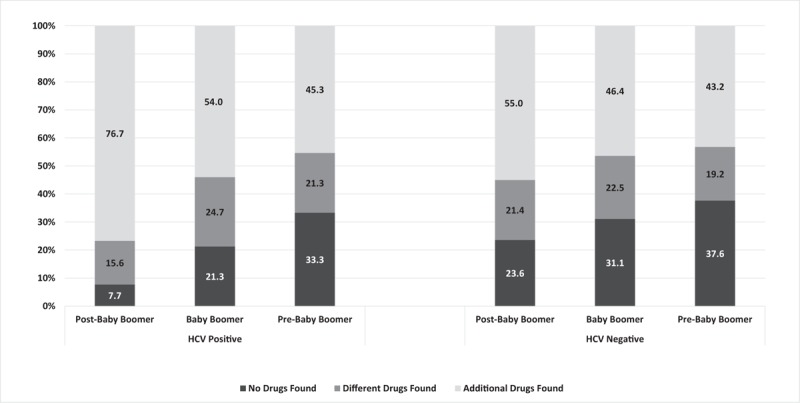
Describes 3 types of drug misuse. “No drugs found” indicates at least 1 prescribed drug was not found during drug testing and no additional, non-prescribed drugs were found. “Different drugs found” indicates that at least 1 prescribed drug was not found but a different, non-prescribed drug was detected. “Additional drugs found” indicates that all prescribed drugs were detected in addition to at least 1 non-prescribed drug.
Drug Classes
The benzodiazepine drug class accounted for the largest number of inconsistencies for all generations, regardless of HCV status (Tables 2–4). In post-baby boomers (Table 2), specimens from the HCV-positive group were significantly more likely than those from the HCV-negative group to test positive for non-prescribed drugs in 7 different drug classes (all P < 0.01). The strongest measures of association occurred for cocaine (OR 2.77, 95% CI 2.50–3.06), opiates (OR 1.90, 95% CI 1.76–2.05), heroin (OR 1.59, 95% CI 1.36–1.85), and benzodiazepines (OR 1.54, 95% CI 1.43–1.66). Oxycodone was a non-prescribed drug class significantly less likely to be found in the HCV-positive group (OR 0.82, 95% CI 0.70–0.97). The HCV-positive group was significantly less likely to test negative for prescribed drugs in 5 drug classes (all P < 0.01), with fentanyl exhibiting the strongest association (OR 0.29, 95% CI 0.14–0.59). The HCV-positive group was significantly more likely to test negative for prescribed drugs in the methadone (OR 1.76, 95% CI 1.42–2.17) and buprenorphine (OR 1.64, 95% CI 1.29–2.09) drug classes.
TABLE 2.
Post-Baby Boomer Inconsistent Drug Classes and Hepatitis C Virus Status
| HCV-Positive | HCV-Negative | |||||
| Tests | Inconsistent, n (%) | Tests | Inconsistent, n (%) | OR (95% CI) | P * | |
| Drug class found, not prescribed | ||||||
| Benzodiazepines | 6380 | 1551 (24.3) | 12,890 | 2222 (17.2) | 1.54 (1.43–1.66) | <0.001 |
| Marijuana metabolite | 6076 | 1233 (20.3) | 11,921 | 2291 (19.2) | 1.07 (0.99–1.16) | 0.086 |
| Opiates | 6438 | 1495 (23.2) | 13,100 | 1801 (13.8) | 1.90 (1.76–2.05) | <0.001 |
| Oxycodone | 6451 | 217 (3.4) | 13,239 | 538 (4.1) | 0.82 (0.70–0.97) | 0.017 |
| Cocaine metabolite | 6339 | 961 (15.2) | 12,579 | 763 (6.1) | 2.77 (2.50–3.06) | <0.001 |
| Alcohol metabolite | 2948 | 200 (6.8) | 3761 | 290 (7.7) | 0.87 (0.72–1.05) | 0.148 |
| Amphetamines | 6310 | 389 (6.2) | 12,473 | 610 (4.9) | 1.28 (1.12–1.46) | <0.001 |
| Barbiturates | 6278 | 120 (1.9) | 12,222 | 233 (1.9) | 1.00 (0.80–1.25) | 0.981 |
| Methadone | 6293 | 87 (1.4) | 12,344 | 116 (0.9) | 1.48 (1.12–1.96) | 0.006 |
| Fentanyl | 3108 | 360 (11.6) | 3990 | 316 (7.9) | 1.52 (1.30–1.79) | <0.001 |
| Heroin metabolite | 4255 | 397 (9.3) | 5150 | 314 (6.1) | 1.59 (1.36–1.85) | <0.001 |
| Drug class prescribed, not found | ||||||
| Opiates | 6438 | 228 (3.5) | 13,100 | 1338 (10.2) | 0.32 (0.28–0.37) | <0.001 |
| Benzodiazepines | 6380 | 255 (4.0) | 12,890 | 1075 (8.3) | 0.46 (0.40–0.53) | <0.001 |
| Oxycodone | 6451 | 142 (2.2) | 13,239 | 803 (6.1) | 0.35 (0.29–0.42) | <0.001 |
| Amphetamines | 6310 | 49 (0.8) | 12,473 | 315 (2.5) | 0.30 (0.22–0.41) | <0.001 |
| Methadone | 6293 | 162 (2.6) | 12,344 | 183 (1.5) | 1.76 (1.42–2.17) | <0.001 |
| Buprenorphine | 1538 | 123 (8.0) | 3216 | 162 (5.0) | 1.64 (1.29–2.09) | <0.001 |
| Fentanyl | 3108 | 9 (0.3) | 3990 | 40 (1.0) | 0.29 (0.14–0.59) | <0.001 |
*Chi-square test.
CI, confidence interval; HCV, hepatitis C virus; OR, odds ratio.
TABLE 4.
Pre-Baby Boomer Inconsistent Drug Classes and Hepatitis C Virus Status
| HCV-Positive | HCV-Negative | |||||
| Tests | Inconsistent, n (%) | Tests | Inconsistent, n (%) | OR (95% CI) | P * | |
| Drug class found, not prescribed | ||||||
| Benzodiazepines | 137 | 22 (16.1) | 891 | 187 (20.9) | 0.72 (0.44–1.17) | 0.184 |
| Marijuana metabolite | 121 | 12 (9.9) | 768 | 26 (3.4) | 3.14 (1.54–6.41) | 0.002 |
| Opiates | 143 | 12 (8.4) | 933 | 45 (4.8) | 1.81 (0.93–3.51) | 0.080 |
| Oxycodone | 144 | 4 (2.8) | 946 | 29 (3.1) | 0.90 (0.31–2.61) | 0.851 |
| Cocaine metabolite | 136 | 4 (2.9) | 854 | 4 (0.5) | 6.44 (1.59–26.06) | 0.009 |
| Drug class prescribed, not found | ||||||
| Opiates | 143 | 22 (15.4) | 933 | 152 (16.3) | 0.93 (0.57–1.52) | 0.784 |
| Benzodiazepines | 137 | 17 (12.4) | 891 | 60 (6.7) | 1.96 (1.11–3.48) | 0.021 |
| Oxycodone | 144 | 6 (4.2) | 946 | 59 (6.2) | 0.65 (0.28–1.54) | 0.332 |
Percent and OR not calculated when number of inconsistent results <4.
*Chi-square test.
CI, confidence interval; HCV, hepatitis C virus; OR, odds ratio.
For baby boomers (Table 3), specimens from HCV-positive patients were significantly more likely than specimens from HCV-negative patients to test positive for 8 different non-prescribed drug classes (all P < 0.02); the biggest differences were found for heroin (OR 11.98, 95% CI 6.16–23.30), fentanyl (OR 3.42, 95% CI 2.37–4.93), and cocaine (OR 2.67, 95% CI 2.24–3.19). The HCV-positive group was significantly less likely to test negative for 2 prescribed group classes, with benzodiazepines showing the strongest effect (OR 0.77 95% CI 0.68–0.87) and significantly more likely to test negative for 3 prescribed drug classes, with methadone exhibiting the largest measure of association (OR 2.56, 95% CI 1.55–4.23).
TABLE 3.
Baby Boomer Inconsistent Drug Classes and Hepatitis C Virus Status
| HCV-Positive | HCV-Negative | |||||
| Tests | Inconsistent, n (%) | Tests | Inconsistent, n (%) | OR (95% CI) | P * | |
| Drug class found, not prescribed | ||||||
| Benzodiazepines | 5501 | 1127 (20.5) | 11,098 | 2098 (18.9) | 1.11 (1.02–1.20) | 0.015 |
| Marijuana metabolite | 4989 | 854 (17.1) | 9788 | 1084 (11.1) | 1.66 (1.51–1.83) | <0.001 |
| Opiates | 5695 | 672 (11.8) | 11,574 | 974 (8.4) | 1.46 (1.31–1.62) | <0.001 |
| Oxycodone | 5744 | 189 (3.3) | 11,720 | 360 (3.1) | 1.07 (0.90–1.29) | 0.431 |
| Cocaine metabolite | 5388 | 292 (5.4) | 10,729 | 225 (2.1) | 2.67 (2.24–3.19) | <0.001 |
| Alcohol metabolite | 1138 | 140 (12.3) | 1982 | 196 (9.9) | 1.28 (1.02–1.61) | 0.037 |
| Amphetamines | 5296 | 141 (2.7) | 10,490 | 184 (1.8) | 1.53 (1.23–1.91) | <0.001 |
| Barbiturates | 5236 | 66 (1.3) | 10,274 | 210 (2.0) | 0.61 (0.46–0.81) | <0.001 |
| Methadone | 5314 | 113 (2.1) | 10,452 | 87 (0.8) | 2.59 (1.95–3.43) | <0.001 |
| Fentanyl | 1293 | 81 (6.3) | 2452 | 47 (1.9) | 3.42 (2.37–4.93) | <0.001 |
| Heroin metabolite | 1538 | 69 (4.5) | 2562 | 10 (0.4) | 11.98 (6.16–23.30) | <0.001 |
| Drug class prescribed, not found | ||||||
| Opiates | 5695 | 739 (13.0) | 11,574 | 1694 (14.6) | 0.87 (0.79–0.95) | 0.003 |
| Benzodiazepines | 5501 | 358 (6.5) | 11,098 | 924 (8.3) | 0.77 (0.68–0.87) | <0.001 |
| Oxycodone | 5744 | 418 (7.3) | 11,720 | 871 (7.4) | 0.98 (0.87–1.10) | 0.715 |
| Amphetamines | 5296 | 28 (0.5) | 10,490 | 64 (0.6) | 0.87 (0.56–1.35) | 0.526 |
| Methadone | 5314 | 35 (0.7) | 10,452 | 27 (0.3) | 2.56 (1.55–4.23) | <0.001 |
| Buprenorphine | 1296 | 41 (3.2) | 2139 | 37 (1.7) | 1.86 (1.18–2.91) | 0.007 |
| Fentanyl | 1293 | 31 (2.4) | 2452 | 35 (1.4) | 1.70 (1.04–2.76) | 0.034 |
*Chi-square test.
CI, confidence interval; HCV, hepatitis C virus; OR, odds ratio.
For the pre-baby boomers (Table 4), the HCV-positive group was significantly more likely than the HCV-negative group to test positive for non-prescribed marijuana (OR 3.14, 95% CI 1.54–6.41) and cocaine (OR 6.44, 95% CI 1.59–26.06). The HCV-positive group was significantly more likely to test negative for prescribed benzodiazepines than the HCV-negative group (OR 1.96, 95% CI 1.11–3.48). There was no significant difference for any other drug class.
DISCUSSION
This study demonstrated important differences between HCV-positive and HCV-negative patients as well as interesting generational differences. Specimens from HCV-positive patients had higher rates of non-prescribed drug positivity than those from HCV-negative patients in each generation. The difference was prominent in post-baby boomers, where over 76% of inconsistent specimens from HCV-positive patients demonstrated non-prescribed drug use in addition to prescribed drug use, compared to 55% of those from HCV-negative patients. The drug classes exhibiting the biggest differences between HCV-positive and HCV-negative post-baby boomers were cocaine and opiates. Surprisingly, there was a stronger association between HCV infection and heroin (OR 12.0, 95% CI 6.2–23.3) and non-prescribed fentanyl (OR 3.4, 95% CI 2.4–4.9) in the baby boomer population than there was in the post-baby boomer population (heroin: OR 1.6 95% CI 1.4–1.9; non-prescribed fentanyl: OR 1.5 95% CI 1.3–1.8). HCV-positive pre-baby boomers were more likely to test positive for recreational drugs (marijuana and cocaine), but there were no statistically significant differences in positivity rates for medications that are more typically prescribed.
Consistent with previous findings, the proportion of HCV-positive patients in our study was significantly higher among baby boomers (28%) than post-baby boomers (22%) and pre-baby boomers (13%). While the proportion of pain management patients that were HCV-positive was very near the study average (25.7% and 25.1%, respectively), the rate of HCV-positivity between baby boomers (26.6%) and post-baby boomers (26.0%) within the pain management group was more similar than for any other provider type. It is important to note that rates of HCV infection have increased rapidly since 2010 in the post-baby boomer population, particularly in those under 40 years of age (CDC, 2017c) and future studies may find more similar rates between baby boomers and post-baby boomers. While there were similarities in risk factors for HCV between these groups (proportions of males, Medicaid patients, and residence in the mid-Atlantic states), there were also interesting differences. Most notably, baby boomers and pre-baby boomers in non-metropolitan areas had the lowest rates of HCV positivity, while post-baby boomers in non-metropolitan areas had the highest rate. Overall, and in nearly all demographic categories, specimens from post-baby boomers demonstrated significantly higher rates of inconsistent drug test results than those from baby boomers or pre-baby boomers, though these differences were often small.
The relationship between injection opioid use and HCV has been well documented (Aceijas and Rhodes, 2007; Nelson et al., 2011; Spelman et al., 2015; Alter, 2007). Thus, as expected, many of the commonly misused drugs are in the opioid class. It is likely that many of the HCV-positive patients contracted HCV due to injection of opioids. However, use of opioid medications by patients indicated in this study may also be due to the presence of pain with chronic HCV. Clinicians may favor opioid analgesic use in this population as over-the-counter pain relievers such as acetaminophen and nonsteroidal anti-inflammatory drugs (NSAIDs) can contribute to liver complications in HCV-positive patients (Nguyen et al., 2008).
Benzodiazepine drug group misuse was alarmingly high as well. For people who use opioids, this may be due to benzodiazepines potentiating the narcotic effects of the opioid drugs (Lintzeris et al., 2007; Jones et al., 2012). The finding that marijuana and alcohol metabolite positivity did not differ substantially by HCV status in the post-baby boomer group suggest high levels of use for the most available substances regardless of HCV status. However, there was a strong association between HCV positivity and cocaine use. There was also a relationship between HCV positivity and not testing positive for prescribed buprenorphine and morphine. Perhaps these points, along with the higher rates of non-prescribed opioid use, indicate particularly high-risk behaviors for post-baby boomers who are HCV positive.
The CDC released an opioid prescribing guideline in March 2016 (Dowell et al., 2016). These guidelines recommend drug testing before starting and periodically during opioid treatment. The data presented here indicate that drug testing may play an important role in improving health outcomes for those who are HCV positive and prescribed controlled medications. Given the higher rates of non-prescribed use of many drugs in specimens from these HCV-positive individuals, including heroin and fentanyl, screening for non-prescribed or illicit drugs creates the opportunity for treatment interventions. The considerably higher rates of HCV in this study population compared to the general population (approximately 1%, (CDC, 2017a)) and those tested at Quest Diagnostics (approximately 5%, (internal Quest Diagnostics communication)) suggest that screening for HCV in the prescription drug monitoring context, even among non-baby boomers, may be an efficient means of identifying those with HCV. The higher rate of HCV may also suggest a considerable proportion of the pre-baby boomer group in this population use or have used injection drugs, with recent survey results suggesting around one-third of young users of injection drugs are HCV positive (CDC, 2017b).
A major strength of this study is the large, geographically diverse cohort that enabled us to stratify analyses by generation and show differing patterns of inconsistent drug test results between baby boomers and populations born before and after the baby boomers. We were also able to show differences in the drug classes most often associated with inconsistent drug test results between these generations, highlighting troubling patterns of inconsistency and potentially dangerous drug interaction implications for prescribers. Use of drug testing data obtained by mass spectrometry allowed analysis of demonstrated drug use, as opposed to prescription information or survey results. This provides a more accurate view as to actual drugs used, including prescribed, non-prescribed, and illicit.
This study also has limitations. This retrospective analysis included only patients screened for HCV infection, which introduced a selection bias, as evidenced by the approximately 5 times higher rate of HCV positivity in this population compared to Quest Diagnostics testing in the national population. It is possible that in some cases patients in our study were tested for drugs because their healthcare providers suspected a higher probability of misuse, while the index of suspicion was lower for others who were not tested. However, with the 2016 CDC guideline recommending all patients prescribed opioids be tested before and periodically during treatment (Dowell et al., 2016), this cohort may be representative of patients whose healthcare providers are already following best practice guidelines. In addition, history of injection drug use may be the reason a person was tested for HCV; this could potentially bias certain drug class analyses. Different screening recommendations for various generations could also create different types of selection biases, possibly influencing the generational differences observed in this study. We excluded patients in addiction treatment because their results are markedly different from those of other patients, and would skew many results of the study in a significant way. While we believe this is a strength of the study in that it makes the results more generalizable to the US patient population, it does not allow for analysis of the addiction treatment population, which may be of particular interest for this subject matter. In the logistic regression models for drug use classes the number of tests per patient was not controlled for. The cohort of pre-baby boomers, born before 1945, was smaller (n = 759) than the other 2 generational cohorts. More than half of the prescription drug monitoring tests came from 2 HHS regions (3 and 4), and over a third of patients came from HHS region 4. These regions have been among the regions most affected by the rising drug epidemic in the United States and the related epidemic of HCV infection (CDC, 2016, 2017c).
CONCLUSIONS
This study confirms, to a large extent, previously held assertions about the relationship between HCV and drug use as well as varying demographic factors. To our knowledge, this is the first study quantifying these relationships in a prescription drug monitoring context. The patterns of inconsistent drug test results and types of drugs misused suggest that HCV-positive patients display more high-risk behavior than HCV-negative patients even beyond opioid misuse, particularly in the post-baby boomer generation. Although the relationship between inconsistent drug use and patient generation was expected, the drug classes most often associated with inconsistent drug test results are different for different generations of patients, which demonstrates troubling patterns of inconsistency and potentially dangerous drug interaction implications for prescribers. Physicians and other health professionals should consider these patterns when monitoring for both prescription and illicit drugs, the results of which can impact treatment decisions including prescribing analgesics.
Footnotes
This work was funded by Quest Diagnostics. Quest Diagnostics provided support in the form of salaries for FLM, JKN, and HWK and consulting fees for JG, but did not have any additional role in the study design, collection, analysis, interpretation of data, writing of the manuscript, or decision to publish. The corresponding author had full access to all the data in the study and had final responsibility for the decision to submit for publication. None of the authors have any other conflict of interests to report.
REFERENCES
- Aceijas C, Rhodes T. Global estimates of prevalence of HCV infection among injecting drug users. Int J Drug Policy 2007; 18:352–358. [DOI] [PubMed] [Google Scholar]
- Alter MJ. Epidemiology of hepatitis C virus infection. World J Gastroenterol 2007; 13:2436–2441. [DOI] [PMC free article] [PubMed] [Google Scholar]
- Belani H, Chorba T, Fletcher F, et al. Integrated prevention services for HIV infection, viral hepatitis, sexually transmitted diseases and tuberculosis for persons who use drugs illicitly. Summary guidance from CDC and the U.S. Department of Health and Human Services. MMWR Recomm Rep 2012; 61 (No. RR-5):1–40. [PubMed] [Google Scholar]
- Carlson RG, Nanhas RW, Martins SS, et al. Predictors of transition to heroin use among initially non-opioid dependent illicit pharmaceutical opioid users: a natural history study. Drug Alcohol Depend 2016; 160:127–134. [DOI] [PMC free article] [PubMed] [Google Scholar]
- Centers for Disease Control and Prevention (CDC). 2010. Sexually Transmitted Diseases Treatment Guidelines, 2010. Available at: http://www.cdc.gov/std/treatment/2010/hepC.htm Accessed July 18, 2017. [Google Scholar]
- Centers for Disease Control and Prevention (CDC). 2012. NCHHSTP Newsroom. CDC Now Recommends All Baby Boomers Receive One-Time Hepatitis C Test. Available at: http://www.cdc.gov/nchhstp/newsroom/2012/HCV-Testing-Recs-PressRelease.html Accessed July 18, 2017. [Google Scholar]
- Centers for Disease Control and Prevention (CDC). 2016. Injury Prevention & Control: Opioid Overdose. Available at: http://www.cdc.gov/drugoverdose/data/statedeaths.html Accessed July 18, 2017. [Google Scholar]
- Centers for Disease Control and Prevention (CDC). 2017a. Viral Hepatitis—Statistics & Surveillance. Available at: http://www.cdc.gov/hepatitis/statistics/index.htm Accessed July 18, 2017. [Google Scholar]
- Centers for Disease Control and Prevention (CDC). 2017b. Viral Hepatitis—Hepatitis C Information. Available at: http://www.cdc.gov/hepatitis/hcv/hcvfaq.htm#section1 Accessed July 18, 2017. [Google Scholar]
- Centers for Disease Control and Prevention (CDC). 2017c. Surveillance for Viral Hepatitis—United States, 2015. Available at: https://www.cdc.gov/hepatitis/statistics/2015surveillance/index.htm Accessed July 18, 2017. [Google Scholar]
- Dowell D, Haegerich TM, Chou R. CDC Guideline for prescribing opioids for chronic pain—United States, 2016. MMWR Recomm Rep 2016; 65 (No. RR-1):1–49. [DOI] [PubMed] [Google Scholar]
- Guy GP, Jr, Zhang K, Bohm MK, et al. Vital signs: changes in opioid prescribing in the United States, 2006–2015. MMWR Morb Mortal Wkly Rep 2017; 66:697–704. [DOI] [PMC free article] [PubMed] [Google Scholar]
- Jones JD, Mogali S, Comer SD. Polydrug abuse: a review of opioid and benzodiazepine combination use. Drug Alcohol Depend 2012; 125:8–18. [DOI] [PMC free article] [PubMed] [Google Scholar]
- Jordan AE, Jarlais DD, Hagan H. Prescription opioid misuse and its relation to injection drug use and hepatitis C virus infection: protocol for a systematic review and meta-analysis. Syst Rev 2014; 3:95. [DOI] [PMC free article] [PubMed] [Google Scholar]
- Joy JB, McCloskey RM, Nguyen T, et al. The spread of hepatitis C virus genotype 1a in North America: a retrospective phylogenetic study. Lancet Infect Dis 2016; 16:698–702. [DOI] [PMC free article] [PubMed] [Google Scholar]
- Lake S, Kennedy MC. Health outcomes associated with illicit prescription opioid injection: a systematic review. J Addict Dis 2016; 35:73–91. [DOI] [PubMed] [Google Scholar]
- Lankenau SE, Teti M, Silva K, et al. Patterns of prescription drug misuse among young injection drug users. J Urban Health-Bull New York Acad Med 2012; 89:1004–1016. [DOI] [PMC free article] [PubMed] [Google Scholar]
- Lintzeris N, Mitchell TB, Bond AJ, et al. Pharmacodynamics of diazepam co-administered with methadone or buprenorphine under high dose conditions in opioid dependent patients. Drug Alcohol Depend 2007; 91:187–194. [DOI] [PubMed] [Google Scholar]
- Ly KN, Xing J, Klevens RM, et al. The increasing burden of mortality from viral hepatitis in the United States between 1999 and 2007. Ann Intern Med 2012; 156:271–278. [DOI] [PubMed] [Google Scholar]
- Martins SS, Santaella-Tenorio J, Marshall BDL, et al. Racial/ethnic differences in trends in heroin use and heroin-related risk behaviors among nonmedical prescription opioid users. Drug Alcohol Depend 2015; 151:278–283. [DOI] [PMC free article] [PubMed] [Google Scholar]
- National Institute on Drug Abuse. 2000. Facts About Drug Abuse and Hepatitis C. Available at: https://archives.drugabuse.gov/NIDA_Notes/NNVol15N1/Tearoff.html Accessed July 18, 2017. [Google Scholar]
- Nelson PK, Mathers BM, Cowie B, et al. The epidemiology of viral hepatitis among people who inject drugs: results of global systematic reviews. Lancet 2011; 378:571–583. [DOI] [PMC free article] [PubMed] [Google Scholar]
- Nguyen GC, Sam J, Thuluvath PJ. Hepatitis C is a predictor of acute liver injury among hospitalizations for acetaminophen overdose in the United States: a nationwide analysis. Hepatology 2008; 48:1336–1341. [DOI] [PubMed] [Google Scholar]
- Rudd RA, Seth P, David F, et al. Increases in drug and opioid-involved overdose deaths—United States, 2010–2015. MMWR Morbid Mortal Wkly Rep 2016; 65:1445–1452. [DOI] [PubMed] [Google Scholar]
- Smith BD, Morgan RL, Beckett GA, et al. Recommendations for the identification of chronic hepatitis C virus infection among persons born during 1945–1965. MMWR Recomm Rep 2012; 61 (RR-4):1–32. [PubMed] [Google Scholar]
- Spelman T, Morris MD, Zang G, et al. A longitudinal study of hepatitis C virus testing and infection status notification on behaviour change in people who inject drugs. J Epidemiol Community Health 2015; 69:745–752. [DOI] [PMC free article] [PubMed] [Google Scholar]
- Suryaprasad AG, White JZ, Xu F, et al. Emerging epidemic of hepatitis C virus among young non urban persons who inject drugs in the United States, 2006-2012. Clin Infect Dis 2014; 59:1411–1419. [DOI] [PubMed] [Google Scholar]
- United States Department of Agriculture Economic Research Service. Rural-Urban Continuum Codes. Available at: http://www.ers.usda.gov/data-products/rural-urban-continuum-codes/.aspx Accessed November 29, 2016. [Google Scholar]
- Valdiserri R, Khalsa J, Dan C, et al. Confronting the emerging epidemic of HCV infection among young injection drug users. Am J Public Health 2014; 104:816–821. [DOI] [PMC free article] [PubMed] [Google Scholar]
- Ziebell JE, Iqbal K, Patel RC, et al. Increases in hepatitis C virus infection related to injection drug use among persons aged <30 years—Kentucky, Tennessee, Virginia, and West Virginia, 2006–2012. MMWR 2015; 64:453–458. [PMC free article] [PubMed] [Google Scholar]