

INTRODUCTION
Ascites is a common complication of decompensated cirrhosis. Approximately 5–10% of cirrhotic patients with ascites do not respond adequately to sodium restriction and diuretic treatment [1]. These patients with refractory ascites experience severe limitations in the quality of life due to recurring tense ascites, suffer from additional related complications including spontaneous bacterial peritonitis and hepatorenal syndrome, and have a short survival [2,3]. The two main therapeutic options for refractory ascites are serial large-volume paracentesis (LVP) and transjugular intrahepatic portosystemic shunt (TIPS) creation. There are stark contrasts between these treatment strategies in terms of clinical outcomes, risk profiles, patient experience, and resource utilization. TIPS is a costly and complex procedure performed in an inpatient setting. LVP is a simple outpatient procedure but usually needs to be repeated frequently and indefinitely. While TIPS can yield a longer survival, better ascites control, and a lower variceal bleeding rate, it can also increase the risk of hepatic encephalopathy (HE) which may severely limit the quality of life [3].
Cost-effectiveness analysis allows for an objective comparison of two treatment options that differ in their associated health outcomes and costs. It can provide important perspectives on which management strategy is more clinically beneficial and economically conscious for a particular healthcare system. The goal of this study is to compare the cost-effectiveness of LVP and TIPS for treatment of refractory ascites in cirrhotic patients using a model that incorporates clinical outcomes data derived from randomized controlled trials (RCTs), health utilities data derived from literature, and cost data derived from a nationally representative U.S. claims database. Institutional review board was not required for this study as no human subjects were involved.
DEFINITIONS OF HEALTH ECONOMIC TERMS
Quality adjusted life years (QALYs):
A measure that encapsulates the impact of a treatment on a patient’s length of life and also the impact on their health-related quality of life.
Incremental cost-effectiveness ratio (ICER):
The difference in cost between two possible interventions, divided by the difference in their clinical effect. In this analysis, effect is measured in QALYs.
Willingness to pay (WTP):
The maximum amount that those affected would individually be willing to pay for improvements in their own and others’ healthcare. In this analysis, this reflects the maximum amount a society would pay for one additional QALY.
Health utility (HU):
Numeric values that quantifies the strength of an individual’s preferences for specific health outcomes, with one reflecting a state of perfect health and zero equivalent to being deceased.
Short-form-36 (SF-36):
A 36 question item, patient-reported survey which measures health status.
Short-form-6-dimension (SF-6D):
An instrument commonly used in health economic analyses for measuring health status. The SF-6D was designed for calculating QALYs using information from the SF-36.
Deterministic model:
A type of mathematical model that assumes that outcomes are determined through known relationships, without accommodating random variation in model inputs.
Probabilistic model:
A type of mathematical model that incorporates randomness and probability distributions of model inputs into the outcome calculations.
Akaike information criterion:
An estimate of the relative quality of statistical models; often used to select a model that fits the data well without the use of too many parameters.
METHODS
Markov model and assumptions
A decisional Markov model (Figure 1) was developed to estimate the payer cost and quality adjusted life years (QALYs) associated with LVP and TIPS treatment strategies for cirrhotic patients with medically refractory ascites. The base case for the simulation was that of a 57-year-old male with history of cirrhosis and portal hypertension refractory to medical therapy with outcomes following LVP or TIPS, corresponding to the mean population values obtained from a meta-analysis that pooled individual patient-level data from multiple RCTs [3]. The model assumed a monthly cycle length with mid-cycle correction (to accommodate non-discrete, gradual transition of the population between health states). A 15-year time horizon was chosen, as this represented the estimated time after which the cohort had a >95% probability of death. A standard discount rate of 3% was used for QALY and costs [4].
Figure 1:

Markov Model for Different Treatment Strategies and Associated Outcomes. (See Table 1 for definitions of abbreviations).
The model incorporated two treatment branches, LVP and TIPS, reflecting the two treatment arms to which patients in the RCTs were assigned. Once one intervention is chosen, it was assumed that the patient cannot crossover to the other treatment strategy. Each patient was also assumed to have a probability of achieving control of ascites equal to that of the rate for the entire treatment arm. Similarly, the probability of developing HE or other complications related to portal hypertension was assumed be equal to the cumulative probability for the entire treatment arm at 12 months. Because treatment arm-level data on time to ascites control or HE was not available, it was assumed that all patients achieved ascites control and/or developed HE 4 months after treatment.
Model parameter estimates
Model inputs and sources from which they were derived are summarized in Table 1. Clinical parameters (survival, rates of ascites control, HE, and portal hypertension related complications) were derived from Salerno et al.’s individual patient-level meta-analysis [3]. As the only published study to synthesize the patient-level data from the prospective RCTs of the two interventions of interest in cirrhotic patients with refractory ascites, this study was determined to provide the best available estimates for the model. Overall survival was obtained from the published Kaplan-Meier curves in the Salerno study. Engauge Digitizer Software [5] was used to extract the data points from the survival curve in the LVP cohort, and these data points were then used to fit parametric survival models using the method described by Hoyle and Henley [6].
Table 1.
Model Parameter Inputs and Sources
| Model Input | Abbreviation* | Value | Derivation/Source |
|---|---|---|---|
| Transition Probability Variables | |||
| Ascites rate following TIPS | rAscitesTIPS | 0.42 | Salerno 2007 (Referenced [3]) |
| Ascites rate following LVP | rAscitesLVP | 0.90 | Salerno 2007 |
| HE rate following TIPS | HeTIPS | 0.30 | Salerno 2007 |
| HE rate following LVP | HeLVP | 0.25 | Salerno 2007 |
| Cost Parameters† | US Dollars | ||
| Cost of assignment to TIPS | cTIPS | 89,989 | Salerno 2007; MarketScan data (Referenced [12]) |
| Cost of assignment to LVP | cLVP | 35,010 | Salerno 2007; MarketScan data |
| Monthly cost of ascites state | cAscites | 10 | Salerno 2007; MarketScan data |
| Monthly cost of HE state | cHE | 759 | Salerno 2007; MarketScan data |
| Utility of Markov States Per Cycle | |||
| Ascites controlled, HE absent | uNone | 0.73 | Les 2010 (Referenced [10]) |
| Ascites controlled, HE present | uHE | 0.66 | Les 2010 |
| Ascites not controlled, HE absent | uAscites | 0.70 | Les 2010 |
| Ascites not controlled, HE present | uHeAscites | 0.63 | Les 2010 |
| Mortality Rates | |||
| Lambda parameter survival analysis | 0.09 | Salerno 2007 | |
| Ancillary parameter in Weibull distribution | 0.75 | Salerno 2007 | |
| Relative risk of TIPS vs LVP | 0.61 | Salerno 2007 | |
According to the Akaike information criterion, Weibull, log-normal, and log-log models provided good fit for the curve. A Weibull distribution was used to model survival because it allows for increasing or decreasing hazard rate and does not have long tails in the survival function which would be unusual in a population with a chronic disease associated with high mortality rates. Using the LVP survival curve that was thus derived, overall survival for the TIPS cohort was then derived by applying the estimated hazard ratio of 0.61 which was reported in the Salerno study.
Health utility estimates and their associated standard errors were derived from the study from Les et al. [7]. This study, which prospectively measured health-related quality of life (HRQOL) in 212 patients with liver cirrhosis, was selected as the most representative of the study population after a review of the published literature. Using the model described in this study, Short Form-36 (SF-36) scores for the population represented in the Salerno study [3] were calculated for each possible health state. Subsequently, SF-36 scores were converted to Short Form-6-Dimension health utility scores using the method described by Hanmer [8].
Cost derivations are detailed in Table 2. The cost perspective was from that of the payer. Cost values were derived from a national claims database for relevant procedures and hospitalizations [9]. Pharmaceutical costs were derived from the 2015 Medicare Part D Prescriber Public Use Files [10]. Costs were inflated to 2017 US dollars using annual inflation rates for medical expenditures [11]. Rates of procedure or hospitalization use were derived from those reported by treatment arm in the Salerno et al. study [3]. Specifically, patients in the TIPS arm were assumed to incur the cost of the TIPS procedure, the cost of a TIPS revision multiplied by 10% (the percentage of patients requiring a revision in the TIPS arm in Salerno et al.), the cost of a LVP procedure multiplied by 1.6 (the mean number of LVPs required in the TIPS arm), and the cost of treatment of portal hypertension, mild HE, and severe HE multiplied by the respective percentage of patients that experienced each type of event in the TIPS arm. Similarly, patients in the LVP arm were assumed to incur the cost of LVP procedures multiplied by 7.1 (the mean number of LVPs required in the LVP arm) and the cost of treatment of portal hypertension, mild HE, and severe HE multiplied by the percentage of patients that experienced episodes of each type of event in the LVP arm.
Table 2.
Cost Parameter Inputs and Derivations
| Procedure/Condition | Unit Cost in US Dollars | Unit Cost in 2017 US Dollars | Frequency | Cost in 2017 US Dollars | Derivation/Source |
|---|---|---|---|---|---|
| TIPS | |||||
| TIPS procedure | 46,666.00 | 50,865.94 | 1 | 50,865.94 | MarketScan data (Referenced [12]) |
| TIPS revision | 11,194.00 | 12,201.46 | 0.1 | 1,220.15 | MarketScan data |
| LVP procedure | 1,714.00 | 1,868.26 | 1.6 | 2,989.22 | Salerno 2007 (Referenced [3]); MarketScan data |
| PHTN complication treatment |
48,734.00 | 53,120.06 | 0.15 | 8,199.74 | Salerno 2007; MarketScan data |
| Mild HE treatment | 574.00 | 625.66 | 1.13 | 707.00 | Salerno 2007; MarketScan data |
| Severe HE treatment | 35,088.00 | 38,245.92 | 0.68 | 26,007.23 | Salerno 2007; MarketScan data |
| Cost of assignment to TIPS | 89,989.26 | ||||
| LVP | |||||
| LVP procedure | 1,714.00 | 1,824.52 | 7.1 | 12,169.40 | Salerno 2007; MarketScan data |
| PHTN complication treatment |
48,734.00 | 51,876.37 | 0.29 | 14,057.88 | Salerno 2007; MarketScan data |
| Mild HE treatment | 574.00 | 611.01 | 0.63 | 361.62 | Salerno 2007; MarketScan data |
| Severe HE treatment | 35,088.00 | 37,350.47 | 0.24 | 8,421.12 | Salerno 2007; MarketScan data |
| Cost of assignment of LVP | 35,010.02 | ||||
| Ascites | |||||
| Furosemide | 3.39 | 3.59 | 1 | 3.59 | Medicare Part D Prescriber Public Use Files (Referenced [13]) |
| Spironolactone | 6.42 | 6.81 | 1 | 6.81 | Medicare Part D Prescriber Public Use Files |
| Monthly cost of ascites state | 10.40 | ||||
| HE | |||||
| Lactulose | 16.75 | 17.76 | 1 | 17.76 | Medicare Part D Prescriber Public Use Files |
| Rifaximin | 1,398.25 | 1,482.15 | 0.5 | 741.07 | Medicare Part D Prescriber Public Use Files |
| Monthly cost of HE state | 758.83 | ||||
TIPS, transjugular intrahepatic portosystemic shunt
LVP, large volume paracentesis
PHTN, portal hypertension
HE, hepatic encephalopathy
GIB, gastrointestinal bleeding
SBP, spontaneous bacterial peritonitis
HRS, hepatorenal syndrome
The model was designed and programmed by an investigator (S.W.K.) with an advanced degree in Health Services methodology. All modeling and calculations were performed with Excel software (Microsoft Corporation, Redmond, WA).
Outcomes
Outcomes were measured in QALY gained and incremental cost-effectiveness ratio (ICER) of each treatment strategy using a deterministic model and mean values from a probabilistic model with 1,000 trials. Cost-effectiveness acceptability curves were generated for willingness-to-pay (WTP) values from US $0-$100,000.
Sensitivity Analyses
One-way and probabilistic sensitivity analyses were performed on the input parameters to evaluate how uncertainties in decision model input variables impact the output results. One-way sensitivity analyses were performed in which model parameters were varied over an uncertainty range of +/−20% (Table 3). Probabilistic sensitivity analyses were performed using probability distribution parameters derived from the same published data sources as for the base values (Table 1). The proportions of patients with ascites control and HE were assumed to follow a beta distribution. For survival parameters, standard errors for the statistically significant baseline covariates in the Cox regression model were back-calculated from the published 95% confidence intervals. Cholesky decomposition of the covariance matrix was used to incorporate estimate uncertainty in the survival curve. For the relative risk of death following TIPS versus LVP, a log-normal distribution was assumed with the mean and standard error back-calculated from the log of the reported 95% confidence intervals. Payer costs were assumed to follow a gamma distribution using means and standard error derived from the claims database. Health utility was assumed to follow a beta distribution, with standard error derived from the literature and alpha and beta for the distribution calculated using the method of moments [12].
Table 3.
One-way Sensitivity Analysis Ranges and Probabilistic Sensitivity Analysis Distributions
| One-way Sensitivity Analysis | Probabilistic Sensitivity Analysis | |||
|---|---|---|---|---|
| Model Input | Base | Low | High | Distribution |
| Transition Probability Variables | ||||
| Ascites rate following TIPS | 0.42 | 0.34 | 0.51 | Beta: α=63, ß=86 |
| Ascites rate following LVP | 0.90 | 0.72 | 1.08 | Beta: α =140, ß=16 |
| HE rate following TIPS | 0.30 | 0.24 | 0.36 | Beta: α =45, ß=104 |
| HE rate following LVP | 0.25 | 0.20 | 0.30 | Beta: α=39, ß=117 |
| Cost Parameters (US Dollars) | ||||
| Cost of assignment to TIPS | 89,989 | 71,991 | 107,987 | Gamma: α=1.34, ß=67,193 |
| Cost of assignment to LVP | 35,010 | 28,008 | 42,012 | Gamma: α=0.88, ß=39,579 |
| Monthly cost of ascites state | 10 | 8 | 12 | Gamma: α=1, ß=10.40 |
| Monthly cost of HE state | 759 | 607 | 911 | Gamma: α=1, ß=759.83 |
| Utility of Markov States Per Cycle | ||||
| Ascites controlled, HE absent | 0.73 | 0.58 | 0.87 | Beta: α=6014, ß=2271 |
| Ascites controlled, HE present | 0.66 | 0.53 | 0.79 | Beta: α=6167, ß=3197 |
| Ascites not controlled, HE absent | 0.70 | 0.56 | 0.83 | Beta: α=6133, ß=2682 |
| Ascites not controlled, HE present | 0.63 | 0.50 | 0.75 | Beta: α=6111, ß=3614 |
| Mortality Rates | ||||
| Lambda parameter survival analysis | 0.09 | 0.08 | 0.11 | Cholesky decomposition |
| Ancillary parameter in Weibull distribution |
0.75 | 0.60 | 0.90 | Cholesky decomposition |
| Relative risk of TIPS vs LVP | 0.61 | 0.41 | 0.91 | Lognormal: mean=−0.4943, standard error=0.7795 |
RESULTS
The health utility per year of the modeled health states were estimated as follows: 0.73 for controlled ascites without HE; 0.66 for controlled ascites with HE; 0.70 for uncontrolled ascites without HE; and 0.63 for uncontrolled ascites with HE. The cost of assignment to TIPS was estimated to be $89,989 (Table 2). The cost of assignment to LVP was estimated to be $35,010. For each monthly cycle, patients with persistent HE were calculated to accrue an additional $759 in pharmaceutical cost, representing the cost of providing lactulose to all and rifaximin to half of the patients with HE. Similarly, for each monthly cycle, patients with persistent ascites were calculated to accrue an additional $10.40 in pharmaceutical cost, representing the cost of furosemide and spironolactone therapy.
A deterministic model found that LVP resulted in 1.72 QALY gained at a cost of $41,391, or $24,065/QALY. TIPS resulted in 2.76 QALY gained at a cost of $100,536, or $36,427/QALY. This equated to an incremental cost-effectiveness ratio (ICER) of TIPS versus LVP of $57,003/QALY.
The tornado diagram in Figure 3 summarizes the relative impact of the model variables in the deterministic model. The most value-sensitive variable was the ancillary parameter in the Weibull distribution for the LVP group’s survival curve. The ICER of TIPS versus LVP ranged from $46,123 to $100,857 over the range of values used in one-way sensitivity analysis. The next most value-sensitive variable was the relative risk of assignment to TIPS compared with LVP, which resulted in ICER estimates that ranged from $38,623 to $92,752 over the range of values used in one-way sensitivity analysis.
Figure 3:
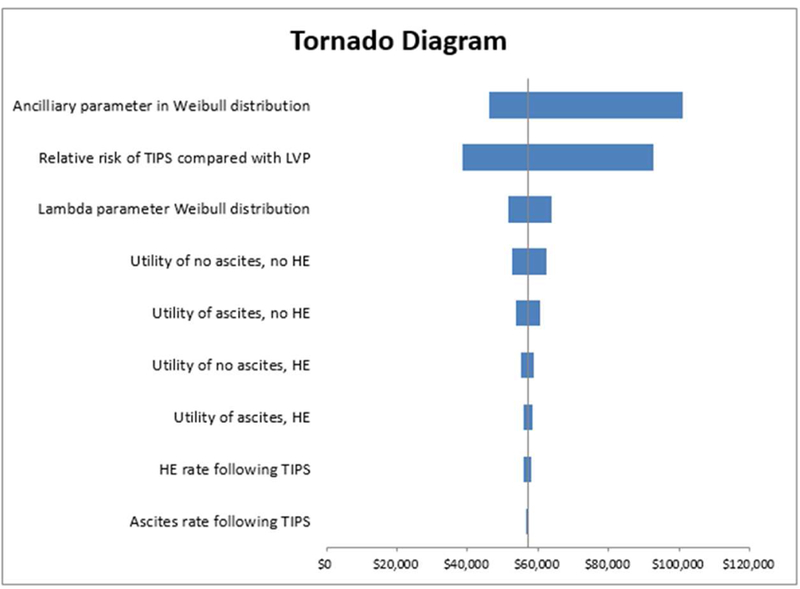
Tornado Diagram of One-Way Sensitivity Analysis.
A probabilistic model found that LVP resulted in 1.75 QALY gained at a cost of $41,489 whereas TIPS resulted in 3.01 QALY gained at a cost of $101,539. This equated to an ICER of $47,541/QALY. The hazard ratio of TIPS versus LVP was 0.61 (0.41–0.91) (Table 3). The probability of cost-effectiveness acceptability curves (Figure 2) crossed at WTP between $50,000–55,000. At a WTP of $100,000 TIPS has a 62% probability of being more cost effective than LVP.
Figure 2:

Probability Sensitivity Analysis Cost-Effectiveness Acceptability Curve for Willingness-to-Pay Range $0-$100,000. LVP=Large volume paracentesis. TIPS=Transjugular intrahepatic portosystemic shunt.
DISCUSSION
Global prevalence of cirrhosis from autopsy studies ranges from 4.5% to 9.5% of the general population [13]. Cirrhosis results in significant mortality, morbidity, and reduction in HRQOL. Within the U.S., the annual cost associated with cirrhosis and its sequelae, excluding hepatitis C virus treatment, is approximately $1.4 billion [13].
Ascites develops in half of cirrhotic patients within 10 years of diagnosis and is associated with a 50% mortality rate within 2–5 years [14]. Repeat LVP and TIPS creation are the mainstays of management for those patients with persistent ascites despite dietary modification and maximal diuretic therapy. Which of these two treatments is most appropriate is an important clinical question that has been explored in five RCTs to date [3,15–18]. Patients treated with TIPS compared to LVP were found to have improved survival in two of five trials, while no difference was found in three trials. The rate of ascites control was significantly higher with TIPS compared to LVP in four of five trials, but with consistently higher rates of HE after TIPS. Salerno et al. performed a meta-analysis of patient-level data from these RCTs and found a survival advantage of TIPS, while again confirming differential rates of ascites control and HE between the two treatment strategies [3].
TIPS can achieve higher rates of ascites control, but with a greater incidence of HE compared with LVP. TIPS creation is performed as a single-session inpatient procedure under general anesthesia with potentially high-grade complications including bleeding, hepatic failure, and death. While LVP is a low-risk, simple, outpatient procedure, it needs to be repeated, sometimes as frequently as several times per week. Therefore, TIPS creation has a high up-front cost, whereas serial LVP may incur lower initial but high cumulative costs. Finally, there are expected differential impacts on HRQOL following the two treatment options.
Policymakers and healthcare providers face challenging decisions about resource allocation and how to prioritize spending within their healthcare systems [19]. Even in developed countries such as the U.S., spending on healthcare has consistently outpaced the growth of the overall economy, leading to often contentious public conversations about the relative “value” of healthcare services. When one treatment option results in better health outcomes but is also costlier than another, the ICER summarizes the extra cost per additional unit of clinical benefit (e.g. QALY). The present analysis found that TIPS results in higher QALY but at a greater cost compared with LVP, resulting in an ICER of $57,003/QALY. To put this value into context, direct-acting antiviral drugs, which are now widely accepted for treatment of chronic hepatitis C, have been calculated to have a similar ICER of $55,378/QALY [20].
Cost-effectiveness acceptability curves (Figure 2) assess the probability of one treatment being cost-effective compared to another at various WTP thresholds. This study found that at a WTP of $50,000/QALY, there is a negligible difference in cost-effectiveness of TIPS and LVP (i.e. the cost-effectiveness acceptability curves crossed at this level). However, at a WTP of $100,000/QALY, TIPS had a 62% probability of being more cost-effective than LVP. Historically, a WTP ratio of $50,000/QALY has been a benchmark for the value of care according to health policy experts [21]. This ratio has unclear origins but is often attributed to the U.S. decision to mandate Medicare coverage for patients with end-stage renal disease in the 1970s, when the cost-effectiveness ratio for dialysis was roughly $50,000/QALY [21]. In modern health economic analyses, some authors have argued that treatments with WTP ratios of <$50,000/QALY are generally considered attractive while those with WTP ratios of >$100,000/QALY are generally considered unattractive. However, others have criticized these values as outdated and artificially low [19], particularly in light of price inflation that has occurred since the 1970s. The World Health Organization has argued for a threshold of two to three times the per capita annual income, which would imply a U.S. threshold of $110,000–160,000/QALY [21]. Others have inferred a threshold of $200,000–300,000/QALY based on increases in healthcare spending over time and the health gains that have been associated with those increases [21]. Ultimately, there is no threshold that is appropriate in all healthcare related decisions, and no single threshold should exist for deciding whether a particular ICER is acceptable. The wealth and cultural norms of a nation or health system will determine what type of thresholds might be acceptable.
The limitations of this study include those inherent in any health economic model, including uncertainty around the model inputs and assumptions. The best available data were used for the model inputs. Specifically, survival and clinical data were collected across multiple RCTs [3], health utility values were derived from a prospective study including over 200 patients [7], and cost values were generated from a large national claims database encompassing millions of patients. Of these, the largest uncertainty was the health utility values, given that they were derived from a relatively small cohort in a single study. However, as summarized in the tornado diagram (Figure 3), the health utility value inputs had a much smaller impact on the ICER estimate compared to inputs obtained from the survival curves published in Salerno et al [3]. The study is also limited by the “memoryless” assumption of standard Markov models. In other words, a model was formed for a specific proportion of the cohort to end up in one health state 4 months following treatment and remain there until death. In reality, each patient would be expected to have improvement or worsening of symptoms at different time points after treatment and may potentially transition from one health state to another. However, the available published data did not provide enough longitudinal information to allow for this type of analysis. Finally, the RCTs that were included in the meta-analysis used for our Markov model are older; these studies compared TIPS with repeat LVP during the age of uncovered stents. There have been more recent studies comparing covered (polytetrafluoroethylene) to uncovered (bare metal) TIPS stents which demonstrated increased long-term patency rates with the former, resulting in fewer re-interventions, and perhaps requiring less frequent surveillance. A recent RCT from France evaluated the economic impact of covered TIPS stents. Perarnau et al. demonstrated an average cost per patient of 20,000 Euros in the covered stent versus 23,000 Euros in the bare stent group (p = 0.52), and a cost-effectiveness ratio of 38,100 Euros in the covered stent versus 63,900 Euros in the bare stent group (p = 0.079) [22]. Future cost-effectiveness studies may reveal that TIPS is even more cost-effective with the modern practice of using covered stents.
In conclusion, using a Markov model of two prevailing treatment strategies for medically refractory ascites with input parameters informed by the best available published literature and real-world data, an ICER of TIPS versus LVP of $57,003/QALY was calculated. At a WTP ratio of $100,000, TIPS has a 62% probability of being acceptable when compared to LVP. This study suggests that TIPS should be considered cost-effective in a society that places a relatively high value on health improvements, but less so in a country with lower levels of healthcare resources.
Acknowledgments
Grants and disclosures: Received salary support from the National Institutes of Health, National Center for Advancing Translational Sciences (KL2 TR000421).
Footnotes
Publisher's Disclaimer: This is a PDF file of an unedited manuscript that has been accepted for publication. As a service to our customers we are providing this early version of the manuscript. The manuscript will undergo copyediting, typesetting, and review of the resulting proof before it is published in its final citable form. Please note that during the production process errors may be discovered which could affect the content, and all legal disclaimers that apply to the journal pertain.
Contributor Information
Sharon W. Kwan, Department of Radiology and the Comparative Effectiveness, Cost, and Outcomes Research Center, University of Washington, Seattle, WA, Department of Interventional Radiology University of Washington Medical Center 1959 NE Pacific Street Seattle, WA 98195, shakwan@uw.edu Phone: (206) 598-1454
Stephen K. Allison, Department of Interventional Radiology University of Washington Medical Center 1959 NE Pacific Street Seattle, WA 98195, Phone: (206) 598-1454
Laurie S. Gold, Department of Radiology and the Comparative Effectiveness, Cost, and Outcomes Research Center, University of Washington, Seattle, WA, Comparative Effectiveness, Cost and Outcomes Research Center 4333 Brooklyn Ave. NE, Box 359455, 14th Floor Seattle, WA 98105, goldl@uw.edu Phone: (206) 543-2749
David S. Shin, Department of Interventional Radiology University of Washington Medical Center 1959 NE Pacific Street Seattle, WA 98195, dsshin@uw.edu Phone: (206) 598-1454
REFERENCES
- 1.Arroyo V, Ginès P, Gerbes AL, et al. Definition and diagnostic criteria of refractory ascites and hepatorenal syndrome in cirrhosis. International Ascites Club. Hepatology 1996;23(1):164–76. [DOI] [PubMed] [Google Scholar]
- 2.Guardiola J, Baliellas C, Xiol X, et al. External validation of a prognostic model for predicting survival of cirrhotic patients with refractory ascites. Am J Gastroenterol 2002;97(9):2374–8. [DOI] [PubMed] [Google Scholar]
- 3.Salerno F, Cammà C, Enea M, Rössle M, Wong F. Transjugular Intrahepatic Portosystemic Shunt for Refractory Ascites: A Meta-analysis of Individual Patient Data. Gastroenterology 2007;133:825–34. [DOI] [PubMed] [Google Scholar]
- 4.Weinstein MC, Siegel JE, Gold MR, Kamlet MS, Russell LB. Recommendations of the Panel on Cost-effectiveness in Health and Medicine. JAMA 1996;276(15):1253–8. [PubMed] [Google Scholar]
- 5.Mitchell M, Muftakhidinov B, Winchen T, et al. “Engauge Digitizer Software” Webpage: http://markummitchell.github.io/engauge-digitizer (accessed Oct 26, 2017).
- 6.Hoyle MW, Henley W. Improved curve fits to summary survival data: application to economic evaluation of health technologies. BMC Med Res Methodol 2011;11:139. [DOI] [PMC free article] [PubMed] [Google Scholar]
- 7.Les I, Doval E, Flavià M, et al. Quality of life in cirrhosis is related to potentially treatable factors. Eur J Gastroenterol Hepatol 2010;22(2):221–7. [DOI] [PubMed] [Google Scholar]
- 8.Hanmer J Predicting an SF-6D preference-based score using MCS and PCS scores from the SF-12 or SF-36. Value Health 2009;12(6):958–66. [DOI] [PMC free article] [PubMed] [Google Scholar]
- 9.MarketScan Databases | Truven Health Analytics n.d. http://truvenhealth.com/markets/life-sciences/products/data-tools/marketscan-databases (accessed May 11, 2017).
- 10.Medicare C for, Baltimore MS 7500 SB, Usa M. Part D Prescriber 2017. Webpage: https://www.cms.gov/Research-Statistics-Data-and-Systems/Statistics-Trends-and-Reports/Medicare-Provider-Charge-Data/Part-D-Prescriber.html (accessed Oct 26, 2017).
- 11.Bureau of Labor Statistics. Webpage: https://www.bls.gov/charts/consumer-price-index/consumer-price-index-by-category-line-chart.htm (accessed Oct 26, 2017).
- 12.Briggs A, Claxton K, Sculpher M. Decision modelling for Health Economic Evaluation Oxford, United Kingdom: Oxford University Press; 2011. [Google Scholar]
- 13.Lim YS, Kim WR. The global impact of hepatic fibrosis and end-stage liver disease. Clin Liver Dis 2008; 12: 733–746. [DOI] [PubMed] [Google Scholar]
- 14.Biecker E Diagnosis and therapy of ascites in liver cirrhosis. World J Gastroenterol 2011;17(10): 1237–48. [DOI] [PMC free article] [PubMed] [Google Scholar]
- 15.Rössle M, Ochs A, Gulberg V, et al. A comparison of paracentesis and transjugular intrahepatic portosystemic shunting in patients with ascites. N Engl J Med 2000;342(23):1701–7. [DOI] [PubMed] [Google Scholar]
- 16.Ginès P, Uriz J, Calahorra B, et al. Transjugular intrahepatic portosystemic shunting versus paracentesis plus albumin for refractory ascites in cirrhosis. Gastroenterology 2002;123(6):1839–47. [DOI] [PubMed] [Google Scholar]
- 17.Sanyal AJ, Genning C, Reddy KR, et al. The North American Study for the treatment of refractory ascites. Gastroenterology 2003;124(3):634–41. [DOI] [PubMed] [Google Scholar]
- 18.Salerno F, Merli M, Riggio O, et al. Randomized controlled study of TIPS versus paracentesis plus albumin in cirrhosis with severe ascites. Hepatology 2004;40(3):629–35. [DOI] [PubMed] [Google Scholar]
- 19.Cohen DJ, Reynolds MR. Interpreting the Results of Cost-Effectiveness Studies. J Am Coll Cardiol 2008;52(25):2119–26. [DOI] [PMC free article] [PubMed] [Google Scholar]
- 20.Chhatwal J, Kanwal F, Roberts MS, Dunn MA. Cost-effectiveness and budget impact of hepatitis C virus treatment with sofosbuvir and ledipasvir in the United States. Ann Intern Med 2015;162(6):397–406. [DOI] [PMC free article] [PubMed] [Google Scholar]
- 21.Neuman PJ, Cohen JT, Weinstein MC. Updating Cost-Effectiveness – The Curious Resilience of the $50,000-per-QALY Threshold. N ENGL J MED 371;9. [DOI] [PubMed] [Google Scholar]
- 22.Perarnau JM, Le Gouge A, Nicolas C, et al. Covered vs. uncovered stents for transjugular intrahepatic portosystemic shunt: a randomized controlled trial. JHepatol 2014;60(5):962–8. [DOI] [PubMed] [Google Scholar]