Abstract
The integration of intravascular ultrasound (IVUS) and intravascular photoacoustic (IVPA) imaging produces an imaging modality with high sensitivity and specificity which is particularly needed in interventional cardiology. Conventional side-looking IVUS imaging with a single-element ultrasound (US) transducer lacks forward-viewing capability, which limits the application of this imaging mode in intravascular intervention guidance, Doppler-based flow measurement, and visualization of nearly or totally blocked arteries. For both side-looking and forward-looking imaging, the necessity to mechanically scan the US transducer limits the imaging frame rate, and therefore array-based solutions are desired. In this paper, we present a low-cost, compact, high-speed, and programmable imaging system based on a field-programmable gate array (FPGA) suitable for dual-mode forward-looking IVUS/IVPA imaging. The system has 16 US transmit and receive channels and functions in multiple modes including interleaved photoacoustic (PA) and US imaging, hardware-based high-frame-rate US imaging, software-driven US imaging, and velocity measurement. The system is implemented in the register-transfer level, and the central system controller is implemented as a finite state machine. The system was tested with a capacitive micromachined ultrasonic transducer (CMUT) array. A 170-frames-per-second (FPS) US imaging frame rate is achieved in the hardware-based high-frame-rate US imaging mode while the interleaved PA and US imaging mode operates at a 60-FPS US and a laser-limited 20-FPS PA imaging frame rate. The performance of the system benefits from the flexibility and efficiency provided by low-level implementation. The resulting system provides a convenient backend platform for research and clinical IVPA and IVUS imaging.
Keywords: Photoacoustic imaging, ultrasound imaging, data acquisition, velocity measurement, FPGA, software/hardware co-design, finite state machine
I. Introduction
IN intravascular ultrasound (IVUS) imaging, a high-frequency (20-50 MHz) ultrasound (US) transducer is attached to a catheter, which is then inserted into a blood vessel to visualize its arterial structure with high imaging resolution [1]. The lumen dimensions and the morphological information about the arterial wall provided by IVUS imaging can be used to demonstrate the presence and extent of atherosclerosis and arterial calcification [2]–[4]. The radio frequency (RF) A-scan signals acquired with IVUS can be processed to measure the blood velocity for stenosis severity analysis [5]–[7]. Despite the unique value of IVUS imaging in clinical cardiology, this imaging modality is not considered a comprehensive diagnostic tool. The histopathological information provided by IVUS imaging is limited [8]. This imaging modality has low sensitivity in detecting lipid-rich lesions [9], which are highly related to the vulnerability of atherosclerotic plaques [10]. Intravascular photoacoustic (IVPA) imaging, an imaging modality that combines the contrast of optical absorption with the resolution and penetration depth of US imaging [11]–[14], complements IVUS imaging by mapping the lipid-specific chemical composition of the artery wall [15]. Integrating IVUS and IVPA imaging will result in a more comprehensive imaging system with potentially better sensitivity and specificity which is needed in interventional cardiology [16].
The first integrated IVPA and IVUS imaging system was implemented by Sethuraman et al. in 2006. In this system, a single-element side-looking transducer was used for imaging, and a complete image frame showing the cross section of the blood vessel was formed by mechanically rotating the imaging phantom. Although this method makes high-frame-rate real-time imaging difficult [17], [18], the mechanical-rotation-based imaging scheme continues to be in use today for IVPA and IVUS imaging system implementation [15], [19]–[21]. Lasers with a high repetition rate (up to 2 kHz) were used to boost the frame rate; the maximum frame rate achieved thus far is 25 frames per second (FPS) [15], which is significantly lower than the laser repetition rate. The side-looking imaging scheme lacks forward-viewing capability that is important in guiding intravascular interventions [22] and imaging nearly or totally blocked arteries [23] (e.g. chronic total occlusions [24]). Doppler and correlation-based velocity measurement cannot be used in side-looking imaging systems because the imaging plane is perpendicular to the blood flow. The decorrelation-based approach [6] can be used to measure blood velocity, but this approach requires extra calibration [25], which is difficult to perform in vivo. To enable forward-viewing capability and velocity measurement as well as to boost the frame rate of a combined IVPA and IVUS imaging system, a forward-looking transducer array can be used. With a forward-looking transducer array, the imaging plane is parallel to the blood flow, making Doppler and correlation-based velocity measurement feasible; and the acquisition of one image frame requires significantly fewer laser firings and US transmissions.
Transducer arrays and supporting frontend electronics for array-based forward-looking IVUS and IVPA imaging have been researched on during the past two decades [22], [26]–[35], and so have the backend imaging systems [36]–[39]. However, the backend systems still have room for improvement. The systems in [36]–[38] are based on programmable imaging systems (e.g., Verasonics, Inc., Redmond, WA), which are convenient to program from a high level but lack low-level programming flexibility and portability. The system in [39] is based on a field-programmable gate array (FPGA), which is significantly more portable than a general-purpose programmable system, and therefore more suitable for an environment such as the cath lab. However, the system reported in [39] was only used for data acquisition, and not for real-time imaging.
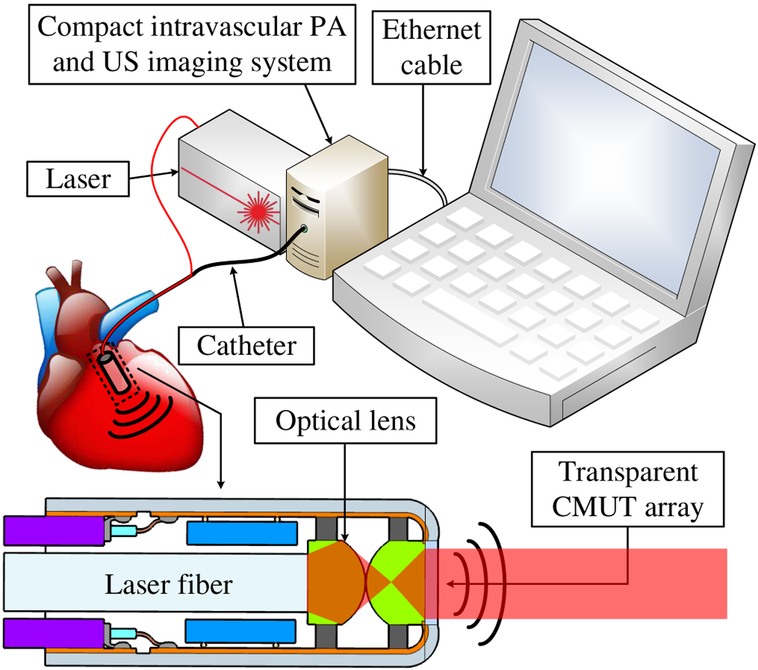
In this paper, we present a compact FPGA-based multimodal imaging system for forward-looking IVPA and IVUS imaging to support a catheter designed using a transparent capacitive micromachined ultrasonic transducer (CMUT) array [40], [41]. The system features US imaging, photoacoustic (PA) imaging, and velocity measurement. A preliminary version of the system that features US imaging exclusively was presented in [42]. With the data acquisition and processing logic implemented on a single FPGA, the system can be miniaturized (Fig. 1). An FPGA-based PA and US imaging system was implemented by Alqasemi el al. in 2011 [43], followed by two upgraded versions in 2012 [44] and 2014 [45], respectively. The system operates at a 20-FPS US and a 15-FPS interleaved PA and US imaging frame rate. A peripheral component interconnect express (PCIe) board serves as a data coordinator between the host personal computer (PC) and the FPGA to transfer data sampled at 40 MS/s. FPGA-based US imaging systems (US only) have also been implemented [46], [47]. The system in [46] operates at a 1.5-FPS imaging frame rate. Images are reconstructed with static receive beamforming from US data sampled at 50 MS/s. The system in [47] operates at a 30-FPS imaging frame rate. Pseudo-dynamic receive beamforming is used to reconstruct images from US data sampled at 40 MS/s. Compared with the previous work, the system reported in this paper features higher imaging frequency enabled by frontend circuits that operate at higher frequency (20 MHz for transmit and 60 MHz for receive) and higher sampling rate (125 MS/s and × 4 linear interpolation), higher frame rate (170-FPS US and 20-FPS PA) enabled by low-level system implementation. Furthermore, this system offers the capabilities of multimodal operation (software/hardware-based US, interleaved PA and US, velocity measurement) and image reconstruction based on fully dynamic receive beamforming.
Fig. 1.
A compact photoacoustic and ultrasound imaging system.
The overall architecture of the system, the implementation of its core components, and its four working modes are described in detail in Section II. Experiments have been conducted to test the imaging and velocity measurement capability of the system and the results are presented in Section III, followed by Section IV, which suggests system performance improvements, highlights the system’s unique features, and explores other potential system applications.
II. Methods
A. System Overview
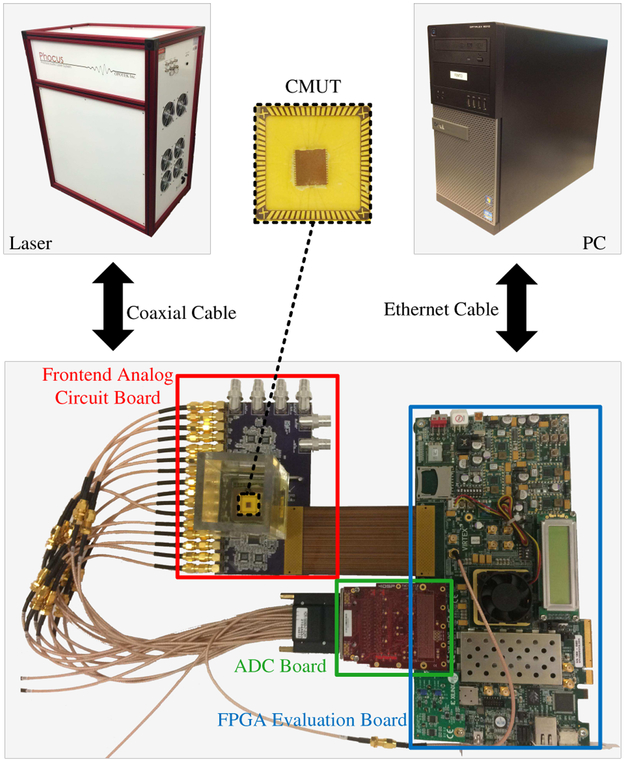
Fig. 2 shows a five-part system overview consisting of: a custom frontend analog circuit board for US transmission and reception, an analog-to-digital converter (ADC) board (FMC116, 4DSP LLC, Austin, TX) to digitize the received acoustic signals, an FPGA evaluation board (VC707, Virtex-7, Xilinx Inc., San Jose, CA) on which the central processor of the system is implemented, a laser system (Phocus Mobile, Opotek Inc., Carlsbad, CA) to provide optical illumination for PA imaging, and a PC (OptiPlex 9010, Dell Inc., Round Rock, TX) for user interface, image post-processing, and display.
Fig. 2.
The system overview.
There are two FPGA mezzanine card (FMC) connectors, FMC1 and FMC2, as well as several SubMiniature version A (SMA) connectors on the FPGA board. The digital input ports of the frontend analog circuit board are connected to FMC2 through an FMC cable to receive digital excitation signals from the FPGA. The analog output ports of the frontend analog circuit board are connected to the input of the ADC board, which digitizes the received acoustic signals and feeds them to the FPGA through FMC1.
The laser works in internal flashlamp and external Q-switch mode to ensure stable synchronization with the FPGA. The flashlamp output trigger signal from the laser is connected to one of the SMA connectors (USER_SMA_CLOCK_P [48]) on the FPGA board and the Q-switch input port of the laser is connected to another SMA connector (USER_SMA_GPIO_N [48]) to receive the external Q-switch signal from the FPGA. The FPGA board is connected to the PC via a 1-Gb/s Ethernet connection. The system parameters are listed in Table I.
TABLE I.
System Parameters
| Frontend Analog Circuit Board | |
| Number of channels | 16 |
| Maximum transmit frequency | 20 MHz |
| Maximum receive frequency | 60 MHz |
| ADC Board | |
| Sampling rate | 125 MS/s |
| Bits per sample | 12 |
| PC | |
| CPU | i7-3770 |
| Clock speed | 3.4 GHz |
| Number of cores | 7 |
| RAM | 16 GB |
| Laser | |
| Pulse width | 5 ns |
| Maximum repetition rate | 20 Hz |
| Average energy per pulse (wavelength 750 nm) | 20 mJ |
B. CMUT Excitation and Data Acquisition
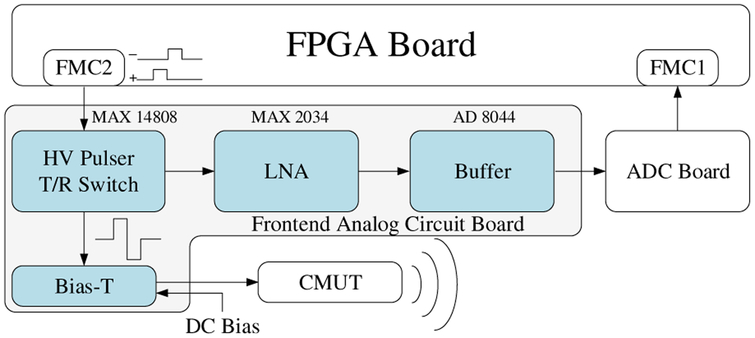
Fig. 3 shows the block diagram of a single channel of the frontend analog circuit board and where it connects to the FPGA board, the ADC board, and the CMUT. The FPGA generates two digital excitation signals per channel and sends them through FMC2 to the high-voltage (HV) pulser (MAX14808, Maxim Integrated Inc., San Jose, CA), where a bipolar HV signal with a peak value up to ±100 V is generated to excite the CMUT array element. The widths of the positive and negative digital excitation signals, which can be programmed from the FPGA with a precision of 2.67 ns, determine the widths of the positive and negative poles of the HV signal. The HV signal is then passed through a bias-T circuit where a DC voltage is added to bias the CMUT, which is wire-bonded to a chip carrier with an oil tank on top, to perform measurements in immersion. In receive, the acoustic signals are converted by the CMUT to electric signals and amplified by a low-noise amplifier (LNA) (MAX2034, Maxim Integrated Inc., San Jose, CA) with a gain of 19 dB before going through a buffer (AD8044, Maxim Integrated Inc., San Jose, CA) and being transmitted to the ADC board via a coaxial cable. The ADC board digitizes the signals with a precision of 12 bits at a 125 MS/s sampling rate and feeds them as double-lane dual data rate (DDR) low-voltage differential signaling (LVDS) outputs to the FPGA through FMC1.
Fig. 3.
The block diagram of the frontend circuit board.
C. System Implementation on the FPGA Board
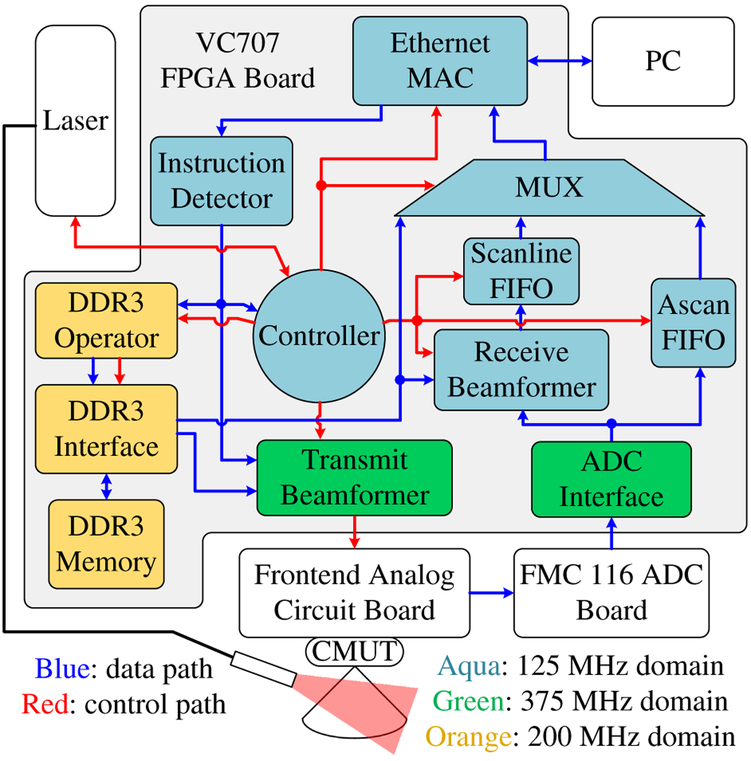
The FPGA system design was developed in Xilinx Integrated Synthesis Environment (ISE) and implemented in Verilog hardware description language (Fig. 4).
Fig. 4.
The block diagram of the system.
1). Clock Domains of the System:
Three clock domains are involved in the system: the 125-MHz main clock domain, the 375-MHz frontend clock domain, and the 200-MHz DDR3 memory clock domain. The 125-MHz main clock speed was chosen to match the sampling rate of the ADC as well as the working speed of the Ethernet medium access controller (MAC), which was generated by the Xilinx Core Generator. Since the outputs of the ADC are double-lane 12-bit DDR LVDS signals, a clock speed of 125×12 (number of bits) ÷2 (double lane) ÷2 (dual data rate) = 375 MHz [49] has to be used in the ADC interface to decode the ADC’s outputs. The same clock speed is used in the transmit beamformer to increase the precision at which the US transmit delay pattern and the excitation waveforms can be programmed. The DDR3 memory interface was also generated by the Xilinx Core Generator and its default working speed is 200 MHz. We used this default working speed for the DDR3 memory interface because its behavior was the most predictable and efficient at this speed, although some inter-clock-domain logic and first-in-first-out (FIFO) buffers are needed to synchronize with the other two clock domains. Compared to the 125-MHz main clock speed, this 200-MHz working speed also results in quicker DDR3 read and write operations.
2). Ethernet-Based FPGA-PC Communication:
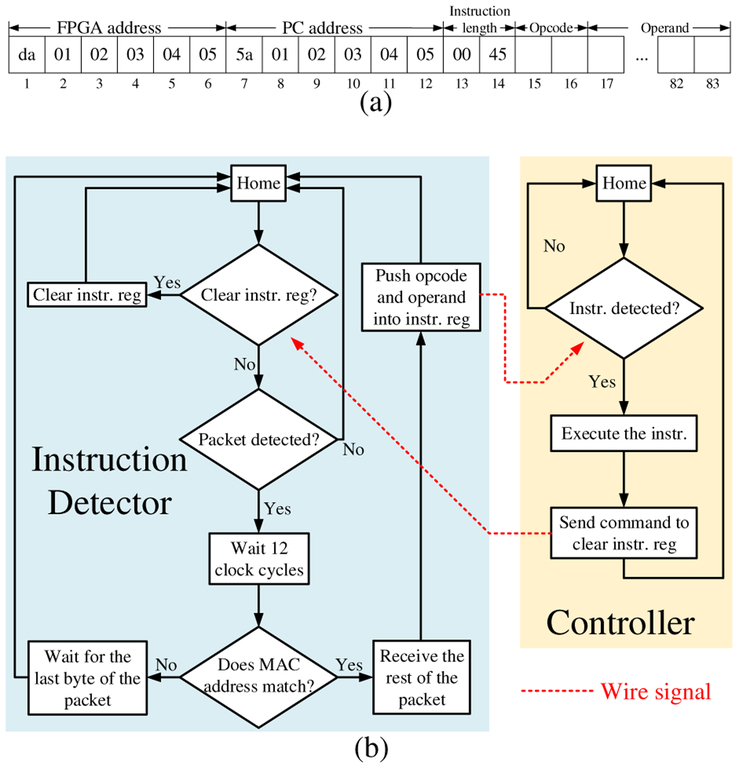
In this system, we used a PC for user interface and image display. The PC and the FPGA communicate with each other through a 1-Gb/s Ethernet link. The FPGA receives instructions in the form of Ethernet packets, executes them, and sends the outputs, which are also in the form of Ethernet packets, back to the PC for further processing and visualization. The first fourteen bytes of a valid instruction to the system specify the MAC addresses of the FPGA and the PC as well as the length of the instruction, followed by sixty-nine bytes of data [Fig. 5(a)]. The first two bytes are the opcode, and the rest are the operand. The MAC address information is used by the instruction detector, which is implemented as a finite state machine (FSM), to receive user instructions only and filter out Ethernet packets from other applications on the PC. When a valid instruction is detected, the instruction detector receives it and pushes it into an instruction register.
Fig. 5.
(a) Format of valid instructions (instr.) in hexadecimal format. (b) Flowchart of the instruction detector and system controller.
3). Instruction Set Architecture:
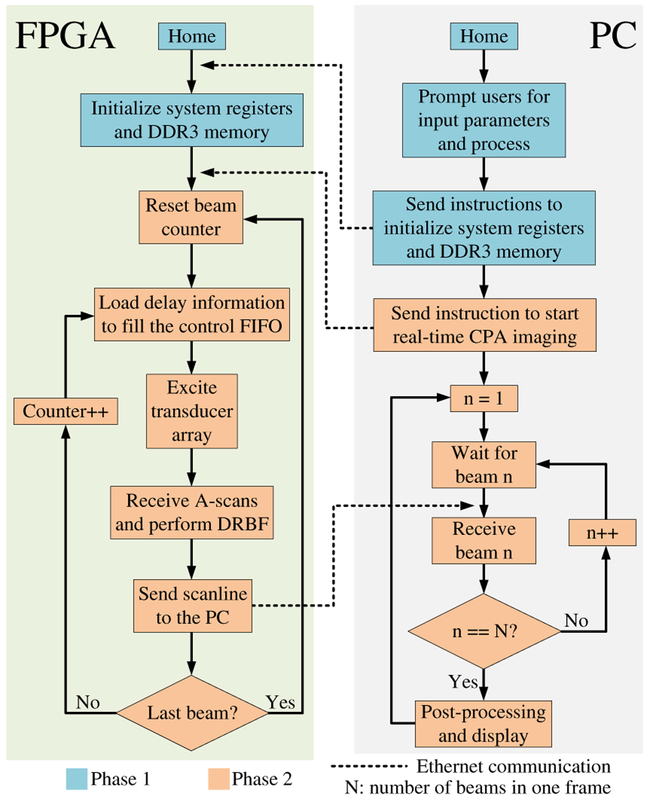
The controller of the system is also implemented as a FSM [Fig. 5(b)]. The controller has several branches, each corresponding to a specific instruction opcode. While in operation, the controller checks the instruction register every clock cycle. Upon receiving a valid instruction, the controller reads the opcode and transitions to the starting state of the appropriate branch. After execution, the controller sends a signal to the instruction detector to clear the instruction register, thereby avoiding double execution. The execution of each instruction includes a series of low-level operations. For example, the execution of the “high-frame-rate US imaging” instruction includes the following operations (phase 2 in Fig. 7): (1) load beamforming delay information for the current beam from DDR3 to the system; (2) excite transducer array; (3) receive echo signals and perform dynamic receive beamforming (DRBF); (4) send beamformed data to the PC; (5) if it is the last beam reset the beam counter, else increase the beam count by one; (6) go back to (1). A new instruction can be added to the system by adding one more branch to the controller FSM.
Fig. 7.
Flowchart of the system in hardware-based high-frame-rate ultrasound imaging mode.
D. Full DRBF on the FPGA
Dynamic receive beamforming is conceptually straightforward in conventional phased array (CPA) imaging. For each pixel along a scanline, the corresponding sample index in each A-scan is calculated. With this index, the contributing sample is selected and summed with matching samples from other channels to obtain the pixel value. Computationally expensive floating-point operations such as the trigonometric and square root functions, multiplication, and division are needed when calculating the indices [50] and calculating these on the fly degrades the system performance. It is preferred to calculate the indices beforehand, store them on the FPGA, and read them directly in operation. However, it is difficult to store the indices for a complete image frame on the FPGA due to its limited memory resource. Solutions such as static receive beamforming [46] and pseudo-dynamic receive beamforming [47] can resolve this issue, but these approaches result in suboptimal image quality.
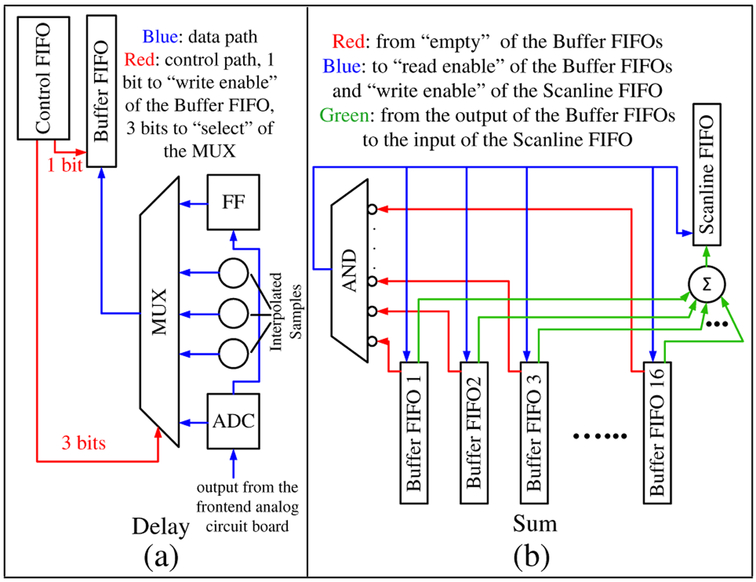
We used the DDR3 memory module on the FPGA board [48] to store the DRBF delay information instead of storing it in the on-chip FPGA memory. With the DRBF delay information, the proposed approach selects contributing A-scan samples and sums matching samples on the fly. Each channel is equipped with a flip-flop (FF) that stores the A-scan sample from the previous clock cycle. Combined with the currently observed A-scan sample, three more samples are linearly interpolated to improve the precision of DRBF. The interpolation is performed by adding consecutive samples and right-shifting (÷2) the result [44]. A control FIFO is used to assist real-time sample selection [Fig. 6(a)]. During DRBF, the 4-bit value at the output port of the control FIFO determines whether a particular sample should be selected from the available A-scan samples (1 bit) in this cycle and which sample to select (3 bits). The selected sample is written into a small buffer FIFO and then summed with matching samples from other channels and written into a scanline FIFO (Fig. 4, Fig. 6). The summation process continues as long as none of the buffer FIFOs are empty [Fig. 6(b)]. In this way, US data acquisition and DRBF are pipelined (video), which saves time and storage space. The values inside the control FIFOs are precalculated on the PC and written into the DDR3 memory before imaging is started. At the beginning of each iteration in DRBF, the values for a particular beam are loaded from the DDR3 memory into the control FIFO before US transmission.
Fig. 6.
(a) Sample selection. (b) Sample summation.
E. Multimodal System Operation
The system has multiple working modes. For each mode, a custom C program runs on the PC to collaborate with the FPGA. More working modes can be added to the system by expanding the system’s instruction set or customizing the software.
1). Hardware-Based High-Frame-Rate Ultrasound Imaging Mode:
The system operation can be divided into two phases (Fig. 7). In the first phase, users are prompted to input imaging parameters such as the start and end imaging depth, transmit focal depth, frame rate, and excitation waveform. The software processes these parameters; calculates other important parameters such as the number of scanlines, transmit delay patterns, and sample selection information for DRBF; attaches these parameters to instructions as operands; and sends them to the FPGA. The sample selection information is written into the DDR3 memory module, and the other parameters are stored in preassigned registers in the FPGA.
In the second phase, the FPGA actively performs CPA imaging at the user-specified frame rate and sends beamformed data to the PC for post-processing that includes bandpass filtering, Hilbert transform, envelope detection, and scan conversion, as well as image display. If the user-specified frame rate is too high and exceeds the system capability, the system will throw an error.
2). Software-Driven Ultrasound Imaging Mode:
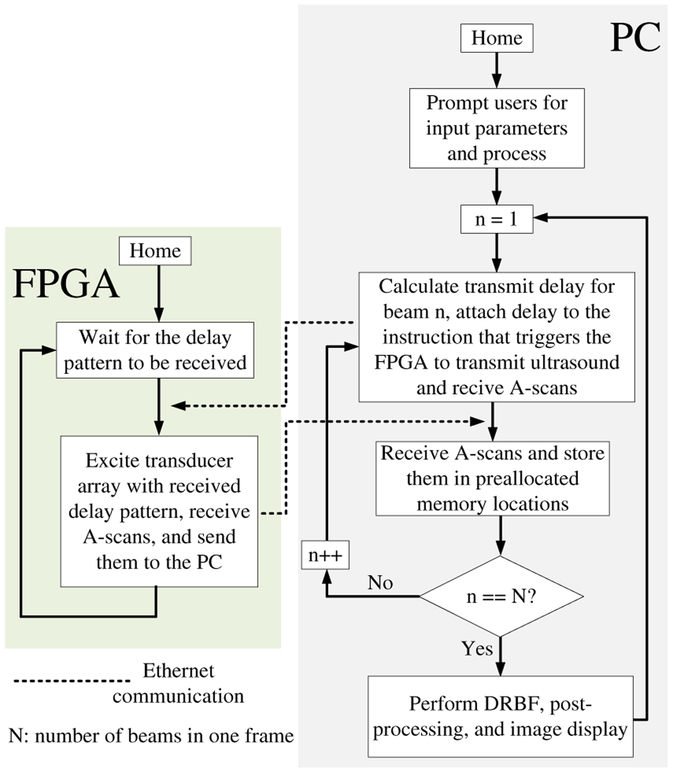
In this mode, the system is driven by the software, and the FPGA is used as a data acquisition system (Fig. 8). After processing the user-input parameters, the software enters a loop. In each iteration, the FPGA passively waits for the software to calculate and send a transmit delay pattern. Once the delay pattern is received, the FPGA excites the CMUT array with this pattern, pushes the acquired data into the A-scan FIFO (Fig. 4), sends it to the PC after data acquisition is completed, and starts waiting for the next transmit delay pattern to arrive. The PC acknowledges the received data and sends the transmit delay pattern for the next iteration to the FPGA. After a complete frame has been received, the software performs DRBF, post-processing, and image display.
Fig. 8.
Flowchart of the system in software-driven ultrasound imaging mode.
3). Interleaved Photoacoustic and Ultrasound Imaging Mode:
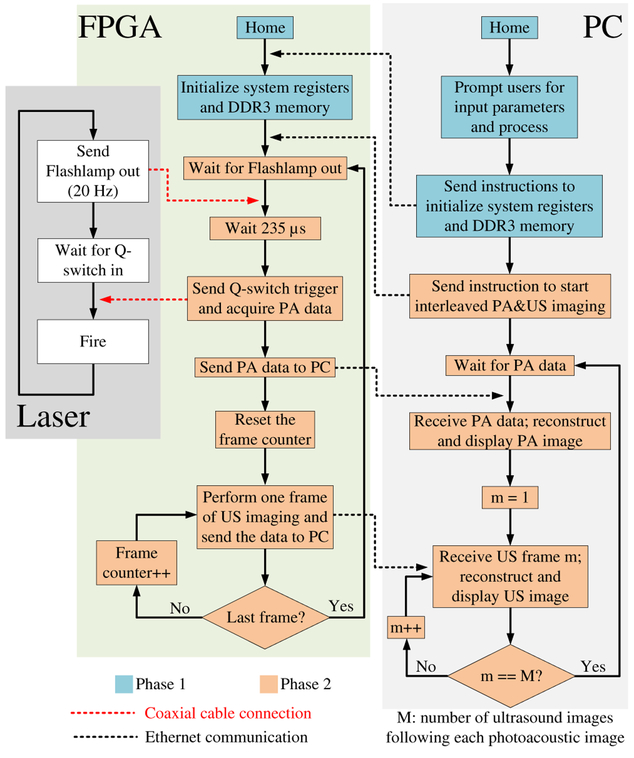
In a fashion similar to the first phase in the hardware-based high-frame-rate US imaging mode, users are prompted to input parameters to initialize the system registers and the DDR3 memory module (Fig. 9). In the second phase, the system is driven by the laser. In each iteration, the FPGA passively waits for the flashlamp output trigger signal from the laser. Once the signal is received, the FPGA waits 235 μs (flashlamp to Q-switch delay value unique to the laser system), sends a Q-switch trigger signal to the laser so that it fires, starts acquiring PA data, and sends the acquired data to the PC for PA image reconstruction and post-processing. Next, the FPGA performs a user-specified number of US frames and sends the beamformed data to the PC for post-processing and display. After that, the FPGA enters the next iteration and waits for the next flashlamp output trigger signal.
Fig. 9.
Flowchart of the system in interleaved photoacoustic and ultrasound imaging mode.
4). Velocity Measurement Mode:
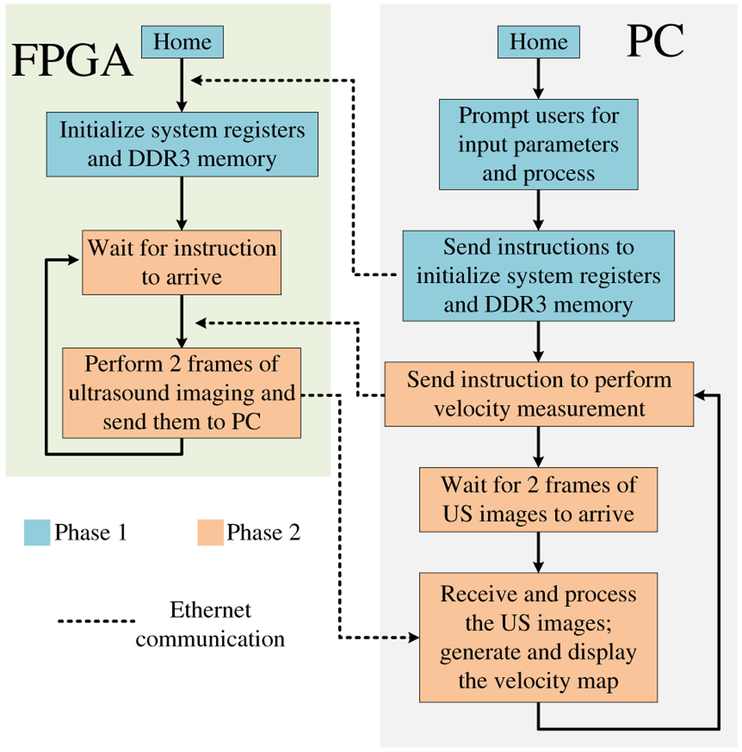
In this mode, the software drives the system. In each iteration, the software sends an instruction to the FPGA so that it performs two consecutive US frames at a user-specified frame rate (Fig. 10). Once the two frames are received by the PC, the software performs post-processing to prepare the image for display. After the scanlines in the two frames are bandpass-filtered, the software also calculates the shift (how much the scatterer has moved) at each pixel from the first frame to the second in a user-specified area with the correlation-based method [51]–[53]. For each pixel of interest, the scanline data that centers this pixel is windowed and shifted over the same scanline in the second frame to locate another window that has the maximum correlation with the first one. By comparing the distance between the two window centers, the shift at this pixel can be calculated. The velocity at this pixel can be derived by multiplying the shift with the user-specified frame rate. The software displays the first US image overlapped with the velocity map in the user-specified area and enters the next iteration.
Fig. 10.
Flowchart of the system in velocity measurement mode.
III. Experiments and Results
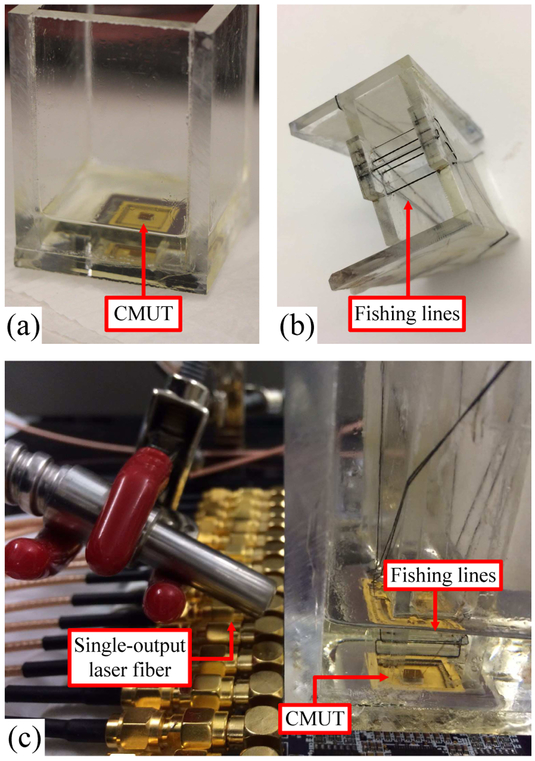
A 16-element 1D CMUT array wire-bonded to a chip carrier with an oil tank on top is used with the system to demonstrate its real-time imaging and velocity measurement capability [Fig. 11(a)]. The experimental conditions are summarized in Table II. The minimum number of beams required is: Q = 4D sin θ/λ [54], where D is the array size, θ is half the viewing angle, and λ is the wavelength. With the array size, viewing angle, speed of sound, and center frequency listed in Table II, the minimum number of beams is 21, and we empirically set the number of beams to be 25.
Fig. 11.
(a) Wire-bonded CMUT in the oil tank. (b) Imaging phantom. (c) Experimental setup for imaging.
TABLE II.
Experimental Conditions
| Speed of sound | 1540 m/s |
| Sampling frequency | 125 MHz |
| Center frequency | 4.5 MHz |
| CMUT bias voltage | 25 V |
| Number of array elements | 16 |
| Size of the CMUT array (azimuth) | 2.48 mm |
| Excitation pulse amplitude | ±15 V |
| Excitation pulse length | 222 ns (1 cycle) |
| Passband of the bandpass filter | 1.8 - 7.2 MHz |
| Imaging depth | 2.48 mm (F#l) - 17.34 mm (F#7) |
| Distance between adjacent pixels | 42.78 μm (1/8 wavelength) |
| Number of samples per A-scan | 3217 |
| Viewing angle | ±45° |
| Number of beams | 25 |
| Number of pixels reconstructed | 347 (axial) × 25 (lateral) = 8675 |
| Immersion medium | Vegetable oil |
| Frame rate in velocity measurement | 200 FPS |
A. Imaging Experiment
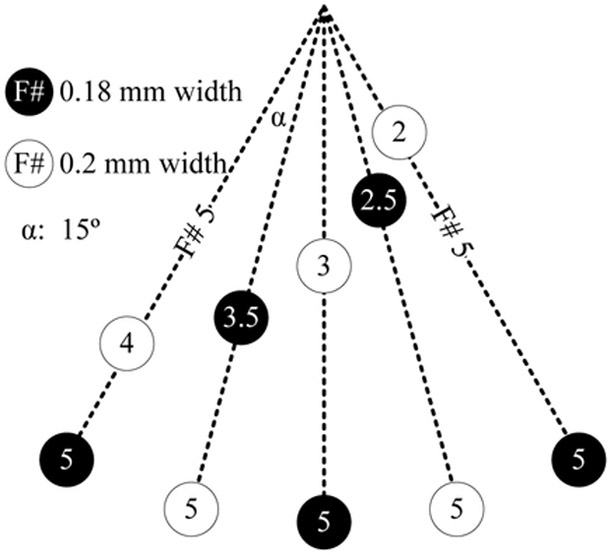
An imaging phantom was made using five 180-μm black fishing lines and five 200-μm clear fishing lines to test the different imaging modes of the system [Fig. 11(b) and Fig. 12]. Each experiment was conducted with both a still and moving phantom. A single-output laser fiber bundle is placed beside the oil tank to deliver laser illumination for PA imaging [Fig. 11(c)].
Fig. 12.
Locations of the fishing wires in the imaging phantom.
1). Hardware-Based High-Frame-Rate Ultrasound Imaging:
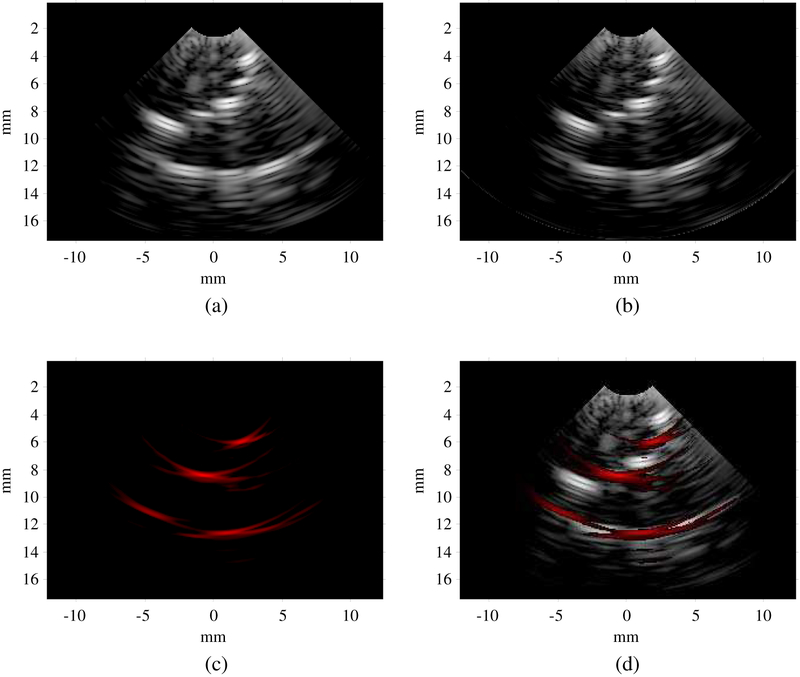
The image reconstructed in this mode clearly shows the ten fishing lines in the phantom [Fig. 13(a)]. The fishing lines located at ±30° at F#5 are far off-axis and therefore appear dimmer. With a 342-μm wavelength and a one-cycle bipolar excitation pulse, the theoretical axial resolution is 171 μm [55], [56]. Both the upper and lower surfaces of the clear fishing line are clearly imaged because its diameter of 200 μm is significantly larger than the axial resolution. The system’s frame rate in this mode can reach 170 FPS for the specified imaging parameters. A video showing the phantom being manually moved can be found here (video).
Fig. 13.
(a) Ultrasound image in hardware-based high-frame-rate ultrasound imaging mode. (b) Ultrasound image in software-driven ultrasound imaging mode. (c) Photoacoustic image in interleaved photoacoustic and ultrasound imaging mode. (d) Overlapped photoacoustic and ultrasound image in interleaved photoacoustic and ultrasound imaging mode. Dynamic range: photoacoustic 25 dB, ultrasound 40 dB.
2). Software-Driven Ultrasound Imaging:
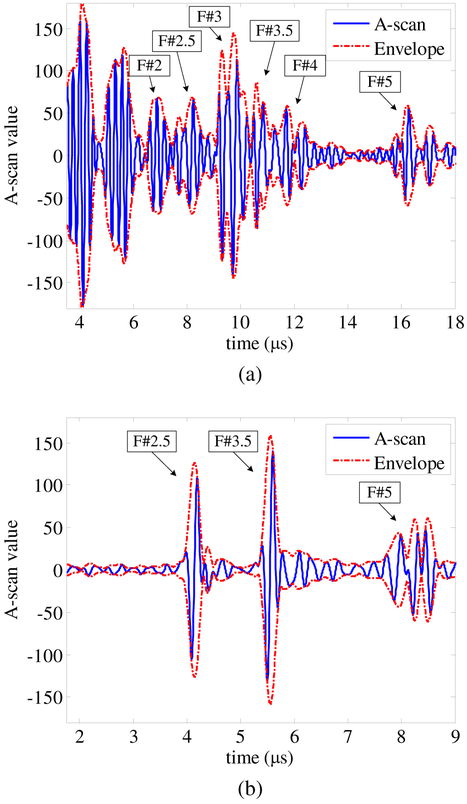
The image acquired in this mode looks similar to that acquired in the hardware-based high-frame-rate US imaging mode, but it has a cleaner background [Fig. 13(b)]. The improved image quality is due to the different order of bandpass filtering and receive beamforming in this mode. In the hardware-based high-frame-rate US imaging mode, bandpass filtering is performed on the PC after receive beamforming is completed on the FPGA. The equivalent sampling rate of the beamformed data is 4.5×4=18 MS/s because there are eight pixels within a single wavelength (Table II), while in the software-driven US imaging mode, bandpass filtering is performed before receive beamforming on raw A-scan data sampled at 125 MS/s, which is significantly higher than 18 MS/s. Since the FPGA is used as a data acquisition device and DRBF is performed in the PC, users have access to raw US A-scan data. Fig. 14(a) shows the A-scan data of beam 13 (center beam) acquired from element 8 (a center element); the reflections from the different fishing lines can be clearly identified. The frame rate in this mode can reach 7.6 FPS. This is significantly lower than that in the hardware-based high-frame-rate US imaging mode because there is more overhead in the data transfer. This mode requires the full A-scan data for one frame, which is 2.57 MB, while the equivalent amount in the hardware-based high-frame-rate US imaging mode is 17.35 KB. The DRBF algorithm is implemented in the software which is often less efficient than a dedicated hardware implementation.
Fig. 14.
(a) Ultrasound A-scan of beam 13 from element 8 acquired in software-driven ultrasound imaging mode. (b) Photoacoustic A-scan from element 8 acquired in interleaved photoacoustic and ultrasound imaging mode.
3). Interleaved Photoacoustic and Ultrasound Imaging:
In the PA image, only black fishing lines are visible because they are much stronger optical absorbers than clear fishing lines [Fig. 13(c) and (d)]. The frame rate of PA imaging is equal to the repetition rate of the laser (20 Hz). Each PA frame is followed by three US frames, the average US frame rate is 60 FPS. A video of the phantom being manually moved can be found here (video). If more than three frames of US imaging are performed following each PA frame, the system will miss the flashlamp output trigger signal. The time needed to process one PA image and four US images might exceed the laser repetition period. This means that the finite state machine might not be back to the “Wait for Flashlamp out” state (Fig. 9) when a new flashlamp output trigger signal is received.
Since PA image reconstruction is performed in the PC, users have access to raw PA A-scan data. Fig. 14(b) shows the PA A-scan data from element 8. The black fishing lines at three different depths can be clearly identified and co-registered with the US A-scan.
B. Velocity Measurement
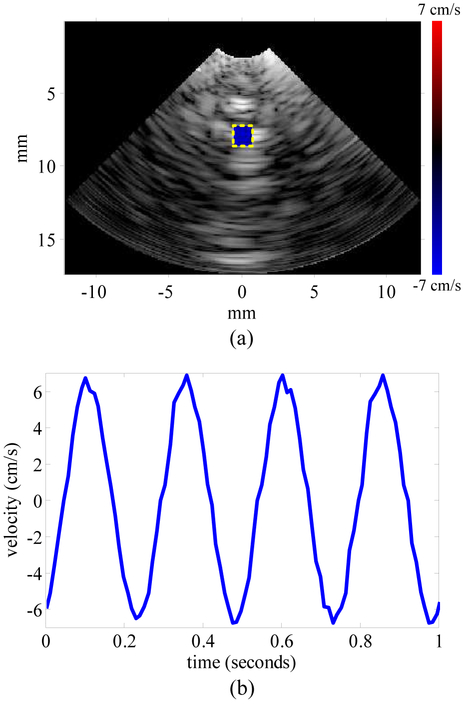
In order to test the velocity measurement capability, another phantom was made using several 200-μm fishing lines aligned in a row and spaced 2 mm apart. The phantom was attached to a linear stage (PRO165, Aerotech Inc., Pittsburgh, PA) which is programmed to oscillate with a frequency of 4 Hz and an amplitude of 0.21 cm. The system acquired 6 seconds of beamformed data, and the velocity distribution within a user-specified area was calculated with the correlation-based algorithm [51]–[53]. The window for correlation is empirically set to contain 65 pixels. [Fig. 15(a)] shows the US image and the velocity distribution at the end of the first second, and [Fig. 15(b)] shows the first second of the velocity curve. A video showing dynamic co-registration of the US image, the velocity distribution, and the velocity curve progress can be found here (video). The velocity curve frequency matches the oscillation frequency. With the 0.21-cm amplitude the 4-Hz frequency, the amplitude of the velocity curve should be 5.28 cm/s. The error could be due to a nonideal oscillation of the linear stage.
Fig. 15.
(a) Velocity distribution in the user-specified area overlapped with ultrasound image in velocity measurement mode at 1 second. (b) Velocity over time from 0 to 1 second.
IV. Discussion
A. Frame Rate
For the presented imaging parameters, the hardware-based high-frame-rate US imaging mode frame rate is 170 FPS. The high frame rate is a result of the register-transfer level (RTL) system implementation where developers have flexibility in manipulating the hardware resource to acquire and process data with little overhead.
The frame rate of the system in software-driven US imaging mode is limited by the data transfer rate between the FPGA and the PC as well as the processing speed of the PC. With a 1-Gb/s Ethernet connection and 2.57 MB of data in each US frame, the frame rate cannot exceed 49 FPS even with no computational bottlenecks. To increase the frame rate, a faster data link (e.g. PCIe) must be established in addition to higher computer processing speed.
For interleaved PA and US imaging mode, the limiting factor of frame rate is the repetition rate of the laser. Although the current repetition rate (20 Hz) of the laser is not very high (like 2 kHz in [15], [21]), the forward-looking array-based imaging scheme requires only one laser firing per frame, while the side-looking single-transducer-based imaging scheme requires more than 100 (125 in [15] and 200 in [21]). As the repetition rate goes up, the array-based IVPA imaging frame rate will increase accordingly as long as the raw data can be acquired and processed by the backend system in real time.
In order to keep the custom software concise and easy to maintain, it does not involve any parallel processing or multithreaded programming. The overall performance of the system can also be boosted by transporting the software to a multithreaded or graphics processing unit (GPU) version [36].
B. Programmability
Due to the low-level system implementation, the programmability of the system is flexible and visible to users. The system architecture provides a rich instruction set that can be conveniently expanded by adding more branches to the FSM of the central controller. These instructions can be customized to adapt the system to specific applications. For example, in the software-driven US imaging mode, the software continuously sends the instruction “excite the CMUT with delay pattern W and return the A-scans from all elements” to the FPGA. The software adjusts the pattern “W” in each iteration to cover a complete sector for CPA imaging. Users can conveniently turn this imaging mode into flash-angle imaging [57] by modifying (1) how the pattern “W” is calculated and (2) the image reconstruction method in the software. Another useful instruction of the system is “perform X frames of US imaging at frame rate Y and return the beamformed data”, where both “X” and “Y” can be configurable from the software. In the velocity measurement mode, “X” is set to 2 and “Y” is set to 200 FPS so that two consecutive frames of US images are acquired with a fixed interval. This allows a correlation-based algorithm to calculate the velocity for each pixel of interest. The system can also be programmed to do synthetic phased array imaging [58] by sending the instruction “excite element Z and return the A-scans from all elements” with “Z” looped from 1 to 16 in each iteration and the beamforming algorithm implemented in the software. With these system instructions, users can quickly implement their own imaging algorithms and system procedures.
C. Applications
The envisioned application for the system is IVPA and IVUS imaging. The system can also be used in endoscopic imaging where a low channel count is typically sufficient and high imaging resolution is required. The high sampling rate (125 MS/s and × 4 linear interpolation) and high frontend electronics operating frequency (20 MHz for transmit and 60 MHz for receive) enables the system to perform high-frequency imaging. The transmit frequency is currently limited by the HV pulsers used in the frontend analog circuit board. The frequency of the digital excitation signal from the FPGA can be as high as 375÷2=187.5 MHz. Other than high-frequency imaging, the compactness of the system will help integrate the dual-mode IVPA/IVUS imaging in a catheterization laboratory without the complications of a cart-based system. Applications that require larger apertures with greater channel counts can be accommodated by adding multiplexing capability in the frontend electronics. Alternatively, the presented system can be scaled up to increase the number of channels it can handle. Due to the high programmability of the system, it also provides a suitable platform for researchers to quickly prototype and test their imaging algorithms and system implementation.
D. Remaining Tasks for Clinical Translation
This implementation shows the complete functionality of the system. The analog frontend is implemented on a customized board. To transfer the system to clinical use, a catheter will be designed to miniaturize the analog frontend and attach it to the tip. With the custom analog frontend integrated circuits, we will also increase the transmit frequency. System packaging as well as development of a user-friendly graphical user interface will also be part of a future system.
V. Conclusion
We developed a low-cost, compact, high-speed, and programmable FPGA-based multimodal imaging system that can perform PA and US imaging and velocity measurements. The system features high-frequency imaging, which is enabled by the frontend electronics and the ADC’s high sampling rate. The low-level system implementation enables a high frame rate, and the system also provides flexible programmability that enables users to adapt the system to specific tasks by customizing the software.
Supplementary Material
Acknowledgments
This work was supported by the National Institutes of Health under Grant 1R01HL117740.
Biography
Xun Wu (S’14) received his B.S. degree from Southeast University, Nanjing, China, in 2012, and his M.S. degree from North Carolina State University, Raleigh, NC, in 2016, both in electrical engineering. He is currently working toward his Ph.D. degree in electrical engineering at North Carolina State University, Raleigh, NC.
His research interests include portable and programmable medical imaging system design as well as ultrasound and photoacoustic image processing to monitor high-intensity focused ultrasound therapy.

Jean L. Sanders (S’14) received her B.S. from North Carolina State University, Raleigh, NC in 2014 and her M.S. from the same university in 2015 both in electrical engineering. She is currently working toward her Ph.D. in electrical engineering at the same university.
Her current research focuses on designing and implementing customized board-level electronic systems for both glass-wafer capacitive micromachined ultrasonic transducer (CMUT) row-column arrays as well as 1D optically transparent CMUT arrays for applications such as hand-held probes for multi-modality imaging.

Xiao Zhang (S’13-M’18) received the B.S. degree from Xi’an Jiaotong University, Xi’an, China, in 2012, and the M.S. degree and the Ph.D. degree from North Carolina State University, Raleigh, NC, USA, in 2015 and 2017, respectively, all in electrical engineering.
His research focuses on design and fabrication of 1-D and 2-D capacitive micromachined ultrasonic transducer (CMUT) arrays and associated MEMS transmit/receive switches on glass substrates, as well as their integration with frontend electronics for medical imaging and therapy applications. He is also involved in developing transparent CMUTs for medical and air-coupled applications.
He has authored or co-authored over 20 scientific publications. He received the Student Travel Awards from the 2015, 2016, and 2017 IEEE International Ultrasonics Symposia; the UGSA Conference Award at NCSU in 2015; and first place in the 2017 NCSU ECE Research Symposium. He was a Student Paper Competition Finalist at the 2016 and 2017 IEEE International Ultrasonics Symposia.
Feysel. Yalçın Yamaner (S’99-M’11) received his B.S. degree from Ege University, Izmir, Turkey, in 2004. and the M.S. and Ph.D. degrees from Sabanci University, Istanbul, Turkey, in 2006 and 2011, respectively, all in electrical and electronics engineering. He received Dr. Gursel Sonmez Research Award in recognition of his outstanding research during his Ph.D. study.
He was a Visiting Researcher with the VLSI Design and Education Center (VDEC), in 2006. He was a visiting scholar in the Micromachined Sensors and Transducers Laboratory, Georgia Institute of Technology, Atlanta, GA, USA, in 2008. He was a Research Associate with the Laboratory of Therapeutic Applications of Ultrasound, French National Institute of Health and Medical Research, from 2011 to 2012. He was with the Department of Electrical and Computer Engineering, North Carolina State University, Raleigh, NC, USA, as a Research Associate from 2012 to 2014. In 2014, he joined the School of Electrical and Electronics Engineering, Istanbul Medipol University as an Assistant Professor. Currently, he is a Visiting Assistant Professor in the Department of Electrical and Computer Engineering at NC State University. His research focuses on developing micromachined devices for biological and chemical sensing, ultrasound imaging, and therapy.

Ömer Oralkan (S’93-M’05-SM’10) received the B.S. degree from Bilkent University, Ankara, Turkey, in 1995, the M.S. degree from Clemson University, Clemson, SC, in 1997, and the Ph.D. degree from Stanford University, Stanford, CA, in 2004, all in electrical engineering.
He was a Research Associate (2004-2007) and then a Senior Research Associate (2007-2011) in the E. L. Ginzton Laboratory at Stanford University. In 2012, he joined North Carolina State University, Raleigh where he is now a Professor of Electrical and Computer Engineering. His current research focuses on developing devices and systems for ultrasound imaging, photoacoustic imaging, image-guided therapy, biological and chemical sensing, and ultrasound neural stimulation.
Dr. Oralkan is an Associate Editor for the IEEE Transactions on Ultrasonics, Ferroelectrics and Frequency Control and serves on the Technical Program Committee of the IEEE International Ultrasonics Symposium. He received the 2016 William F. Lane Outstanding Teacher Award at NC State, 2013 DARPA Young Faculty Award, and 2002 Outstanding Paper Award of the IEEE Ultrasonics, Ferroelectrics, and Frequency Control Society. Dr. Oralkan has authored more than 160 scientific publications.
References
- [1].Nissen SE and Yock P, “Intravascular ultrasound: novel pathophysiological insights and current clinical applications,” Circulation, vol. 103, no. 4, pp. 604–616, 2001. [DOI] [PubMed] [Google Scholar]
- [2].Garcia-Garcia HM, Costa MA, and Serruys PW, “Imaging of coronary atherosclerosis: intravascular ultrasound,” European Heart Journal, vol. 31, no. 20, pp. 2456–2469, 2010. [DOI] [PubMed] [Google Scholar]
- [3].Tobis JM, Mallery J, Mahon D, Lehmann K, Zalesky P, Griffith J, Gessert J, Moriuchi M, McRae M, and Dwyer M-L, “Intravascular ultrasound imaging of human coronary arteries in vivo. analysis of tissue characterizations with comparison to in vitro histological specimens.” Circulation, vol. 83, no. 3, pp. 913–926, 1991. [DOI] [PubMed] [Google Scholar]
- [4].Alfonso F, Macaya C, Goicolea J, Hernandez R, Zamorano J, Perez-Vizcayne MJ, Zarco P et al. , “Intravascular ultrasound imaging of angiographically normal coronary segments in patients with coronary artery disease,” American Heart Journal, vol. 127, no. 3, pp. 536–544, 1994. [DOI] [PubMed] [Google Scholar]
- [5].Schumacher M, Yin L, Swaid S, Oldenburger J, Gilsbach J, and Hetzel A, “Intravascular ultrasound Doppler measurement of blood flow velocity,” Journal of Neuroimaging, vol. 11, no. 3, pp. 248–252, 2001. [DOI] [PubMed] [Google Scholar]
- [6].Li W, van der Steen AF, Lancée CT, Céspedes I, and Bom N, “Blood flow imaging and volume flow quantitation with intravascular ultrasound,” Ultrasound in Medicine and Biology, vol. 24, no. 2, pp. 203–214, 1998. [DOI] [PubMed] [Google Scholar]
- [7].Li W, Lancee C, Van der Steen A, Gussenhoven E, and Bom N, “Blood velocity estimation with high frequency intravascular ultrasound,” in Proc. IEEE Ultrason. Symp, vol. 2 IEEE, 1996, pp. 1485–1488. [Google Scholar]
- [8].Siegel RJ, Ariani M, Fishbein MC, Chae J-S, Park JC, Maurer G, and Forrester JS, “Histopathologic validation of angioscopy and intravascular ultrasound.” Circulation, vol. 84, no. 1, pp. 109–117, 1991. [DOI] [PubMed] [Google Scholar]
- [9].Franzen D, Sechtem U, and Höpp HW, “Comparison of angioscopic, intravascular ultrasonic, and angiographic detection of thrombus in coronary stenosis,” The American Journal of Cardiology, vol. 82, no. 10, pp. 1273–1275, 1998. [DOI] [PubMed] [Google Scholar]
- [10].Wang B, Karpiouk A, Yeager D, Amirian J, Litovsky S, Smalling R, and Emelianov S, “Intravascular photoacoustic imaging of lipid in atherosclerotic plaques in the presence of luminal blood,” Optics Letters, vol. 37, no. 7, pp. 1244–1246, 2012. [DOI] [PubMed] [Google Scholar]
- [11].Xu M and Wang LV, “Photoacoustic imaging in biomedicine,” Review of Scientific Instruments, vol. 77, no. 4, p. 041101, 2006. [Google Scholar]
- [12].Wang LV and Wu H.-i., Biomedical optics: principles and imaging. John Wiley & Sons, 2012. [Google Scholar]
- [13].Li C and Wang LV, “Photoacoustic tomography and sensing in biomedicine,” Physics in Medicine & Biology, vol. 54, no. 19, pp. R59–R97, 2009. [DOI] [PMC free article] [PubMed] [Google Scholar]
- [14].Wang LV and Hu S, “Photoacoustic tomography: in vivo imaging from organelles to organs,” Science, vol. 335, no. 6075, pp. 1458–1462, 2012. [DOI] [PMC free article] [PubMed] [Google Scholar]
- [15].Hui J, Cao Y, Zhang Y, Kole A, Wang P, Yu G, Eakins G, Sturek M, Chen W, and Cheng J-X, “Real-time intravascular photoacoustic-ultrasound imaging of lipid-laden plaque in human coronary artery at 16 frames per second,” Scientific Reports, vol. 7, no. 1, p. 1417, 2017. [DOI] [PMC free article] [PubMed] [Google Scholar]
- [16].Wang B, Su JL, Karpiouk AB, Sokolov KV, Smalling RW, and Emelianov SY, “Intravascular photoacoustic imaging,” IEEE Journal of Selected Topics in Quantum Electronics, vol. 16, no. 3, pp. 588–599, 2010. [DOI] [PMC free article] [PubMed] [Google Scholar]
- [17].Sethuraman S, Aglyamov S, Amirian J, Smalling R, and Emelianov S, “Development of a combined intravascular ultrasound and photoacoustic imaging system,” in Photons Plus Ultrasound: Imaging and Sensing 2006: The Seventh Conference on Biomedical Thermoacoustics, Optoa-coustics, and Acousto-optics, vol. 6086 International Society for Optics and Photonics, 2006, p. 60860F. [Google Scholar]
- [18].Sethuraman S, Aglyamov SR, Amirian JH, Smalling RW, and Emelianov SY, “Intravascular photoacoustic imaging using an IVUS imaging catheter,” IEEE Transactions on Ultrasonics, Ferroelectrics, and Frequency Control, vol. 54, no. 5, 2007. [DOI] [PubMed] [Google Scholar]
- [19].Li X, Wei W, Zhou Q, Shung KK, and Chen Z, “Intravascular photoacoustic imaging at 35 and 80 MHz,” Journal of Biomedical Optics, vol. 17, no. 10, p. 106005, 2012. [DOI] [PMC free article] [PubMed] [Google Scholar]
- [20].Li Y, Gong X, Liu C, Lin R, Hau W, Bai X, and Song L, “High-speed intravascular spectroscopic photoacoustic imaging at 1000 A-lines per second with a 0.9-mm diameter catheter,” Journal of Biomedical Optics, vol. 20, no. 6, p. 065006, 2015. [DOI] [PubMed] [Google Scholar]
- [21].Wang P, Ma T, Slipchenko MN, Liang S, Hui J, Shung KK, Roy S, Sturek M, Zhou Q, Chen Z et al. , “High-speed intravascular photoacoustic imaging of lipid-laden atherosclerotic plaque enabled by a 2-kHz barium nitrite Raman laser,” Scientific Reports, vol. 4, p. 6889, 2014. [DOI] [PMC free article] [PubMed] [Google Scholar]
- [22].Oralkan O, Hansen ST, Bayram B, Yaralioglu G, Ergun AS, and Khuri-Yakub BT, “CMUT ring arrays for forward-looking intravascular imaging,” in Proc. IEEE Ultrason. Symp, vol. 1 IEEE, 2004, pp. 403–406. [Google Scholar]
- [23].Knight JG and Degertekin FL, “Fabrication and characterization of CMUTs for forward looking intravascular ultrasound imaging,” in Proc. IEEE Ultrason. Symp, vol. 1 IEEE, 2003, pp. 577–580. [Google Scholar]
- [24].Rogers JH, “Forward-looking IVUS in chronic total occlusions,” Cardiac Interventions Today, vol. 21, pp. 21–24, 2009. [Google Scholar]
- [25].Park DW, Kruger GH, Rubin JM, Hamilton J, Gottschalk P, Dodde RE, Shih AJ, and Weitzel WF, “Quantification of ultrasound correlation-based flow velocity mapping and edge velocity gradient measurement,” Journal of Ultrasound in Medicine, vol. 32, no. 10, pp. 1815–1830, 2013. [DOI] [PubMed] [Google Scholar]
- [26].Knight J, McLean J, and Degertekin FL, “Low temperature fabrication of immersion capacitive micromachined ultrasonic transducers on silicon and dielectric substrates,” IEEE Transactions on Ultrasonics, Ferroelectrics, and Frequency Control, vol. 51, no. 10, pp. 1324–1333, 2004. [PubMed] [Google Scholar]
- [27].Guldiken RO, Zahorian J, Balantekin M, Karaman M, and Degertekin FL, “Multiple annular ring capacitive micromachined ultrasonic transducer arrays for forward-looking intravascular ultrasound imaging catheters,” in ASME 2007 International Mechanical Engineering Congress and Exposition. American Society of Mechanical Engineers, 2007, pp. 179–180. [Google Scholar]
- [28].Light ED, Lieu V, and Smith SW, “New fabrication techniques for ring-array transducers for real-time 3D intravascular ultrasound,” Ultrasonic Imaging, vol. 31, no. 4, pp. 247–256, 2009. [DOI] [PMC free article] [PubMed] [Google Scholar]
- [29].Yeh DT, Oralkan O, Wygant IO, O’Donnell M, and Khuri-Yakub BT, “3-D ultrasound imaging using a forward-looking CMUT ring array for intravascular/intracardiac applications,” IEEE Transactions on Ultrasonics, Ferroelectrics, and Frequency Control, vol. 53, no. 6, pp. 1202–1211, 2006. [DOI] [PubMed] [Google Scholar]
- [30].Vaithilingam S, Ma T-J, Furukawa Y, Wygant IO, Zhuang X, De La Zerda A, Oralkan Ö, Kamaya A, Jeffrey RB, Khuri-Yakub BT et al. , “Three-dimensional photoacoustic imaging using a two-dimensional CMUT array,” IEEE Transactions on Ultrasonics, Ferro-electrics, and Frequency Control, vol. 56, no. 11, pp. 2411–2419, 2009. [DOI] [PubMed] [Google Scholar]
- [31].Wang Y, Stephens DN, and O’Donnell M, “Initial results from a forward-viewing ring-annular ultrasound array for intravascular imaging,” in Proc. IEEE Ultrason. Symp, vol. 1 IEEE, 2003, pp. 212–215. [Google Scholar]
- [32].Cabrera-Munoz NE, Eliahoo P, Wodnicki R, Jung H, Chiu CT, Williams JA, Kim HH, Zhou Q, and Shung KK, “Forward-looking 30-MHz phased-array transducer for peripheral intravascular imaging,” Sensors and Actuators A: Physical, vol. 280, pp. 145–163, 2018. [Google Scholar]
- [33].Gurun G, Tekes C, Zahorian J, Xu T, Satir S, Karaman M, Hasler J, and Degertekin FL, “Single-chip CMUT-on-CMOS front-end system for real-time volumetric IVUS and ICE imaging,” IEEE Transactions on Ultrasonics, Ferroelectrics, and Frequency Control, vol. 61, no. 2, pp. 239–250, 2014. [DOI] [PMC free article] [PubMed] [Google Scholar]
- [34].Tan M, Chen C, Chen Z, Janjic J, Daeichin V, Chang Z.-y., Noothout E, van Soest G, Verweij M, de Jong N et al. , “A front-end ASIC with high-voltage transmit switching and receive digitization for forward-looking intravascular ultrasound,” in Custom Integrated Circuits Conference. IEEE, 2017, pp. 1–4. [Google Scholar]
- [35].Carpenter TM, Rashid MW, Ghovanloo M, Cowell DM, Freear S, and Degertekin FL, “Direct digital demultiplexing of analog TDM signals for cable reduction in ultrasound imaging catheters,” IEEE Transactions on Ultrasonics, Ferroelectrics, and Frequency Control, vol. 63, no. 8, pp. 1078–1085, 2016. [DOI] [PMC free article] [PubMed] [Google Scholar]
- [36].Choe JW, Nikoozadeh A, Oralkan Ö, and Khuri-Yakub BT, “GPU-based real-time volumetric ultrasound image reconstruction for a ring array,” IEEE Transactions on Medical Imaging, vol. 32, no. 7, pp. 1258–1264, 2013. [DOI] [PMC free article] [PubMed] [Google Scholar]
- [37].Nikoozadeh A, Choe JW, Kothapalli S-R, Moini A, Sanjani SS, Kamaya A, Oralkan Ö, Gambhir SS, and Khuri-Yakub PT, “Photoacoustic imaging using a 9F microlinear CMUT ICE catheter,” in Proc. IEEE Ultrason. Symp. IEEE, 2012, pp. 24–27. [Google Scholar]
- [38].Nikoozadeh A, Oralkan Ö, Gencel M, Choe JW, Stephens DN, De La Rama A, Chen P, Thomenius K, Dentinger A, Wildes D et al. , “Forward-looking volumetric intracardiac imaging using a fully integrated CMUT ring array,” in Proc. IEEE Ultrason. Symp. IEEE, 2009, pp. 511–514. [Google Scholar]
- [39].Tekes C, Xu T, Carpenter TM, Bette S, Schnakenberg U, Cowell D, Freear S, Kocaturk O, Lederman RJ, and Degertekin FL, “Real-time imaging system using a 12-MHz forward-looking catheter with single chip CMUT-on-CMOS array,” in Proc. IEEE Ultrason. Symp. IEEE, 2015. [Google Scholar]
- [40].Zhang X, Wu X, Adelegan OJ, Yamaner FY, and Oralkan Ö, “Backward-mode photoacoustic imaging using illumination through a CMUT with improved transparency,” IEEE Transactions on Ultrasonics, Ferroelectrics, and Frequency Control, vol. 65, no. 1, pp. 85–94, 2018. [DOI] [PMC free article] [PubMed] [Google Scholar]
- [41].Zhang X, Yamaner FY, and Oralkan Ö, “Fabrication of vacuum-sealed capacitive micromachined ultrasonic transducers with through-glass-via interconnects using anodic bonding,” Journal of Microelectromechanical Systems, vol. 26, no. 1, pp. 226–234, 2017. [Google Scholar]
- [42].Wu X, Sanders J, Zhang X, Yamaner FY, and Oralkan Ö, “A high-frequency and high-frame-rate ultrasound imaging system design on an FPGA evaluation board for capacitive micromachined ultrasonic transducer arrays,” in Proc. IEEE Ultrason. Symp. IEEE, 2017, pp. 1–4. [Google Scholar]
- [43].Alqasemi US, Li H, Aguirre A, and Zhu Q, “Real-time co-registered ultrasound and photoacoustic imaging system based on FPGA and DSP architecture,” in Photons Plus Ultrasound: Imaging and Sensing 2011, vol. 7899 International Society for Optics and Photonics, 2011, p. 78993S. [Google Scholar]
- [44].Alqasemi U, Li H, Aguirre A, and Zhu Q, “FPGA-based reconfigurable processor for ultrafast interlaced ultrasound and photoacoustic imaging,” IEEE Transactions on Ultrasonics, Ferroelectrics, and Frequency Control, vol. 59, no. 7, pp. 1344–1353, 2012. [DOI] [PMC free article] [PubMed] [Google Scholar]
- [45].Alqasemi US, Li H, Yuan G, Kumavor PD, Zanganeh S, and Zhu Q, “Interlaced photoacoustic and ultrasound imaging system with real-time coregistration for ovarian tissue characterization,” Journal of Biomedical Optics, vol. 19, no. 7, p. 076020, 2014. [DOI] [PMC free article] [PubMed] [Google Scholar]
- [46].Wong LL, Chen AI, Logan AS, and Yeow JT, “An FPGA-based ultrasound imaging system using capacitive micromachined ultrasonic transducers,” IEEE Transactions on Ultrasonics, Ferroelectrics, and Frequency Control, vol. 59, no. 7, 2012. [DOI] [PubMed] [Google Scholar]
- [47].Kim G-D, Yoon C, Kye S-B, Lee Y, Kang J, Yoo Y, and Song T-K, “A single FPGA-based portable ultrasound imaging system for point-of-care applications,” IEEE Transactions on Ultrasonics, Ferroelectrics, and Frequency Control, vol. 59, no. 7, 2012. [DOI] [PubMed] [Google Scholar]
- [48].VC707 Evaluation Board for the Virtex-7 FPGA User Guide, Xilinx Inc., 2016. [Google Scholar]
- [49].LTC2175-14/LTC2174-14/LTC2173-14 - 14-Bit, 125Msps/105Msps/80Msps Low Power Quad ADCs Datasheet, Linear Technology Corporation, 2011. [Google Scholar]
- [50].Sampson R, Yang M, Wei S, Jintamethasawat R, Fowlkes B, Kripfgans O, Chakrabarti C, and Wenisch TF, “FPGA implementation of low-power 3D ultrasound beamformer,” in Proc. IEEE Ultrason. Symp. IEEE, 2015, pp. 1–4. [Google Scholar]
- [51].Hoeks AP, Arts TG, Brands PJ, and Reneman RS, “Comparison of the performance of the RF cross correlation and doppler autocorrelation technique to estimate the mean velocity of simulated ultrasound signals,” Ultrasound in Medicine & Biology, vol. 19, no. 9, pp. 727–740, 1993. [DOI] [PubMed] [Google Scholar]
- [52].Foster SG, Embree PM, and O’Brien WD, “Flow velocity profile via time-domain correlation: error analysis and computer simulation,” IEEE Transactions on Ultrasonics, Ferroelectrics, and Frequency Control, vol. 37, no. 3, pp. 164–175, 1990. [DOI] [PubMed] [Google Scholar]
- [53].Bonnefous O and Pesque P, “Time domain formulation of pulse-doppler ultrasound and blood velocity estimation by cross correlation,” Ultrasonic Imaging, vol. 8, no. 2, pp. 73–85, 1986. [DOI] [PubMed] [Google Scholar]
- [54].Oralkan Ö, “Acoustical imaging using capacitive micromachined ultrasonic transducer arrays: devices, circuits, and systems,” Ph.D. dissertation, Stanford University, 2004. [Google Scholar]
- [55].Ng A and Swanevelder J, “Resolution in ultrasound imaging,” Continuing Education in Anaesthesia Critical Care & Pain, vol. 11, no. 5, pp. 186–192, 2011. [Google Scholar]
- [56].Duan J, Zhong H, Jing B, Zhang S, and Wan M, “Increasing axial resolution of ultrasonic imaging with a joint sparse representation model,” IEEE Transactions on Ultrasonics, Ferroelectrics, and Frequency Control, vol. 63, no. 12, pp. 2045–2056, 2016. [DOI] [PubMed] [Google Scholar]
- [57].Tanter M and Fink M, “Ultrafast imaging in biomedical ultrasound,” IEEE Transactions on Ultrasonics, Ferroelectrics, and Frequency Control, vol. 61, no. 1, pp. 102–119, 2014. [DOI] [PubMed] [Google Scholar]
- [58].Choe JW, Oralkan O, Nikoozadeh A, Gencel M, Stephens DN, O’Donnell M, Sahn DJ, and Khuri-Yakub BT, “Volumetric real-time imaging using a CMUT ring array,” IEEE Transactions on Ultrasonics, Ferroelectrics, and Frequency Control, vol 59, no. 6, pp 1201–1211, 2012. [DOI] [PMC free article] [PubMed] [Google Scholar]
Associated Data
This section collects any data citations, data availability statements, or supplementary materials included in this article.


