

SUMMARY
Megakaryocytic-erythroid progenitors (MEPs) give rise to the cells that produce red blood cells and platelets. Although the mechanisms underlying megakaryocytic (MK) and erythroid (E) maturation have been described, those controlling their specification from MEPs are unknown. Single-cell RNA sequencing of primary human MEPs, common myeloid progenitors (CMPs), megakaryocyte progenitors, and E progenitors revealed a distinct transitional MEP signature. Inferred regulatory transcription factors (TFs) were associated with differential expression of cell cycle regulators. Genetic manipulation of selected TFs validated their role in lineage specification and demonstrated coincident modulation of the cell cycle. Genetic and pharmacologic modulation demonstrated that cell cycle activation is sufficient to promote E versus MK specification. These findings, obtained from healthy human cells, lay a foundation to study the mechanisms underlying benign and malignant disease states of the megakaryocytic and E lineages.
Graphical Abstract
In Brief
Bipotent megakaryocytic-erythroid progenitors (MEPs) produce megakaryocytic and erythroid cells. Using single-cell RNA sequencing of primary human MEPs and their upstream and downstream progenitors, Lu et al. show that MEPs are a unique transitional population. Functional and molecular studies show that MEP lineage fate is toggled by cell cycle speed.
INTRODUCTION
Studies of hematopoietic stem and progenitor cells enrich our understanding of many types of tissue stem cells and the molecular mechanisms of differentiation. During hematopoiesis, progenitor cells produced by hematopoietic stem cells (HSCs) undergo a hierarchical progression in which they gradually lose self-renewal capacity and differentiate as they specify and then commit to various cell lineages (Velten et al., 2017). Here we focus on a bipotent progenitor cell undergoing specification.
Both in vivo and in vitro, Megakaryocytic-erythroid progenitors (MEPs) differentiate to erythroid (E) or megakaryocyte (MK) lineages (Akashi et al., 2000; Debili et al., 1996; Sanada et al., 2016; Stachura et al., 2006; Vannucchi et al., 2000; Velten et al., 2017). Studies of the MK versus E lineages have identified several transcription factors that may play a role in MEP fate decisions (Xavier-Ferrucio et al., 2018). Specifically, Krüppel-like factor 1 (KLF1) and Friend leukemia integration 1 (FLI1) can play antagonizing roles in the MK and E lineages (Paul et al., 2015). Other transcription factors (e.g., GATA-1, GATA-2, RUNX1, and TAL1) are required for both lineages but bind in different combinations on different target genes (Hall et al., 2003; Kuvardina et al., 2015; Tripic et al., 2009). Previously, we used an improved method for enriching primary human MEPs (Sanada et al., 2016) in which colony-forming unit (CFU)-MK/E (single cells that give rise to colonies containing exclusively MK and E) are enriched to ~50%, with the remaining cells forming MK or E colonies. Other than these studies, in which we showed that MYB levels can toggle MEP fate (Sanada et al., 2016), little is known about the molecular mechanisms controlling MEP specification to MK versus E.
One of the challenges when studying the fate decisions of multipotent and bipotent cells has been the lack of high-purity populations of the specific cell type. Using our MEP enrichment strategy, we compared the molecular signatures of bipotential MEPs and specified progeny (MK progenitors [MKPs] and E progenitors [ERPs]). The data show that MEPs represent a transcriptionally distinct state denoted by markers and mixed common myeloid progenitors (CMPs) and MK versus E lineage priming. Unique gene expression patterns define each of the resolved progenitor populations, including MEPs, indicating that this differentiation process is governed by distinct regulatory processes in each population rather than strictly granular increases or decreases in transcription factor (TF) activity. We found that upregulation of cell cycle-associated genes is associated with MEP specification to both ERPs and MKPs but that these are different sets of genes. Analyses of these data inferred that regulatory TFs and genetic manipulation of selected TFs validated their role in modulating both lineage specification and cell cycle kinetics. The observation that broad aspects of cell fate decisions are coupled to cell cycle-regulatory mechanisms is becoming a common theme in multipotent cells, including HSCs (Mende et al., 2015), induced pluripotent stem cells (iPSCs) (Guo et al., 2014), and embryonic stem cells (ESC) (Boward et al., 2016; Soufi and Dalton, 2016). Thus, to determine whether the change in cell cycle is the consequence of cell fate choice or can itself regulate specification, we used pharmacologic and molecular approaches to modify the cell cycling of MEPs. By accelerating or slowing the cell cycle, we successfully modulated E or MK specification. These results suggest that (downstream of specifying TFs) the speed or frequency of the cell cycle is important in E versus megakaryocytic specification. An interactive viewer is provided to further dissect these data by the larger hematopoietic community.
RESULTS
Single-Cell Sequencing Data Reveal the Molecular Signatures of CMPs, MEPs, MKPs, and ERPs
MEPs, MKPs, and ERPs were enriched from primary human CD34 cells (Figure S1A). Single-cell functional assays were performed as described previously (Sanada et al., 2016). To assess MK and E differentiation, we used a collagen-based CFU assay with cyto-kines for MK and E cell differentiation (CFU-MK and/or E assay; Figure 1A). To confirm the purity of each cell population from different donors, we assessed for myeloid “contamination” of progenitors with granulocyte (G) and/or monocyte (M) lineage potential using methylcellulose-based medium with cytokines for G, M, and E differentiation (Figure 1B). CFU analyses of MEPs revealed highly reproducible relative compositions of the 3 major colony types and show less than 3% contamination with cells that form colonies containing Gs or Ms. MKPs (CD34+lin−Flt3−CD45RA−CD38mid MPL+CD36−CD41+) and ERPs (CD34+lin−Flt3−CD45RA−CD38++MPL−) had more than 80% and more than 90% purity for CFU-MK and burst forming unit (BFU)-E.
Figure 1. Single-Cell Deep Sequencing of Primary CMPs, MEPs, MKPs, and ERPs Reveals Transcriptome Changes.

Sorted CMPs, MEPs, MKPs, and ERPs were directly submitted for single-cell sequencing using the Fluidigm C1 platform, and aliquots of cells were functionally assayed using two colony-forming unit assays.
(A) Dual megakaryocyte (MK)/erythroid (E) assay showing colonies per 100 cells plated.
(B)Methylcellulose assay for colony-forming unit (CFU)-GEMM, CFU-G/M (including CFU-GM, CFU-G, and CFU-M), and BFU-E. See Figure S1A for the sorting strategy.
(C)Heatmap of ICGS scRNA-seq gene expression results from donor 1 (D1)with subsequent k-nearest neighbor alignment of single cells from donor2(D2). The originating donor and cell gating methods are indicated below the heatmap (see also Figure S1B).
(D)The number of differentially expressed genes for all pairwise group comparisons.
(E)Left: Monocle2 trajectory plot showing similar clustering results as Altanalyze shown in Figure 1C. Right: pseudotime represents the computational differentiation progress according to the Monocle algorithm.
The presence of BFU-Es and CFU-MKs in the MEP population could be due to the stochastic probability that a bipotent cell will undergo unilineage differentiation in the in vitro environment used, or it may be that the MEP sorting strategy does not result in a homogeneous population. To assess the heterogeneity of the enriched MEP population, we performed single-cell mRNA sequencing (scRNA-seq) of fluorescence-activated cell sorting (FACS)-enriched CMPs, MEPs, MKP, and ERP, (Sanada et al., 2016). After single cell capture using the Fluidigm C1 platform and sequencing (Torre et al., 2018), there were, on average, 504,984 aligned reads per cell with an average of 5,028 genes expressed (fragments per kilobase of transcript per million [FPKM] > 0.1) per cell. We first analyzed scRNA-seq data from sorted CMP, MEP, MKP, and ERP populations from a single peripheral blood stem cell (PBSC) donor (D1, n = 246 cells). Unsupervised analysis with a recently described iterative clustering and guide-gene selection (ICGS) algorithm in AltAnalyze (Olsson et al., 2016) identified separate major gene expression clusters for each of the sorted populations, along with subdivisions of the CMPs, MEPs, MKPs, and ERPs (Figure S1B). To confirm the major gene expression clusters associated with the four sorted populations, we performed scRNA-seq analysis of cells from a different donor (D2, n = 147 cells; Figure S1B, right) sorted with the same gating strategy but analyzed 1 plate of MEPs and 1 plate of a mix of 55% MKPs and 45% ERPs. Using a recently described k-nearest neighbor single-cell classification approach (Magella et al., 2018), nearly all of the CMP-gated cells clustered into a unique gene expression group (hereafter referred to as CMP), and a small subpopulation (consistent with the few CFU-granulocyte, erythrocyte, monocyte, MK [GEMM]) from the MEP sorted populations clustered with the CMPs (Figure 1C; http://altanalyze.org/ICGS/MEP/index.php). Cells in the gene expression group hereafter referred to as MEP were predominantly (92.2%) comprised of cells sorted as MEPs. The gene expression groups hereafter referred to as MKP and ERP were predominantly comprised of MKP- and ERP-gated cells (95% and 91%), respectively. The combined ICGS heatmap with cells and markers from the combined donors is shown in Figure 1C. T-distributed stochastic neighbor embedding (tSNE) visualization confirmed segregation of the donor cells into these four progenitor populations (Figure S1C).
Based on the gene expression groups, 2,368 genes were differentially expressed (moderated t test, p < 0.05, false discovery rate [FDR] adjusted (adj.), fold change > 2) between CMPs, MEPs, MKPs, and ERPs (Table S1), several of which agree with previous reports. For example, FLI1 is higher in MKPs than CMPs, MEPs, or ERPs, consistent with its known upregulation with MK commitment (Chen et al., 2014; Chlon and Crispino, 2012; Eisbacheret al., 2003). GATA1 is low in CMPs and highly expressed in MEPs, with increasing expression levels in both MKPs and ERPs, consistent with its role in E and MK differentiation (Chen et al., 2014; Paul et al., 2015). ERPs have higher expression of LMO2, LMO4, KLF1, and MYB, all TFs important for E differentiation (Paul et al., 2015). In summary, our cell clustering results clearly distinguish four progenitor populations, and the purity of each cluster is highly coordinated with the sorting strategy, as expected from the in vitro phenotype.
Single-Cell Sequencing Indicates that MEPs Have a Distinct Gene Expression Signature Consistent with a Continuous Transition State from CMPs to MKPs and ERPs
As shown in Figure 1C, the MEP population is distinct from CMPs, MKPs, and ERPs in that it shows clear evidence of multi-lineage priming with coincident retention of genes unique to CMPs and activation of expression of genes that are unique to MKPs and ERPs (Magella et al., 2018; Olsson et al., 2016). We compared the gene expression patterns of these groups. Only 535 genes were differentially expressed between CMPs and MEPs, whereas other comparison groups have 600–1,400 differentially expressed genes (Figure 1D), suggesting that CMPs and MEPs have a more similar gene expression pattern relative to the other profiled cell populations.
We applied the Monocle2 algorithm to analyze how the individual cells best relate to one another. Because Monocle2 of all genes highlights donor rather than cell population differences, we restricted our analysis to Monocle-derived co-varying genes associated with the four cell populations (STAR Methods). With this approach, Monocle2 predicts that CMPs (60% of Monocle cluster 1) and MEPs (70% of Monocle cluster 2) are closely related and share the same “track,” whereas Monocle cluster 3 (97% of MKPs) and cluster 4 (85% of ERPs) are on separate branches extending from cluster 2 (Figure 1E, left). The Monocle2 pseudotime plot suggests a granular relation between the four groups of cells (Figure 1E, right). To minimize population gene bias and further highlight possible cellular transitions that occur during the MK and/or E lineage fate decision, we reapplied pseudotemporal ordering specifically to the top 60 ICGS markers associated with each progenitor population. In addition to confirming the progenitor population ordering, this analysis partitions the MEPs into three cell states transitioning out of the CMPs (MEP-1,29%) into the MKPs (MEP-2, 53%) or ERPs (MEP-3, 18%) (Figure S1D). Defining genes within these clusters reflected the associated lineages (e.g., SPINK for MEP-1, VWF for MEP-2, and SLC14A1 for MEP-3; Table S2).
Identifying Unique Gene Expression Signatures and Potential Transcriptional Networks
After identifying 2,368 genes that are differentially expressed between CMPs, MEPs, MKPs, and ERPs and showing that MEPs represent a distinct cell population that gradually undergoes gene expression changes prior to specification to the MK and E lineages, we categorized the genes into 13 groups based on expression patterns, including population-specific and potential multi-lineage marker genes (Figures 2A and S2A). This analysis identified a gene subset differentially expressed in MEPs (162 of 2,368), with only a small set of genes exclusive to MEPs (e.g., LBH, NR4A1, and GPR141; Figure 2B). More frequent, however, were MEP genes coincidently expressed in CMPs (465 of 2,368) as well as 742 genes co-expressed with ERPs and/or MKPs. We further observed that the largest non-unique (expressed in multiple groups) gene category is the shared MKP-ERP (295 genes), with the second largest being MEP-MKP-ERP (265 genes), consistent with MEPs representing a transition from upstream CMPs to downstream ERPs or MKPs.
Figure 2. Gene Expression Patterns Reveal Unique Transitional Gene Expression in MEPs.

(A) The 13 categories based on differential gene expression patterns assigned by the lmfit function of Linear Models for Microarray and RNA-Seq Data (LIMMA) (see also Figure S1C). The intensity of each red voxel corresponds to the number of displayed genes in each category. The total number of genes with each expression pattern and its opposite are indicated in the last column.
(B) Representative genes for each category are shown as a cell expression amplitude combplot to indicate frequency differences in the expression of the selected genes in all of the individual cells from CMP (black), MEP (green), MKP (blue), and ERP (red).
(C) Heatmap of inferred regulatory interactions from genomic states, illustrated from pairwise correlations between all cell population differentially expressed genes (xaxis) and differential transcription factors (TFs) (y axis). Selected marker genes are shown at the top of the plot, and the top statistically enriched Pathway Commons term (green) or progenitor population ICGS markers (blue) are displayed below the plot. Highlighted genes and TFs are bolded in red.
Using a previously described method to infer TF regulation from scRNA-seq (Paul et al., 2015), we found significant correlation between specific TFs and differentially expressed genes, which includes distinct cell cycle regulators in MKPs and ERPs (Figure 2C). This analysis identifies sets of TFs in MEPs that potentially drive fate decisions, which leads to new hypotheses and new avenues of research. For example, GFI1B and MYBL2 are associated with MKPs, MYB and KLF1 with ERPs, and chromatin modifiers such as NCOA3 with MEPs. This correlation analysis also reveals potential gene networks and pathways such as GATA1, TFDP1, and MCM5 cooperation with the chromatin modifier CHAF1B and a tight interaction between TP53, KLF1, and LMO2 in the regulation of key E genes.
Pathway Analysis Indicates Cell Cycle Regulation Changes When MEPs Commit to MKPs or ERPs
The TF-to-gene association also revealed that cell cycle genes are differentially associated with subpopulations. To identify potential signaling and transcriptional regulatory networks governing MKP versus ERP specification, we searched the gene ontology (GO) and Reactome databases (Figure 3) using genes from the five largest categories in Figure 2A. For MKP-specific genes, Metascape indicates that cell cycle and DNA replication genes are the most significantly enriched (Figure 3A, left). Genes highly expressed in both MKPs and ERPs are also enriched for cell cycle regulation, but these are different sets of genes. To determine which TFs are potentially responsible for these gene changes, we used Enrichr gene enrichment analysis using two protein-DNA interaction databases, Encyclopedia of DNA Elements (ENCODE) and ChEA (ChIP Enrichment Analysis). Upstream TF binding enrichment analysis indicated that MYC-MAX dimers may regulate the most enriched genes. We note that MYC is one of the predicted regulatory TFs in ERPs (Figure 2C) and that MYC target genes are enriched in the ERP-specific and MEP-MKP-ERP-upregulated gene lists (Figures 2C and 3A, right). In contrast, cell cycle and TF genes are not enriched in the CMP gene set. Analysis of the gene groups that changed between CMPs versus MEPs, MEPs versus MKPs, and MEPs versus ERPs (Figure S2B) revealed that cell cycle and DNA replication genes are the most significantly enriched gene category in the MEP versus MKP gene change list as well as for genes upregulated in MKPs. In contrast, the CMP versus MEP gene set is enriched for genes involved in cytokine signaling and hematopoiesis (e.g., CSF3R). Enrichr analysis indicates that MEP- versus MKP-changed genes may be regulated by several cell cycle-related factors, including E2F1, E2F4, and MYC (Figure S2B, right). The MEP- versus ERP-changed genes are predicted to be regulated by TFs in the GATA family and RUNX1.
Figure 3. Induction of a Cell Cycle-Regulatory Program in MEP Transition to MKP and ERP.

(A) GO analysis results for the five most abundant gene sets among the 13 gene categories in Figure 1F.
(B) Gene set enrichment analyses (GSEA) for Hallmark and Reactome gene sets indicate the MYC pathway; cell cycle gene sets were enriched after specification, and the p53 pathway decreases during specification.
(C) Schematic of the gene network, showing the predicted interaction of a set of key changed genes in MEP to MKP or MEP to ERP, derived using NetPerspective. Red arrows indicate putative transcriptional regulatory interactions derived from chromatin immunoprecipitation (ChIP) or other databases (PAZAR, Amadeus, and TRRUST). Grey arrows indicate protein-protein interactions. The key shows designations for genes that are significantly increased (red) or decreased (blue) in MKPs (left hemicircle) and/or ERPs (right hemicircle) compared with MEPs.
Gene set enrichment analysis (GSEA; Figure 3B) for changed genes from the Hallmark gene set database show that all cell cycle stages as well as E2F and MYC target genes are among the most significantly enriched groups for both the MEP versus MKP and MEP versus ERP changes. However, the gene changes do not point to a specific cell cycle stage as being affected. To further illustrate the potential gene regulation network, we used NetPerspective analysis in AltAnalyze to visualize the network of changed genes in MEPs versus MKPs and MEPs versus ERPs (Figure 3C), which shows that cell cycle-related genes are involved in MKP and ERP fate specification but apparently via different regulatory networks. Although TFDP1, a TF that heterodimerizes with E2F proteins to promote transcription from E2F target genes, and PCNA, a cofactor of DNA polymerase delta involved in DNA replication and DNA damage response, are increased in both ERPs and MKPs, genes specifically increased in MKPs are more related to cell cycle machinery genes such as CDCs and CDKs, and genes increased in ERPs are more related to cell cycle-regulatory genes, including TP53 (p53), MYC, and CDKN1C (p57). The pathways also show known TFs with roles in E and MK differentiation, including MYB and KLF1 in the E and FLI1 and GFI1B in the MK lineage (Doré and Crispino, 2011; Randrianarison-Huetz et al., 2010). In summary, GO, ChIP Experiment Database (ChIP-X), and GSEA analyses for both MEPs versus MKPs and MEPs versus ERPs show that cell cycle genes are increased in the MKP and ERP populations and that these increased genes differ for MKPs versus ERPs.
Validation of the Inferred Regulators MYC and p53 as Effectors of the MEP Fate Decision
To confirm that MYC, which is correlated with ERPs (Figure 2C) and regulates the cell cycle, controls MEP specification, we knocked down MYC and MAX, which are significantly altered in our single-cell sequencing data (Figure 4A). MYC, which is downstream of many growth-promoting signaling pathways (Dang, 2012), heterodimerizes with MAX to bind E-box elements to activate transcription (Blackwood and Eisenman, 1991). Adult mice with Myc deletion in the myeloid compartment show significant thrombocytosis and severe anemia (Guo et al., 2009), and MYC is important in both MK and E maturation (Delgado and León, 2010; Takayama et al., 2010). Whether MYC inhibition and/or downregulation promotes the MK fate decision at the MEP level has previously not been assessed.
Figure 4. MYC and MAX Regulate the Cell Cycle and MEP Specification.

(A) MYC and MAX are differently upregulated in ERP and MKP, respectively, in the scRNA-seq data.
(B)Two shMAX retroviral constructs were used to suppress intrinsic MAX expression in HEK293T and CD34+cells. qRT-PCR for MAX shows gene suppression in CD34+ cells (top) (n = 3). Western blot (immunoblot [IB]) on transduced HEK293T cells (bottom) shows the protein decrease.
(C) Transduced CD34+ cells were sorted for GFP+ MEPs, and proliferation was assessed by CFSE dilution. Both shMAX-1 and shMAX-2 suppress cell proliferation (primary data; Figure S3A).
(D) Transduced cells with control or 2 different shRNAs targeting MAX gene were sorted for MEPs (green bar below), MKPs (blue), and ERPs (red) and then assayed for CFU-MK and/or E (n = 3).
(E) shMYC decreases MYC RNA and protein (n = 3).
(F) Transduced MEPs were selected with puromycin and labeled with CFSE. After 72 hr, cycling was significantly decreased compared with the scrambled shRNA control.
(G) Transduced MEPs were assayed by CFU-MK and/or E (n = 4, primary data plot in Figure S3B).
(H) shRNA knockdown of p53 reduces ~80% of RNA (left) and ~90% of protein (right) expression.
(I) sh-p53-transduced MEPs have a slightly faster cell cycle after 72 hr.
(J)sh-p53-transduced MEPs have increased E specification (primary data; Figure S3C).
(K) CFSE-labeled MEPs were cultured in liquid medium for 72 hr.
(L) After 72 hr, cells were stained with CD41 and CD36.
(M) CFU-MK and/orEon fast, medium, and slowly proliferating cells sorted by FACS indicatesthat bipotent cells(green) were enriched inthe slowest-proliferating and E-specified (red) cells in the fastest-proliferating populations (n = 4).
Error bars represent the SE; *p < 0.05, **p < 0.01.
To validate the inferred role of MYC-MAX in the MEP fate decision, we first used 2 different short hairpin RNAs (shRNAs) that each suppress MAX mRNA by ~80% (in CD34+ cells) and protein by ~70% (in HEK293T cells; Figure 4B). Carboxyfluorescein diacetate succinimidyl ester (CFSE) dilution on transduced cells indicated decreased MEP cycling with MAX knockdown (Figure 4C). These shRNAs in MEPs increased MK lineage colonies at the expense of E and MK and E colonies (Figure 4D; absolute colony counts in Figure S3A) but had little effect on already lineage-specified MKPs and ERPs, consistent with MAX influencing the probability that a bipotent MEP will choose the MK versus E fate rather than reprogramming an already E-specified cell to the MK lineage. Similar results were obtained with MYC shRNA. With ~50% suppression of MYC mRNA and protein expression (Figure 4E), MEPs had decreased cycling (Figure 4F) and increased CFU-MK at the expense of CFU-MK/E (Figure 4G; absolute colony counts in Figure S3B). Consistent with decreased proliferation, colonies with MYC and MAX suppression were smaller than with control shRNA.
Next, we tested the effects of knockdown of p53 (TP53). Sh-p53 suppressed RNA and protein levels by ~80% and ~90% in HEK293T cells, respectively (Figure 4H). 72 hr after transduction, p53 knockdown in MEPs slightly increased cell proliferation (Figure 4I) and increased E specification in MEPs but not in lineage-specified MKPs and ERPs (Figure 4J; absolute colony counts in Figure S3C). Consistent with increased proliferation, the E colony size after p53 knockdown in MEPs and ERPs was significantly larger than shRNA controls. Together, these data validate MYC-MAX complexes and p53 as effectors in both MEP fate and cell proliferation.
The Cell Cycle Speeds of MEPs, MKPs, and ERPs Are Significantly Different In Vitro
Next, To determine whether changes in cell cycle regulation are the consequence or cause of specification, we first tested the differences in mitotic frequency in vitro between CFU-MK/E, CFU-MK, and BFU-E. After culturing CFSE-labeled MEPs (CD41−CD36−) in liquid medium with cytokines that promote E and MK differentiation for 72 hr, we assessed the CFSE level (Figure 4K) versus cell surface expression of CD41 and CD36 representing MK or E lineage specification, respectively (note that CD36 is expressed early in E specification but is also upregulated on MKs over time). Gating on the fastest-cycling (lowest CFSE intensity) cells revealed the most E-specified cells (CD36+CD41−), whereas bipotent MEPs (CD36−CD41−) were enriched in the slowest-cycling (highest CFSE intensity) population (Figure 4L). At 72 hr, we sorted the three CFSE groups and seeded equal numbers of cells in the dual MK and/or E-CFU assay, which indicated that the most proliferative cells were enriched for BFU-E, the least proliferative cells were enriched for CFU-MK/E (bi-potent ability), and CFU-MK were most highly represented in cells with medium proliferation (Figure 4M). These data suggest, but do not prove, that differences in cell cycle speed between MEP to MKP or ERP may be a regulatory element controlling fate decisions rather than the outcome of a fate decision. Thus, we next directly tested the effects of interfering with cell cycle progression on MEP fate decisions.
Inhibition of Cell Cycling Is Associated with MK Specification of MEPs
We tested several drugs and cytokines that regulate cell signaling to investigate the mechanism of MEP fate determination, including 5-Aminoimidazole-4-carboxamide ribonucleotide (AICAR) (Ho et al., 2017) (an analog of AMP), mitochondrially targeted antioxidant (mitoTEMPO) (Jang et al., 2015), interleukin-9 (IL-9), IL-11, Ly364947(Naka et al., 2010) (a transforming growth factor β [TGF-β] inhibitor), all-trans retinoic acid (ATRA), and rapamycin (Wang et al., 2016) (a mechanistic target of rapamycin [mTOR] inhibitor). However, only Ly364947, ATRA, and rapamycin affected the MEP fate decision (Figure 5); the others had no significant effect (data not shown). Ly364947, ATRA, and rapamycin each decreased CFU-MK/E and increased CFU-MK with little effect on BFU-E (Figures 5B, 5D, and 5F). Although these drugs affect different signaling pathways and have different mechanisms of gene regulation, they all slowed MEP cycling during the first 72 hr of treatment (Figures 5A, 5C, and 5E). Consistent with decreased MK/E and E colonies, CD36 expression was delayed or diminished by these drugs (data not shown). LY294002, a phosphatidylinositol 3-kinase (PI3K) inhibitor upstream of mTOR, gave results similar to rapamycin (data not shown). Indeed, both the PI3K-mTOR and Ras-ERK pathways activate cell cycling and cell survival. To study the molecular mechanisms underlying the effects of ATRA and rapamycin on MEP fate decisions, we first changed the CFU assay protocol by pre-incubating the MEPs in liquid culture with ATRA or rapamycin for 48 hr and then plating the cells for CFU-MK and/or E without drugs for 14 days. The results (Figure 5G) indicate that the effects of ATRA, Ly294002, and rapamycin on MEP fate decision are determined within 48 hr, which allowed us to assess changes in gene expression that occur with changes in fate probabilities. RT-PCR of MEPs after 48 hr shows that FLI1 is upregulated by both ATRA and rapamycin treatment (Figure 5H). The RT-PCR data also reveal that the cell cycle-slowing effects of ATRA and rapamycin are likely mediated by different genes. ATRA does not directly affect cyclin expression but increases CHEK1 expression, which decreases the cell cycle via phosphorylation of CDC25A. Rapamycin, in contrast, decreases cyclin E and increases p57 (KIP2) to decrease or slow the cell cycle. MYC mRNA levels were not changed by either drug (data not shown). In summary, our CFU assay results indicate that the MEP fate decision may be regulated by the PI3K-mTOR and/or ATRA pathways, each of which targets the cell cycle.
Figure 5. Drugs Targeting Different Signaling Pathways Affect MEP Fate Decisions.

(A) LY-364947 (LY) decreases MEP proliferation (analyzed at 72 hr) compared with the DMSO control.
(B) CFU-MK and/or E assay with LY364947 (n = 3).
(C) Rapamycin decreases MEP proliferation (analyzed at 72 hr) compared with the control.
(D) CFU-MK and/or E assay with rapamycin (n = 3).
(E) All-trans retinoic acid (ATRA) decreases MEP proliferation (72 hr) compared with the control.
(F) CFU-MK and/or E assay with ATRA (n = 4). Error bars represent the S.E. (n = 4 different donors).
(G) Sorted MEPs were treated with LY, ATRA, orrapamycin atthedoses indicated below for 48 hr. After treatment, 300 cells from each experiment were seeded in the CFU-MK and/or E assay without drug (n = 4). The data indicate that drug treatment for 48 hr already affects the MEP fate decision.
(H) RNA was obtained from the remaining drug-treated cells used in (G) at 48 hrfor qRT-PCR (n = 4). Results (shown as gene expression relative to DMSO control-treated cells set as 1) show that, although both ATRA and rapamycin suppress the cell cycle and increase MK colonies, they do so via different gene-regulatory pathways. Error bars represent the SE (n = 4 different donors).
*p < 0.05, **p < 0.01.
The Effect of Overexpressing CCND1-CDK4 or CCNE1-CDK2 on MEP Fate Decisions
We next wanted to know whether the cell cycle machinery itself can influence cell fate decisions and whether increased cell cycling would promote E over MK fate specification. We directly modified the cell cycle machinery using genetic and pharmacological approaches. We enforced overexpression of both CDK4 and cyclin D1 (using a vector called 4D) or overexpression of both CDK2 and Cyclin E (called 2E) to regulate the cell cycle. Published data show that, in murine hematopoietic progenitors, 4D accelerates the cell cycle by shortening G1, whereas 2E leads to loss of function and cell death (Mende et al., 2015). This previous study found that myeloid cells were increased by D4 overexpression, but the MK and E lineages were not assessed. After first validating the expression of the transgenes encoded by the 2E and 4D vectors (Figure 6A), we showed that both E2 and D4 increase the proliferation frequency by about 1 cycle over 72 hr (Figure 6B). We then transduced human CD34+ cells and, 48 hr later, sorted for transduced (GFP+) MEPs, MKPs, and ERPs and assessed their fate decisions via the CFU-MK and/or E assay. Both 2E and 4D overexpression promoted E lineage specification (increased BFU-E) of MEPs at the expense of CFU-MK and CFU-MK/E (Figures 6C and S4). However, this accelerated cell cycling did not affect the fate of already lineage-specified primary MKPs or ERPs. We also assessed the effect of palbociclib (PD0332991), a selective CDK4 and CDK6 inhibitor that targets G1 of the cell cycle, on the MEP fate decision. Palbociclib strongly suppressed MEP proliferation (Figure 6D) and promoted CFU-MK specification (Figure 6E). Thus, we demonstrate a robust and reproducible phenotype that can be achieved by multiple approaches; increasing cell cycling increases E specification, whereas decreasing cell cycling increases MK specification.
Figure 6. Acceleration of the Cell Cycle Increases Erythroid Specification of MEPs.

(A) Retrovirus-mediated overexpression of cyclinE-CDK2 (2E) and cyclinD-CDK4 (4D) in MEPs. qRT-PCR validates overexpression in GFP+ transduced CD34+ cells (left). Western blot (right) indicates that the CDK2 or CKD4 protein level was increased in 2D- or 4D-transduced HEK293T cells, respectively.
(B) 24 hr after transduction, CD34+ cells were sorted for GFP+ MEPs, MKPs, and ERPs and then labeled with CFSE and cultured for 72 hr. Both 2E and 4D increase cycling compared with the control vector.
(C) Sorted transduced cellswere analyzed by CFU-MK and/or E. Increased cycling promotes E specification of MEPs but not MKPs or ERPs (n = 3; primary data; Figure S4A).
(D) PD0332991 (PD) suppresses MEP cycling (analysis at 72 hr).
(E) CFU-MK and/or E assay with PD (n = 4).
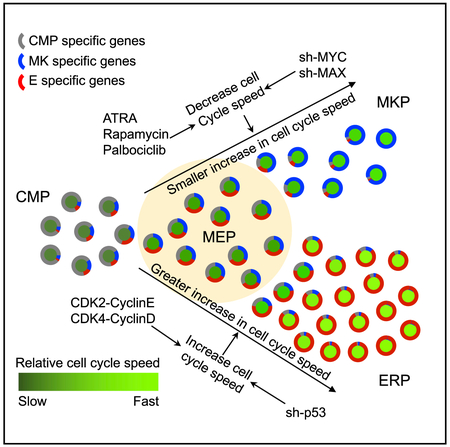
(F) Model of gene expression and cell cycle speed changes during the MEP fate decision. CMP-specific genes (gray in the outer circle) gradually decrease, and MKP- or ERP-specific genes (blue and red in the outer circle) gradually increase during MEP → MKP or MEP → ERP specification. The cell cycle speed (central circle) increases with both MKP and ERP specification, but ERPs have significantly more proliferation than MKPs.
Error bars represent the SE; *p < 0.05, **p < 0.01.
Taken together, our single-cell sequencing data from 4 cell populations sorted by FACS reveal that MEPs represent a transitional stage just prior to E versus MK specification. Our data support a mechanism of cell fate decision in the MEP in which changes in cell cycle regulation are not just a consequence of the cell fate decision but, rather, cell cycling itself affects the lineage fate decision of MEPs (Figure 6F).
DISCUSSION
Although important insights into hematopoiesis have been provided by new technologies such as single-cell sequencing and mass cytometry (Bendall et al., 2011; Olsson et al., 2016; Paul et al., 2015), it has remained difficult to obtain snapshots of transitional populations prior to specification because these cells are rare and because functional assays of lineage potential were not matched with the high-throughput data obtained (Xavier-Ferrucio et al., 2018). Important single-cell studies (Hamey and Göttgens, 2017; Velten et al., 2017) have revealed the complexity of these systems but have not elucidated the mechanisms underlying hematopoietic fate decisions, including MEP fate specification (Notta et al., 2016; Rundberg Nilsson et al., 2016). In this study, we directly compare the transcriptome of a highly enriched human MEP subpopulation with that of its specified progeny, MKPs and ERPs (Sanada et al., 2016), and its potential parent, CMPs, according to rigorous single-cell functional assays. The single-cell sequencing data confirm the expression of several MK- and E-specific genes in MKPs and ERPs, such as VWF and KLF1, but at low cell frequencies (<25% of MKPs or ERPs) either because of dropout in the single-cell approach or, more likely, because these genes are more highly expressed after MK and E commitment and thus may not be highly represented in these specified MKPs and ERPs. Importantly, our MEP scRNA-seq data are consistent with bi-lineage priming in the MEP. Notably, the MEP shares gene expression clusters found in both predicted precursor CMPs as well as progeny MKPs and ERPs, suggestive of the multilineage priming of metastable intermediates (Olsson et al., 2016). The data did not reveal an improved surface marker signature to distinguish CMPs and MEPs. We tested whether CD52, which is expressed at significantly higher levels in CMPs than in MEPs, MKPs, and ERPs, could be used, but the data showed no improvement in enrichment (data not shown), likely because protein expression is delayed compared with RNA expression. Both our trajectory and differential expression analyses suggest a slight bias of the MEP toward MK specification; however, we cannot exclude that some of the MEPs are derived from an MK-biased HSC (Gekas and Graf, 2013; Sanjuan-Pla et al., 2013).
Here we present evidence that cell cycle regulation directly affects MK versus E lineage fate determination. Having demonstrated that activating or repressing the cell cycle essentially serves as a rheostat to affect the E versus Mk specification of MEPs leads to many compelling questions. What is the mechanism by which the cell cycle affects cell fate decisions? Prior studies of how cell cycle changes affect cell fate decisions suggest that the mechanisms will be complex, multi-faceted, and cell type-specific (Chen et al., 2015). For hematopoietic progenitors, Kueh et al. (2013) showed that cell cycle slowing leads to Pu.1 protein accumulation to promote myelomonocytic over B cell fates. Thus, changes in the ratios of TFs with different halflives and rates of synthesis may underlie how MEP fate is affected by cell cycle speed and/or frequency. In embryonic stem cells, different mitotic rates can lead to differential compartmentalization of key SMAD TFs to affect fate decisions (Pauklin and Vallier, 2013). Also, shortening of S phase is required for commitment to terminal E differentiation, likely because of changes in DNA methylation (Hwang et al., 2017). Future studies of how the cell cycle affects MEP fate decisions will examine these mechanisms.
These findings advance our current knowledge of the interplay of cell fate decisions and cell cycle regulation and have strong implications for a broad spectrum of developmental decisions while also contributing to our understanding of human disease.
STAR★METHODS
CONTACT FOR REAGENT AND RESOURCE SHARING
Further information and requests for reagents may be directed and will be fulfilled by the Lead Contact, Yi-Chien Lu (yi-chien.lu@yale.edu).
EXPERIMENTAL MODEL AND SUBJECT DETAILS
Human subjects
All work was conducted according to Declaration of Helsinki principles. Collection and use of human cells was approved by the Yale University Institutional Review Board. Healthy donors who were already donating cells for allogeneic transplantation provided written informed consent prior to use extra human granulocyte colony-stimulating factor (G-CSF) mobilized cells for research. MEP, MKP and ERP were isolated from CD34-selected primary human G-CSF mobilized peripheral blood from healthy donors as described (Sanada et al., 2016).
METHOD DETAILS
Single cell sequencing and data analysis
The sorted populations were collected in culture medium and counted for cell concentration and post-sort viability (range, 86%–95%). For single cell sequencing, cells were washed twice with PBS with 0.5% BSA and submitted for cell capture using the Fluidigm C1 system. We selected wells with only one live cell captured for barcoding and sequencing library preparation. Each plate (96 samples) was run in one lane on an Illumina HiSeq2000 system. The Fluidigm paired-end FASTQ files were aligned to the human genome (hg19) and transcriptome using TopHat2/Bowtie2. Gene expression quantification and normalization was performed using Cuffnorm command in CuffLink package. The resultant expression data were analyzed using AltAnalyze version 2.1.1 (Emig et al., 2010). We validated the expression of several MK and E specific genes in the sorted populations. In AltAnalyze, Iterative Clustering and Guide-gene Selection (ICGS) was applied, parameterized to remove the cell cycle effects on CMP, and presumptive MEP, MKP and ERP sorted cell populations from a single PBSC (donor 1, n = 246 cells). To confirm the major expression clusters associated with the 4 sorted populations, we performed scRNA-Seq using an independent donor (donor 2, n = 147 cells) with plates comprised of a MEP and a mixed population of 55% MKP and 45% ERP. From the original donor 1 ICGS analysis, the cells were aggregated into 4 states, based on the number of unique genes detected in each cell population (smaller populations with few unique genes were combined). Donor 2 expression profiles were subsequently aligned to the major ICGS populations using k-nearest neighbor strategy against the four ICGS reference cell state centroids and genes as described (Magella et al., 2018). For the Monocle semi-supervised analysis we applied two of the top lineage markers for each ICGS-progenitor population (MarkerFinder and literature guided), in place of Monocle derived marker genes (calculateMarkerSpecificity function). These genes were applied to the selectTopMarkers option, to select 120 covarying genes per cell state. As an alternative to the selection of Monocle covarying genes, we performed a supervised Monocle2 (Qiu et al., 2017) analysis using only the top 60 ICGS-MarkerFinder derived genes, to equally weight markers for the four progenitor populations. This option produced a distinct pseudo-graph without breakdown of additional populations for ERP.
Modified MegaCult assays
The dual MK and E colony assay was performed as previously described (Sanada et al., 2016). Liquid culture of sorted MEPs was performed in StemSpan Serum Free Expansion Medium (Stem Cell Technologies) with rhEPO (3.0 U/mL), rhIL-3 (10 ng/mL), rhIL-6 (10 ng/mL), and rhSCF (25 ng/mL) with/without rhTPO (50 ng/mL) for 48h. All cytokines purchased from ConnStem (Cheshire, CT) except rhEPO (Amgen).
Gene expression analysis
RNA was extracted from sorted MEPs, MKPs, and ERPs using the RNAqueous-Micro Total RNA Isolation Kit (Ambion). 1 to 10 ng total RNA was reverse transcribed using the iScript cDNA synthesis system (BioRad). PCR was performed in triplicate for each reverse transcriptase (RT) product, with Syber Green on a CFx96 real time system, and threshold cycles for TP53, MYC, MAX, CyclinD-CDK4, CyclinE-CDK2 were normalized to GAPDH. Relative gene expression was calculated as 2−ΔΔCT. Primers that used in this research to detect gene expression are from PrimerBank (Spandidos et al., 2010).
Carboxyfluorescein diacetate succinimidyl ester labeling to assess cell division
After washing twice with PBS, cells were labeled for 10 minutes at 37°C with 2 μM carboxyfluorescein diacetate succinimidyl ester (CFSE; Thermo Fisher Scientific) in PBS. CFSE staining were then stopped by adding culture medium at 37°C for another 10 min, then washed once with culture medium. After 72h of culture, cells were labeled with anti-CD41 APC-H7, anti-CD36 PE and analyzed for CSFE using an LSRII flow cytometer. For shRNA transduced cells, CFSE labeling was started 24h after viral transduction. The CFSE labeled transduced cells were cultured in liquid medium with cytokines and puromycin for positive selection for 72h prior to FACS analysis.
Virus production
For MAX knockdown, lentiviral vector pLKO.8 was produced by the YCCEH cell analysis core (Yale Univ), by replacing the puromycin resistance gene in pLKO.2 with GFP cDNA amplified by oligonucleotide pairs: agcggatcctcgccaccatggtgagcaag and aggggtaccagctagctactagctagtc from pMIRWAY-GFP. pLKO.8 was used with a short hairpin RNA (shRNA) against MAX or luciferase (shLuc). The sequences of the shRNAs against human MAX were obtained from the RNAi Consortium (https://portals.broadinstitute.org/gpp/public/: shMAX-1 and shMAX-2 are clones TRCN0000231550 and TRCN0000039864, respectively. Plasmid construct for sh-p53 and sh-MYC were purchased from VectorBuilder Biosciences Inc. (Guangzhou) in a lentiviral vector with GFP:T2A:Puro selection markers. For CyclinD-CDK4 (4D) and CylinE-CDK-2(2E) retroviral construct production, the original 4D and 2E in pMA-RQ vector (Life Technologies) were kindly provided by the Waskow lab (Mende et al., 2015). The 4D and 2E gene fragments were subcloned into the pMSCV vector provided by the YCCEH (Cheng et al., 2013). The pMSCV (Murine Stem Cell Virus) retroviral construct contain a MSCV LTR promoter driven insertion gene with a PGK promoter driven EGFP and puromycin resistance genes.) For virus production, 90% confluent 293T cells were transfected with pLKO.8 shMAX-1/2, shMYC, shTP53 (or pLKO.8 shLuc as control), Gag/VSVG, and Gag/Rev with FuGENE HD (Promega). Virus was collected 24, 36, and 48h after transfection, and each collection was 0.45-m filtered, concentrated using Amicon filters (Millipore, Billerica, MA), and frozen in aliquots at −80°C.
Transduction
CD34+ cells were transduced as described previously (Sanada et al., 2016). When indicated, cells were sorted for GFP+ MEP, GFP+ MKP, and GFP+ ERP after 24h. Alternatively, sorted MEP, MKP and ERP were cultured in expansion media at density 5 × 10⁵ cells/mL and transduced with lentivirus. 18h after transduction, cells were seeded for CFU-MK and/or E and analyzed by fluorescence microscopy as described (Xavier-Ferrucio et al., 2018).
Drug treatment
Sorted MEP, MKP and ERP were cultured at 2 × 10⁵ cells/mL in 100 μL expansion medium (as above) for 16h. All-trans-Retinoic-acid (Sigma-Aldrich), Ly364947 (Sigma-Aldrich), and PD0332991 (Sigma-Aldrich) were dissolved in proper solvent (DMSO or ddH2O) and added to each well to meet the desired final concentration. An equal amount of solvent (2 μl/well) was added for the controls.
Western blotting
Western blottng was performed as previously described. Protein was transferred to polyvinylidene diflouride membranes (Millipore) and immunoblotted with anti-human CDK2 rabbit monoclonal, anti-human CDK4 mouse monoclonal, anti-human c-Myc rabbit monoclonal (D84C12), or anti-human p53 mouse monoclonal (clone:1C12) antibodies (all at 1:2000; Cell Signaling). Additional antibodies included anti-human MAX mouse monoclonal (1:2000; Abcam), anti-beta Actin HRP conjugated monoclonal (1:5000; Santa Cruz), or anti-GAPDH HRP conjugated monoclonal antibody (1:2000; Santa Cruz) for at least 1h at room temperature or 4°C overnight. HRP–conjugated goat anti-mouse or anti-rabbit secondary antibodies (Santa Cruz) were added when needed.
QUANTIFICATION AND STATISTICAL ANALYSIS
Results are expressed as mean ± Standard Deviation (SD) or Standard Error (SE) when appropriate. For CFU assays, statistical differences were evaluated using the Student’s t test with significance at p of 0.05 or less.
DATA AND SOFTWARE AVAILABILITY
Single cell RNA-seq data that support the findings of this study have been deposited in the Gene Expression Omnibus (GEO) under accession code GSE112692. Processed data are available athttp://altanalyze.org/ICGS/MEP/index.php for browsing. All other data supporting the findings of this study are available from the corresponding author upon reasonable request.
Supplementary Material
KEY RESOURCES TABLE
| REAGENT or RESOURCE | SOURCE | IDENTIFIER |
|---|---|---|
| Antibodies | ||
| Mouse anti-Human CD41 APC-H7 | BD PharMingen | Cat#561422 |
| Mouse anti-Human CD110 APC Clone:1.6.1 | BD PharMingen | Cat#562199 |
| Mouse anti-Human CD38 PE-CF594 | BD Horizon | Cat#562325 |
| Mouse anti-Human CD34 Brilliant Violet 421 | Biolegend | Cat#343609 |
| Mouse anti-Human CD45RA Brilliant Violet 711 | Biolegend | Cat#304137 |
| anti-Human CD135 PE | Biolegend | Cat#313306 |
| anti-Human CD36 PE | Biolegend | Cat#336205 |
| Bv510 Streptavidin | BD Horizon | Cat#563261 |
| Biotin mouse anti-Human CD19 | BD PharMingen | Cat#555411 |
| Biotin mouse anti-Human CD7 | Invitrogen | Cat#13-0079-82 |
| Biotin mouse anti-Human CD10 | Invitrogen | Cat#13-0108-80 |
| anti-human MAX antibodies | Abcam | Cat#ab53570 |
| anti-human p53 (clone:1C12) antibodies | Cell Signaling | Cat#2524 |
| anti-human c-Myc (D84C12) antibodies | Cell Signaling | Cat#5605 |
| anti-beta Actin HRP conjugated monoclonal antibodies | Santa Cruz | Cat#sc-47778 HRP |
| anti-GAPDH HRP conjugated monoclonal antibodies | Santa Cruz | Cat#sc-47724 HRP |
| Mouse anti-rabbit IgG-HRP | Santa Cruz | Cat# sc-2357-CM |
| Goat anti-mouse IgG-HRP | Santa Cruz | Cat# sc-2301 |
| carboxyfluorescein diacetate succinimidyl ester | Thermo Fisher Scientific | Cat#C34554 |
| All-trans-Retinoic-acid | Sigma-Aldrich | Cat#R2625 |
| Ly-364947 | Sigma-Aldrich | Cat#L6293 |
| Rapamycin | Santa Cruz | Cat#sc-3504A |
| PD0332991 | Sigma-Aldrich | Cat#PZ0199 |
| Biological Samples | ||
| CD34-selected primary human granulocyte colony-stimulating factor (G-CSF) mobilized peripheral blood | YCCEH | https://medicine.yale.edu/labmed/ycceh/cores/core_a/cd34.aspx |
| Chemicals, Peptides, and Recombinant Proteins | ||
| Recombinant Human Thrombopoietin | ConnStem | Cat# T-1012.1 |
| Recombinant Human SCF | ConnStem | Cat# S-1000 |
| Recombinant Human Interleukin-3 | ConnStem | Cat# I-1003 |
| Recombinant Human Interleukin –6 | ConnStem | Cat# I-1003 |
| Recombinant Human EPO | Amgen | Cat# 55513-478-10 |
| Critical Commercial Assays | ||
| MegaCult-C Medium with Lipids | StemCell | Cat#04850 |
| Collagen Solution | StemCell | Cat#04902 |
| MethoCult H4435 Enriched (with Cytokines) | StemCell | Cat#04435 |
| Deposited Data | ||
| Single cell RNA-seq data that support the findings of this study have been deposited in the Gene Expression Omnibus (GEO) | GEO database | GEO:GSE112692 |
| Processed data are available at Altanalyze org | Altanalyze.org | http://altanalyze.org/ICGS/MEP/index.php |
| Experimental Models: Cell Lines | ||
| HEK293T | ATCC | ATCC CRL-3216 |
| Recombinant DNA | ||
| pLV[shRNA]-EGFP:T2A:Puro-U6 > hMYC[shRNA#1] | VectorBuilder | VB170731-1052hng |
| pLV[shRNA]-EGFP:T2A:Puro-U6 > hTP53[shRNA#1] | VectorBuilder | VB181012-1134wsj |
| pMSCV-CyclinD-CDK4 | This paper | N/A |
| pMSCV-CyclinE-CDK2 | This paper | N/A |
| pLKO.8-shMAX-1 | This paper | N/A |
| pLKO.8-shMAX-2 | This paper | N/A |
| Software and Algorithms | ||
| Bowtie2 | Langmead and Salzberg, 2012 | http://bowtie-bio.sourceforge.net/bowtie2/index.shtml |
| Cufflinks | Trapnell et al., 2012 | http://cole-trapnell-lab.github.io/cufflinks/ |
| AltAnalyze | Emig et al., 2010 | http://www.altanalyze.org/ |
| Monocle | Trapnell et al., 2014 | http://cole-trapnell-lab.github.io/monocle-release/ |
Highlights.
Single-cell sequencing reveals that MEPs have a distinct gene expression signature
MEPs represent a continuous transition state from CMPs to MKPs and ERPs
Cell cycle speed regulates MEP fate specification
ACKNOWLEDGMENTS
We are grateful to Jijun Chen and Jun Lu for viral constructs. We thank G. Lyon and Z. Tobiasova for cell sorting, and E. Cheng and M. Zhong for assistance with Fluidigm C1 single-cell preparation and sequencing. This work was supported by NIH DK094934, DK114031, and DK086267 (to D.S.K.), NIH T32HL007974 training grant (to C.S.), the CT Stem Cell Fund (to the Yale Stem Cell Center), and the Yale Cooperative Center of Excellence in Hematology (U54DK106857). This work was also supported by the Yale-Fluidigm Single Cell Grant Program.
Footnotes
DECLARATION OF INTERESTS
The authors declare no competing interests.
SUPPLEMENTAL INFORMATION
Supplemental Information includes four figures and two tables and can be found with this article online athttps://doi.org/10.1016/j.celrep.2018.10.084.
REFERENCES
- Akashi K, Traver D, Miyamoto T, and Weissman IL (2000). A clonogenic common myeloid progenitor that gives rise to all myeloid lineages. Nature 404, 193–197. [DOI] [PubMed] [Google Scholar]
- Bendall SC, Simonds EF, Qiu P, Amir AD, Krutzik PO, Finck R, Bruggner RV, Melamed R, Trejo A, Ornatsky OI, et al. (2011). Singlecell mass cytometry of differential immune and drug responses across a human hematopoietic continuum. Science 332, 687–696. [DOI] [PMC free article] [PubMed] [Google Scholar]
- Blackwood EM, and Eisenman RN (1991). Max: a helix-loop-helix zipper protein that forms a sequence-specific DNA-binding complex with Myc. Science 251, 1211–1217. [DOI] [PubMed] [Google Scholar]
- Boward B, Wu T, and Dalton S (2016). Concise Review: Control of Cell Fate Through Cell Cycle and Pluripotency Networks. Stem Cells 34, 1427–1436. [DOI] [PMC free article] [PubMed] [Google Scholar]
- Chen L, Kostadima M, Martens JHA, Canu G, Garcia SP, Turro E, Downes K, Macaulay IC, Bielczyk-Maczynska E, Coe S, et al. (2014). Transcriptional diversity during lineage commitment of human blood progenitors. Science 345, 1251033. [DOI] [PMC free article] [PubMed] [Google Scholar]
- Chen X, Hartman A, and Guo S (2015). Choosing Cell Fate Through a Dynamic Cell Cycle. Curr. Stem Cell Rep 1, 129–138. [DOI] [PMC free article] [PubMed] [Google Scholar]
- Cheng J, Guo S, Chen S, Mastriano SJ, Liu C, D’Alessio AC, Hysolli E, Guo Y, Yao H, Megyola CM, et al. (2013). An extensive network of TET2-targeting MicroRNAs regulates malignant hematopoiesis. Cell Rep. 5, 471–481. [DOI] [PMC free article] [PubMed] [Google Scholar]
- Chlon TM, and Crispino JD (2012). Combinatorial regulation of tissue specification by GATA and FOG factors. Development 139, 3905–3916. [DOI] [PMC free article] [PubMed] [Google Scholar]
- Dang CV (2012). MYC on the path to cancer. Cell 149, 22–35. [DOI] [PMC free article] [PubMed] [Google Scholar]
- Debili N, Coulombel L, Croisille L, Katz A, Guichard J, Breton-Gorius J, and Vainchenker W (1996). Characterization of a bipotent erythro-megakaryocytic progenitor in human bone marrow. Blood 88, 1284–1296. [PubMed] [Google Scholar]
- Delgado MD, and León J (2010). Myc roles in hematopoiesis and leukemia. Genes Cancer 1, 605–616. [DOI] [PMC free article] [PubMed] [Google Scholar]
- Doré LC, and Crispino JD (2011). Transcription factor networks in erythroid cell and megakaryocyte development. Blood 118, 231–239. [DOI] [PMC free article] [PubMed] [Google Scholar]
- Eisbacher M, Holmes ML, Newton A, Hogg PJ, Khachigian LM, Crossley M, and Chong BH (2003). Protein-protein interaction between Fli-1 and GATA-1 mediates synergistic expression of megakaryocyte-specific genes through cooperative DNA binding. Mol. Cell. Biol. 23, 3427–3441. [DOI] [PMC free article] [PubMed] [Google Scholar]
- Emig D, Salomonis N, Baumbach J, Lengauer T, Conklin BR, and Albrecht M (2010). AltAnalyze and DomainGraph: analyzing and visualizing exon expression data. Nucleic Acids Res. 38, W755–W762. [DOI] [PMC free article] [PubMed] [Google Scholar]
- Gekas C, and Graf T (2013). CD41 expression marks myeloid-biased adult hematopoietic stem cells and increases with age. Blood 121, 4463–4472. [DOI] [PubMed] [Google Scholar]
- Guo Y, Niu C, Breslin P, Tang M, Zhang S, Wei W, Kini AR, Paner GP, Alkan S, Morris SW, et al. (2009). c-Myc-mediated control of cell fate in megakaryocyte-erythrocyte progenitors. Blood 114, 2097–2106. [DOI] [PMC free article] [PubMed] [Google Scholar]
- Guo S, Zi X, Schulz VP, Cheng J, Zhong M, Koochaki SH, Megyola CM, Pan X, Heydari K, Weissman SM, et al. (2014). Nonstochastic reprogramming from a privileged somatic cell state. Cell 756, 649–662. [DOI] [PMC free article] [PubMed] [Google Scholar]
- Hall MA, Curtis DJ, Metcalf D, Elefanty AG, Sourris K, Robb L, Gothert JR, Jane SM, and Begley CG (2003). The critical regulator of embryonic hematopoiesis, SCL, is vital in the adult for megakaryopoiesis, erythropoiesis, and lineage choice in CFU-S12. Proc. Natl. Acad. Sci. USA 100, 992–997. [DOI] [PMC free article] [PubMed] [Google Scholar]
- Hamey FK, and Göttgens B (2017). Demystifying blood stem cell fates. Nat. Cell Biol 19, 261–263. [DOI] [PubMed] [Google Scholar]
- Ho TT, Warr MR, Adelman ER, Lansinger OM, Flach J, Verovskaya EV, Figueroa ME, and Passegué E (2017). Autophagy maintainsthe meta-bolism and function of young and old stem cells. Nature 543, 205–210. [DOI] [PMC free article] [PubMed] [Google Scholar]
- Hwang Y, Futran M, Hidalgo D, Pop R, Iyer DR, Scully R, Rhind N, and Socolovsky M (2017). Global increase in replication fork speed during a p57KIP2-regulated erythroid cell fate switch. Sci. Adv 3, e1700298. [DOI] [PMC free article] [PubMed] [Google Scholar]
- Jang KJ, Mano H, Aoki K, Hayashi T, Muto A, Nambu Y, Takahashi K, Itoh K, Taketani S, Nutt SL, et al. (2015). Mitochondrial function provides instructive signals for activation-induced B-cell fates. Nat. Commun 6, 6750. [DOI] [PMC free article] [PubMed] [Google Scholar]
- Kueh HY, Champhekar A, Nutt SL, Elowitz MB, and Rothenberg EV (2013). Positive feedback between PU.1 and the cell cycle controls myeloid differentiation. Science 341, 670–673. [DOI] [PMC free article] [PubMed] [Google Scholar]
- Kuvardina ON, Herglotz J, Kolodziej S, Kohrs N, Herkt S, Wojcik B, Oellerich T, Corso J, Behrens K, Kumar A, et al. (2015). RUNX1 represses the erythroid gene expression program during megakaryocytic differentiation. Blood 125, 3570–3579. [DOI] [PMC free article] [PubMed] [Google Scholar]
- Langmead B, and Salzberg SL (2012). Fast gapped-read alignment with Bowtie 2. Nat. Methods 9, 357–359. [DOI] [PMC free article] [PubMed] [Google Scholar]
- Magella B, Adam M, Potter AS, Venkatasubramanian M, Chetal K, Hay SB, Salomonis N, and Potter SS (2018). Cross-platform single cell analysis of kidney development shows stromal cells express Gdnf. Dev. Biol 434, 36–47. [DOI] [PMC free article] [PubMed] [Google Scholar]
- Mende N, Kuchen EE, Lesche M, Grinenko T, Kokkaliaris KD, Hanenberg H, Lindemann D, Dahl A, Platz A, Heifer T, et al. (2015). CCND1-CDK4-mediated cell cycle progression provides a competitive advantage for human hematopoietic stem cells in vivo. J. Exp. Med 212, 1171–1183. [DOI] [PMC free article] [PubMed] [Google Scholar]
- Naka K, Hoshii T, Muraguchi T, Tadokoro Y, Ooshio T, Kondo Y, Nakao S, Motoyama N, and Hirao A (2010). TGF-beta-FOXO signalling maintains leukaemia-initiating cells in chronic myeloid leukaemia. Nature 463, 676–680. [DOI] [PubMed] [Google Scholar]
- Notta F, Zandi S, Takayama N, Dobson S, Gan OI, Wilson G, Kaufmann KB, McLeod J, Laurenti E, Dunant CF, et al. (2016). Distinct routes of lineage development reshape the human blood hierarchy across ontogeny. Science 351, aab2116. [DOI] [PMC free article] [PubMed] [Google Scholar]
- Olsson A, Venkatasubramanian M, Chaudhri VK, Aronow BJ, Salomonis N, Singh H, and Grimes HL (2016). Single-cell analysis of mixed-lineage states leading to a binary cell fate choice. Nature 537, 698–702. [DOI] [PMC free article] [PubMed] [Google Scholar]
- Pauklin S, and Vallier L (2013). The cell-cycle state of stem cells determines cell fate propensity. Cell 155, 135–147. [DOI] [PMC free article] [PubMed] [Google Scholar]
- Paul F, Arkin Y, Giladi A, Jaitin DA, Kenigsberg E, Keren-Shaul H, Winter D, Lara-Astiaso D, Gury M, Weiner A, et al. (2015). Transcriptional Heterogeneity and Lineage Commitment in Myeloid Progenitors. Cell 163, 1663–1677. [DOI] [PubMed] [Google Scholar]
- Qiu X, Hill A, Packer J, Lin D, Ma YA, and Trapnell C (2017). Single-cell mRNA quantification and differential analysis with Census. Nat. Methods 14, 309–315. [DOI] [PMC free article] [PubMed] [Google Scholar]
- Randrianarison-Huetz V, Laurent B, Bardet V, Blobe GC, Huetz F, and Duménil D (2010). Gfi-1B controls human erythroid and megakaryocytic differentiation by regulating TGF-beta signaling at the bipotent erythro-megakaryocytic progenitor stage. Blood 115, 2784–2795. [DOI] [PubMed] [Google Scholar]
- Rundberg Nilsson A, Soneji S, Adolfsson S, Bryder D, and Pronk CJ (2016). Human and Murine Hematopoietic Stem Cell Aging Is Associated with Functional Impairments and Intrinsic Megakaryocytic/Erythroid Bias. PLoS ONE 11, e0158369. [DOI] [PMC free article] [PubMed] [Google Scholar]
- Sanada C, Xavier-Ferrucio J, Lu YC, Min E, Zhang PX, Zou S, Kang E, Zhang M, Zerafati G, Gallagher PG, and Krause DS (2016). Adult human megakaryocyte-erythroid progenitors are in the CD34+CD38mid fraction. Blood 128, 923–933. [DOI] [PMC free article] [PubMed] [Google Scholar]
- Sanjuan-Pla A, Macaulay IC, Jensen CT, Woll PS, Luis TC, Mead A, Moore S, Carella C, Matsuoka S, Bouriez Jones T, et al. (2013). Plateletbiased stem cells reside at the apex of the haematopoietic stem-cell hierarchy. Nature 502, 232–236. [DOI] [PubMed] [Google Scholar]
- Soufi A, and Dalton S (2016). Cycling through developmental decisions: how cell cycle dynamics control pluripotency, differentiation and reprogramming. Development 143, 4301–4311. [DOI] [PMC free article] [PubMed] [Google Scholar]
- Spandidos A, Wang X, Wang H, and Seed B (2010). PrimerBank: a resource of human and mouse PCR primer pairs for gene expression detection and quantification. Nucleic Acids Res. 38, D792–D799. [DOI] [PMC free article] [PubMed] [Google Scholar]
- Stachura DL, Chou ST, and Weiss MJ (2006). Early block to erythromegakaryocytic development conferred by loss of transcription factor GATA-1. Blood 107, 87–97. [DOI] [PMC free article] [PubMed] [Google Scholar]
- Takayama N, Nishimura S, Nakamura S, Shimizu T, Ohnishi R, Endo H, Yamaguchi T, Otsu M, Nishimura K, Nakanishi M, et al. (2010). Transient activation of c-MYC expression is critical for efficient platelet generation from human induced pluripotent stem cells. J. Exp. Med 207, 2817–2830. [DOI] [PMC free article] [PubMed] [Google Scholar]
- Torre E, Dueck H, Shaffer S, Gospocic J, Gupte R, Bonasio R, Kim J, Murray J, and Raj A (2018). Rare Cell Detection by Single-Cell RNA Sequencing as Guided by Single-Molecule RNA FISH. Cell Syst. 6, 171–179.e5. [DOI] [PMC free article] [PubMed] [Google Scholar]
- Trapnell C, Roberts A, Goff L, Pertea G, Kim D, Kelley DR, Pimental H, Salzberg SL, Rinn JL, and Pachter L (2012). Differential gene and transcript expression analysis of RNA-seq experiments with TopHat and Cufflinks. Nat. Methods 7, 562–578. [DOI] [PMC free article] [PubMed] [Google Scholar]
- Trapnell C, Cacchiarelli D, Grimsby J, Pokharel P, Li S, Morse M, Lennon NJ, Livak KJ, Mikkelsen TS, and Rinn JL (2014). Thedynamics and regulators of cell fate decisions are revealed by psuedotemporal ordering of single cells 32, 381–386. [DOI] [PMC free article] [PubMed] [Google Scholar]
- Tripic T, Deng W, Cheng Y, Zhang Y, Vakoc CR, Gregory GD, Hardison RC, and Blobel GA (2009). SCL and associated proteins distinguish active from repressive GATA transcription factor complexes. Blood 113, 2191–2201. [DOI] [PMC free article] [PubMed] [Google Scholar]
- Vannucchi AM. Paoletti F, Linari S, Cellai C, Caporale R, Ferrini PR, Sanchez M, Migliaccio G, and Migliaccio AR (2000). Identification and characterization of a bipotent (erythroid and megakaryocytic) cell precursor from the spleen of phenylhydrazine-treated mice. Blood 95, 2559–2568. [PubMed] [Google Scholar]
- Velten L, Haas SF, Raffel S, Blaszkiewicz S, Islam S, Hennig BP, Hirche C, Lutz C, Buss EC, Nowak D, et al. (2017). Human haematopoietic stem cell lineage commitment is a continuous process. Nat. Cell Biol 19, 271–281. [DOI] [PMC free article] [PubMed] [Google Scholar]
- Wang X, Chu Y, Wang W, and Yuan W (2016). mTORC signaling in hematopoiesis. Int. J. Hematol. 103, 510–518. [DOI] [PubMed] [Google Scholar]
- Xavier-Ferrucio J, and Krause DS (2018). Concise Review: Bipotent Megakaryocytic-Erythroid Progenitors: Conceptsand Controversies. Stem Cells 36, 1138–1145. [DOI] [PMC free article] [PubMed] [Google Scholar]
- Xavier-Ferrucio J, Ricon L, Vieira K, Longhini AL, Lazarini M, Bigarella CL, Franchi G Jr., Krause DS, and Saad STO (2018). Hematopoietic defects in response to reduced Arhgap21. Stem Cell Res. (Amst.) 26, 17–27. [DOI] [PMC free article] [PubMed] [Google Scholar]
Associated Data
This section collects any data citations, data availability statements, or supplementary materials included in this article.
Supplementary Materials
Data Availability Statement
Single cell RNA-seq data that support the findings of this study have been deposited in the Gene Expression Omnibus (GEO) under accession code GSE112692. Processed data are available athttp://altanalyze.org/ICGS/MEP/index.php for browsing. All other data supporting the findings of this study are available from the corresponding author upon reasonable request.